IDX Composite (JKSE) MSCI's Indonesia Rule Change NEWS:
MSCI is changing how it calculates the free float specifically for Indonesian shares, as it assesses that the data on public ownership has been inaccurate.
Key Changes:
The free float will be calculated by taking the lower figure between the data from company reports and the data from KSEI (which categorizes "corporate," "others," and "scrip" ownership as non-free float).
This rule will be tested until the end of 2025 and officially implemented in the May 2026 review.
MSCI is also changing its free float rounding rule, which could lower the index weight of some stocks.
Implications:
Since many Indonesian shares are owned by large corporate groups, the free float figure will decrease, potentially reducing Indonesia's overall weight in the MSCI indices.
Consequently, the potential for foreign outflows increases (due to index weight adjustments).
Four stocks are at the highest risk of being deleted from the index: CUAN, ICBP, KLBF, and INDF.
In short:
MSCI is making the free float calculation for Indonesia stricter and more realistic—the effect could trigger foreign fund outflows from several large-cap stocks as their weights are expected to fall.
Technical Analysis:
*The chart tells everything.
Trade ideas

Indonesia’s Stock Market at a Crossroad: Will Composite Index (IIHSG Weekly Outlook: Testing the Upper Channel as Momentum Weakens
Market Overview
The Indonesia Composite Index (IHSG) has maintained a broad uptrend structure for nearly a decade, supported by the nation’s resilient macroeconomic backdrop and continued investor appetite for domestic equities. Since 2015, the index has moved within a long-term ascending channel, establishing higher highs and higher lows across major cycles.
However, as of late October 2025, IHSG is testing a critical inflection zone near the upper boundary of this long-term channel, positioned between 8,200 and 8,300. The market has shown hesitation around this area, with several sessions of profit-taking emerging after briefly touching the upper resistance line.
While the broader trend remains constructive, early signs of momentum loss are becoming visible on key technical indicators such as the MACD and Stochastic RSI, suggesting that the index may be entering a short-term cooling phase following its strong multi-month rally.
Long-Term Structure: The Channel That Defines the Trend
A glance at the weekly chart reveals that IHSG has been respecting a well-defined ascending channel since 2015. Each cycle low—seen in 2015, 2020, and 2023—was followed by an upward recovery that consistently brought prices back toward the upper channel resistance.
This channel not only defines the market’s long-term bullish rhythm but also serves as a visual gauge for potential overextension. Every time IHSG approached the top boundary, a period of consolidation or technical correction followed. The most recent move is consistent with this historical pattern: as the index touched the upper channel near 8,300, selling pressure started to emerge, indicating that investors may be locking in profits after a prolonged advance.
From a structural perspective, the primary uptrend remains intact. The support zone around 7,700–7,800 marks the midline area and is crucial for maintaining bullish momentum. A weekly close below this support could trigger a deeper retracement toward the lower band of the channel around 7,300–7,400.
As long as IHSG stays above 7,700, the medium-term outlook remains positive, but the index is now at a stage where upward progress may become more gradual and selective.
MACD: Momentum Losing Steam
The Moving Average Convergence Divergence (MACD) indicator, a key measure of market momentum, remains in the positive territory but is showing the first signs of softening. The histogram bars, which measure the difference between the MACD line and its signal line, have started to narrow. This suggests that bullish momentum, while still present, is fading in strength.
Historically, similar MACD slowdowns on the weekly timeframe have preceded sideways phases or corrective waves lasting several weeks. If the MACD line crosses below its signal line in the coming sessions, it would confirm a bearish crossover, increasing the probability of a short-term pullback.
At this stage, it’s not an outright reversal signal, rather, a warning that the rally is maturing. For swing traders and portfolio managers, this is typically a period to scale back aggressive long positions, lock in partial profits, and reassess exposure to sectors that have already priced in strong earnings growth or macro optimism.
Stochastic RSI: From Overbought to Cooling Down
Read full analysis on :
darrismanresearch com
join telegr Channel :
Saham Kita

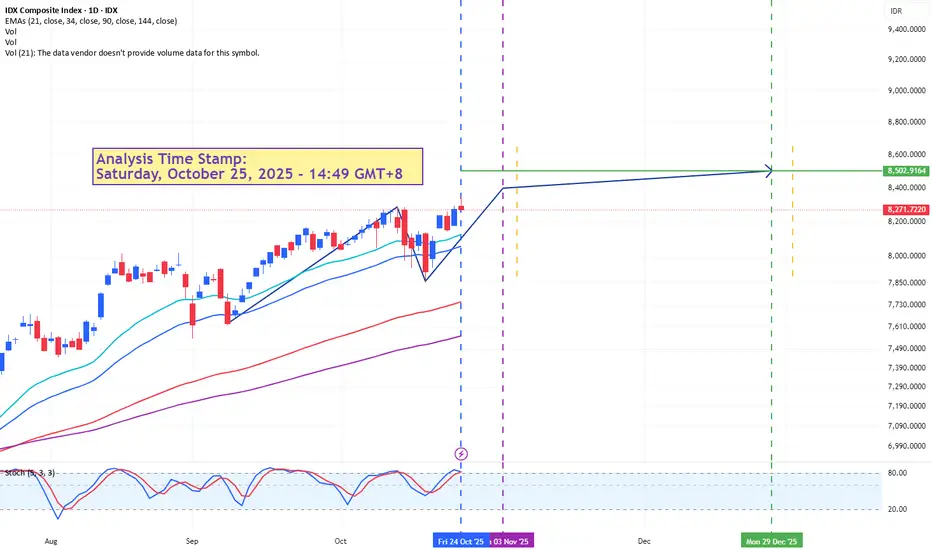
IDX Composite (JKSE) Forecast: Q4 2025 Trend ProjectionFundamental:
-
Technical Analysis:
-This analysis was created using candle calculations multiplied by the Fibonacci golden ratio.
-There is a high potential for November 3, 2025, to be a retracement stopping point, which is close to the Full Moon phase on November 5, 2025. The Bullish trend is then expected to continue until December 29, 2025, a date close to the next Full Moon phase on January 3, 2026.
Note:
-The projected dates have a tolerance of ±1 to ±2 days.
-This analysis becomes invalid if future (market) data does not support it.
IDX:CDIA IDX:COMPOSITE
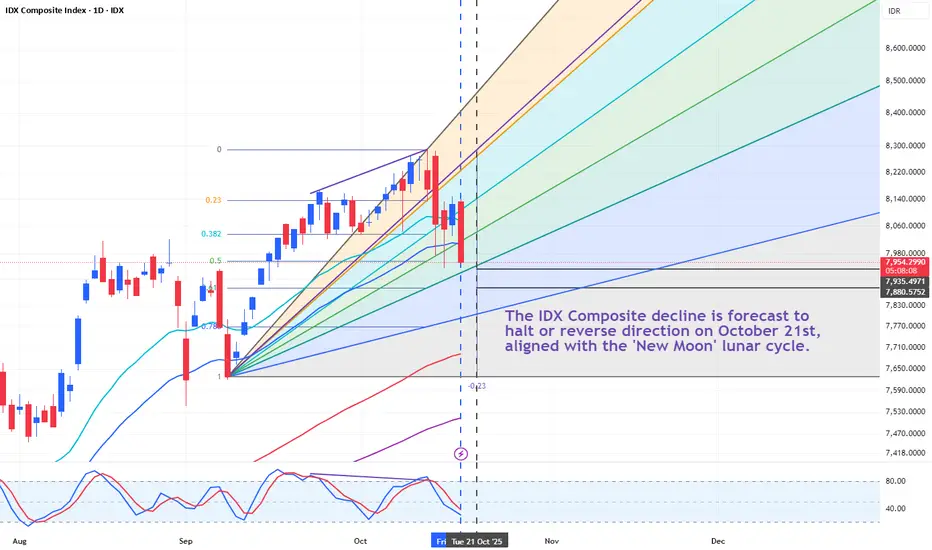
Forecasting a Halt in the IDX Composite (JKSE) DeclineFundamental Analysis:
-
Technical Analysis:
A bearish stochastic divergence has appeared on the Daily chart, signaling that a downward trend is currently taking place, the IDX Composite decline is forecast to halt or reverse direction on October 21st, aligned with the 'New Moon' lunar cycle.
Conclusion:
closely monitor the market on October 21st and ensure you have cash ready.
IDX:COMPOSITE IDX:CDIA IDX:PANI
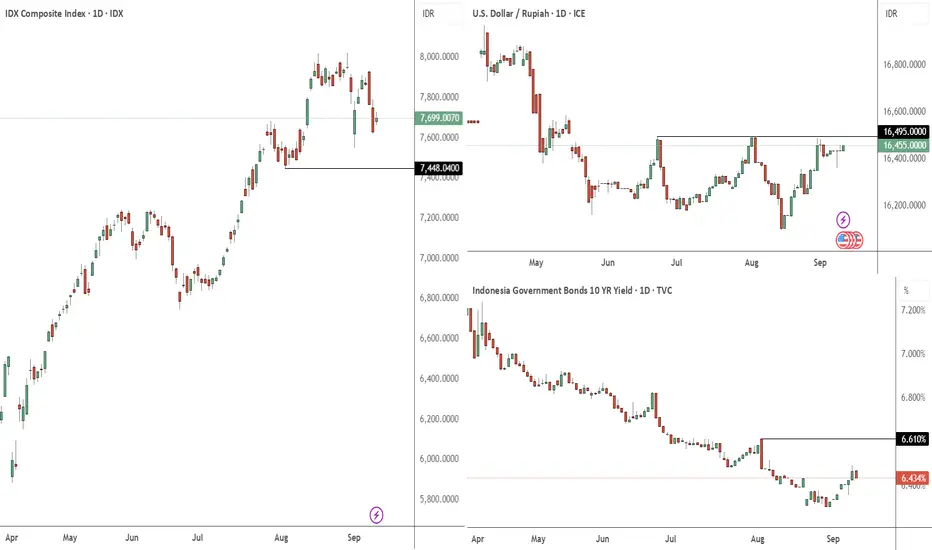
Three Key Charts To Watch for Indonesia Right NowThe market appears to be at a significant decision point, reacting to the recent cabinet changes (especially Minister of Finance). The price action across these three key charts suggests investors are cautious.
IDX Composite (JCI): The index has pulled back from its recent highs and is now testing a critical support level around 7,448. While the longer-term trend remains bullish, a break below this support would increase the probability of a bearish reversal, signaling growing investor concern.
USD/IDR: The currency pair is pushing against a well-defined resistance at approximately 16,455. The price has been consolidating below this level for months. A decisive breakout above this ceiling would confirm Rupiah weakness and suggest a higher likelihood of capital outflows.
Indonesia 10Y Bond Yield: After a period of decline, yields are now trending upward. A move above the resistance near 6.616% would indicate that investors are selling government bonds. This is a classic sign of increasing risk aversion in the market.
In short, a breakdown of support in the JCI, combined with breakouts in the USD/IDR and bond yields, would confirm a broad-based negative sentiment from investors.
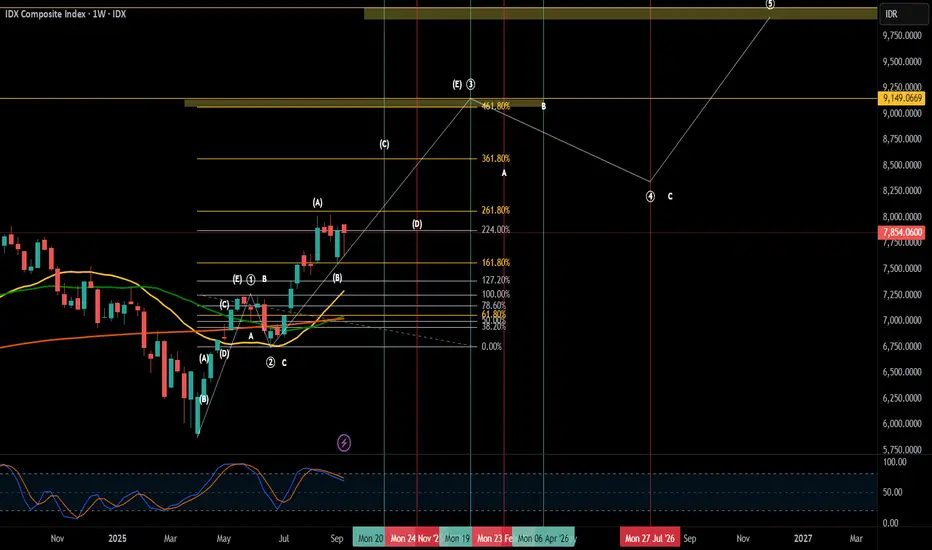
IDX Roadmap Impulsive Bullish Trend📈 IDX Roadmap — Impulsive Bullish Trend
This roadmap outlines a potential impulsive bullish structure on the IDX Composite Index over the medium to long term.
The projection is based on Elliott Wave structure combined with Fibonacci Extension levels to map out possible price trajectories.
🟢 Green Vertical Lines — Vibrational Date (Bull)
Indicate potential bullish acceleration phases, aligned with wave cycle timing and supported by technical signals from moving averages and the stochastic oscillator.
🔴 Red Vertical Lines — Vibrational Date (Bear)
Indicate potential short-term corrective (bearish) phases, expected before the main bullish trend resumes.
📌 Note:
- This roadmap is not a buy/sell recommendation. It’s meant as a big-picture directional guide to help anticipate market behavior.
-Always apply risk management and look for confirmation on lower timeframes.
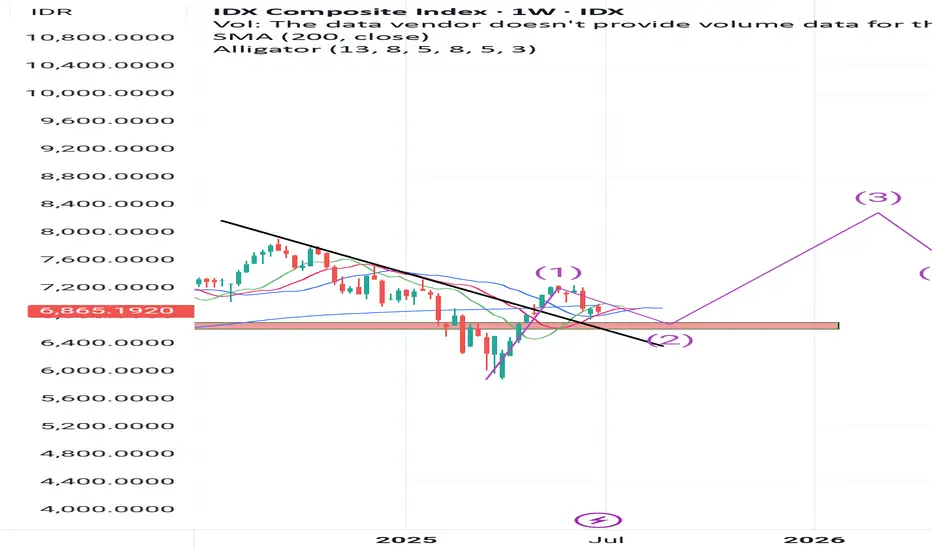
IDX Composite: Bullish in medium term- long termIDX is currently entering wave 2 (correction wave) with a target decline in the range of 6600-6800 (supply zone).
In my opinion, this decline is part of the move towards wave 3 (bullish wave) in the medium term.
Investment strategy:
Gradual collection of bluechip stocks in the banking sector, commodities when the JCI is corrected approaching the supply zone and Collect for a period of 1-1.5 years.
For me, the JCI has just started entering a long-term Bullish wave.
IHSG / COMPOSITE (IDX) DAILY CHART DOUBLE TOP DETECTEDIHSG going to close the gap at 65xx.. (first gap).
the worst case IHSG will close the 2nd gap (61xx) << Mostly happened.
after that we hope IHSG will start to Bullish once more.
so just wait n see for now. After IHSG closing all the gap, we can start buying all the bluchip stock like banking sector (BBRI, BBCA, BMRI, BBNI).

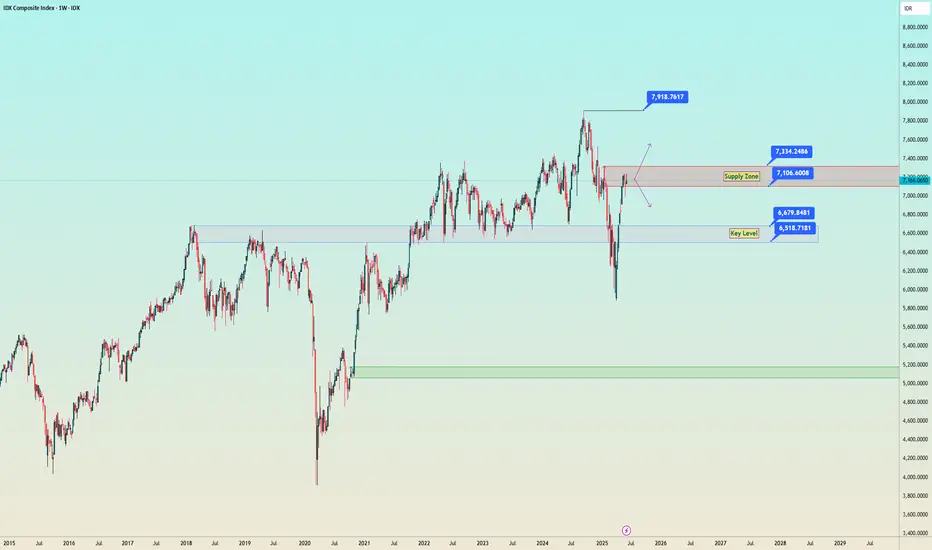
IHSG / IDX - Wait and See...Continue or pullback ?
Currently our IDX Composite in Supply Zone and Candle stick shown push back from Seller since last week.
Need to get confirmation whether this week IDX will pass the supply zone or it will pull back to "key level" area.
Enjoy !
IHSG AFTER BREAKMarket globally is crashed because of the new tariff that US applied. IHSG might as well crashed after this break, approaching 58xx. But i believe after this correction IHSG Will back in action and reach 67xx.

IHSG 36000IHSG will go to 36000
Currently, the prediction for the Jakarta Composite Index (JCI) is still far from 36,000. Based on the latest analysis, the JCI is estimated to move in the range of 6,800 to 7,150 in the short term. Positive sentiment from the trade deal between the United States and China has indeed provided encouragement, but this strengthening is still considered limited and prone to technical corrections. If there are major factors that can push the JCI to a much higher level, such as extraordinary economic growth or a surge in foreign investment, then there may be an opportunity to achieve a more ambitious figure. However, for now, the realistic target is still in the range mentioned.

COMPOSITE Is About To End The DowntrendIDX:COMPOSITE
As the picture says, currently COMPOSITE aka IHSG is forming broadening wedge pattern. This pattern indicates bullish potential, but hasn't been confirmed since the current level is still below 6500.
Most stocks will start going up after the confirmation of this pattern, so use this moment to buy on weakness on your favorite stocks.
Our picks: BBNI BBCA ITMG GOTO


$IDX:COMPOSITE
This scenario was created due to the effects of the trade war and when the tariff was announced, the IDX Indonesia stock market was on a long holiday.
I predict that IHSG could GAP DOWN when it open on 8th April here some of my view :
Black line scenario 1 Correction 6265 5% Close Gap & Trading Halt tomorrow rebound and continue to decline to the support limit of 5700.
Red line scenario 2 Correction 6265 (5%) Close Gap & Trading Halt tomorrow continue the next decline 6000 rejection at 5700.
Green line scenario 3 Healthy correction 6350 and tomorrow break resistance to 6700.
IDX:COMPOSITE

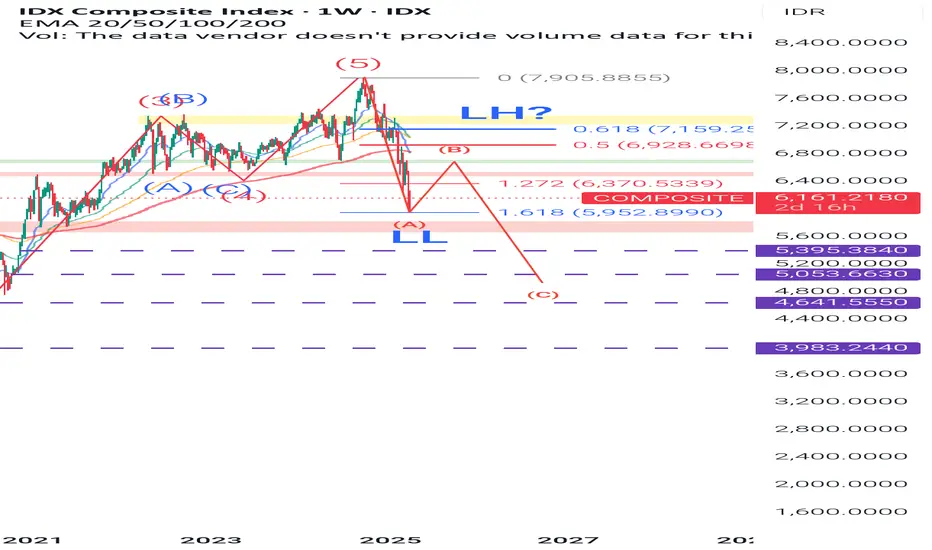
Big Bearish IHSGMy POV to IHSG
Big Elliot Wave 5 is finished & almost finished making a big Correction to point A.
Will continue to make LH to point B & if confirmed point B is continued there is a rejection at resistance, meaning it is mandatory to sell all stocks in any position (profit / loss).
Focus on saving, collecting money & wait again when Correction C is finished.
When? Maybe point B will be finished in 4-6 months.
We will see, this is not spreading fear, but more the best investment strategy.
Later it will be updated again based on news, fundamentals & macro news in Indonesia and globally.
IHSG toward 2nd Monthly FVGIHSG is continuing its strong bearish movement. Yet, indication for reversal is far beyond. Considering this condition, "do nothing" is the best strategy until the Whale Investor accumulate.

“IDX Composite Index: Assessing the Depth of the Downtrend”The IDX Composite Index is expected to remain under pressure, forming wave of wave A. The nearest corrective target for the index is projected in the 5,879–5,975.
This outlook aligns with prevailing market sentiments, as Indonesia’s economic and political landscape has yet to support a trend reversal. Additionally, global sentiment remains negative, further weighing on the index.

IHSG where are u going guys?Disc On. There will be at least 2 scenario that will occur to IHSG next "big flow" which might be breakout the existing resistance and keep skyrocket to new ATH (everybody hope so) but i have one view also that IHSG will do one more trading halt till the support area. Hence, this is not a very practical analysis only a rough view and I personally take this opportunity to view and see first before getting fully at the market. Like every good inverstor said, cash is also a position.

IHSGNot a positive sentiment and also technically not looking good
Bearish bias remains dominant :
Potential retracement to 6310 - 6400 before further decline
Downside targets: 6000 - 5900 (key support level)
If 5900 is broken, a further drop to 5600 - 5500 is possible
I hope im wrong :(
lately there have been a lot of buyback news in conglomerate and bluechip stocks (bbca,Adaro group and Barito group). But in reality it still hasnt been able to counter foreign movements
So, its best to wait and see for now

IHSG (JCI ) MAPPING 20 MARCH 2025IHSG (JCI ) analysis on March 20, 2025 theoretically shows that it has completed the triple zigzag wave correction (WXYZ) with 11 swings of the Elliott wave correction series and touched the theoretical level of 0.618 (area 6,018.22) Fibonacci extension measurements. In addition, it has also touched its Fresh Demand Weekly area and reacted upwards. So the hope for the future is that IHSG (JCI ) will continue it's big bullish trend journey again after being corrected.
May we be blessed.

MAPPING JCI 20 MARCH 2025JCI analysis on March 20, 2025 theoretically shows that it has completed the triple zigzag wave correction (WXYZ) with 11 swings of the Elliott wave correction series and touched the theoretical level of 0.618 Fibonacci extension measurements. In addition, it has also touched its Fresh Demand Weekly area and reacted upwards. So the hope for the future is that JCI will continue it's big bullish trend journey again after being corrected.
May we be blessed.


WILL IHSG SURVIVE IT 6,500 LEVELS? 1. Trend & Market Structure
IHSG is still in a downtrend, indicated by lower highs and lower lows.
The price recently attempted to break the downtrend line, but there are signs of a false breakout as it dropped again near resistance.
2. Support & Resistance Levels
Nearest Support: 6,500 - 6,530 (currently being tested).
Strong Support: 6,260 - 6,170 (if further breakdown occurs).
Nearest Resistance: 6,583 - 6,683 (a level that needs to be broken for short-term bullish confirmation).
Major Resistance: 6,907 (a strong resistance that could signal a trend reversal if broken).
3. Indicators & Further Signals
Short-term EMA/MA: The price is moving around a small moving average (possibly MA5 or MA10), indicating uncertainty about whether it will continue rising or get rejected downward.
Candle Pattern: A doji or rejection candle is forming near minor resistance, which could signal potential weakness.
Breakout Trendline?: The price has briefly moved above the downtrend line, but confirmation is needed to determine if this is a valid breakout or just a retest before dropping again.
4. IHSG Projection
Bullish Scenario: If IHSG can hold above 6,530 and break through 6,583-6,683, it could continue rising towards 6,900.
Bearish Scenario: If it fails to stay above 6,530, it may drop further to the strong support zone of 6,260-6,170.
Conclusion:
Right now, IHSG is at a crucial level. It’s important to see whether it can hold above 6,530 or break down further. If you're trading in the short term, wait for confirmation to see if IHSG will break out or face rejection from this level.
