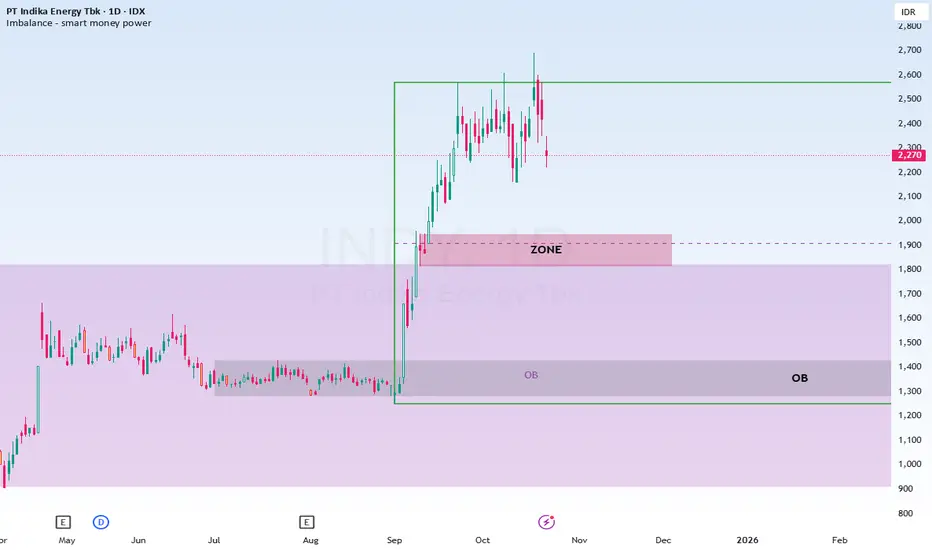
INDY: Patience at Play, Waiting for the PullbackWaiting for price to correct into one of the order block zones. If it reacts well, we might see a continuation pattern unfold. Staying patient and watching key levels. #INDY #PriceAction
PT Indika Energy Tbk
No trades
−70 IDR
159.78 B IDR
38.77 T IDR
1.49 B
About PT Indika Energy Tbk
Sector
Industry
CEO
Azis Armand
Website
Headquarters
Jakarta
Founded
2000
IPO date
Jun 11, 2008
Identifiers
2
ISIN ID1000110901
PT Indika Energy Tbk engages in the coal mining business. It operates through the following segments: Energy Resources, Energy Services, Energy Infrastructure, Logistic and Infrastructure, Mineral, Green Business, and Digital Ventures. The Energy Resources segment deals produces and distributes coal products. The Energy Services segment offers engineering, procurement, construction, and contract mining operations. The Energy Infrastructure segment manages power generation plant. The company was founded on October 19, 2000 and is headquartered in Jakarta, Indonesia.
Related stocks
INDYBUY now and SL 1,270, last support 885.
If it doesn't break 885, you can buy again.
TP1 2,200
TP2 3,250
if it reaches 2,200 you can hold until tp2

#INDY LongCup and handle patter in the making, Volume rising align with the price, low volume correction. I'll wait in the neckline

INDY Elliott Wave CountIs INDY set to make a Head and Shoulders pattern by making and upside correction?
The chart tells me so. We are at a demand zone from 2021 as you can see from those choppy candles. I believe theres little risk if we enter now.

INDY - POTENTIAL UPSIDEas long as INDY can breakout the resistance area which is between 2070 - 2170 as well as breakout the EMA 100, I assume INDY will continue to go to the next resistance area range 2450 - 2580. The potential upside for this trading will is about 13% - 19%. put the stop loss at 8%

INDY: Inverted Head & ShouldersDuring its super cycle, IDX:INDY forming an Inverted Head & Shoulders pattern with expected target price around 8900 on Q4'25.
Currently it forms low (L) - higher low (HL) - higher low (HL), the upcoming HL supposed to be around level 1375 to 1535, somewhere in Q3'23.
Do you agree to put IDX:IND

INDY (VCP - 26W 32/5 4T)I got my pilot position on 30 Aug 2022.
The stock breakout of that majority line of supply.
Today, I don't add to my position due to my progressive exposure plays. I'm not getting so aggressive yet.


INDY (VCP - 13W 33/5 4T)I've secured my positions in this quintessential VCP setup.
The stock is a potential superperformer, it has all the characteristics. It has a low-risk entry, powerful earnings, high RS Line.

See all ideas
Summarizing what the indicators are suggesting.
Neutral
SellBuy
Strong sellStrong buy
Strong sellSellNeutralBuyStrong buy
Neutral
SellBuy
Strong sellStrong buy
Strong sellSellNeutralBuyStrong buy
Neutral
SellBuy
Strong sellStrong buy
Strong sellSellNeutralBuyStrong buy
An aggregate view of professional's ratings.
Neutral
SellBuy
Strong sellStrong buy
Strong sellSellNeutralBuyStrong buy
Neutral
SellBuy
Strong sellStrong buy
Strong sellSellNeutralBuyStrong buy
Neutral
SellBuy
Strong sellStrong buy
Strong sellSellNeutralBuyStrong buy
Displays a symbol's price movements over previous years to identify recurring trends.
PDET5799355
PT Indika Energy Tbk 8.75% 07-MAY-2029Yield to maturity
8.61%
Maturity date
May 7, 2029
PDET5840472
PT Indika Energy Tbk 8.75% 07-MAY-2029Yield to maturity
—
Maturity date
May 7, 2029
See all INDY bonds
Frequently Asked Questions
The current price of INDY is 3,560 IDR — it has decreased by −0.84% in the past 24 hours. Watch PT Indika Energy Tbk stock price performance more closely on the chart.
Depending on the exchange, the stock ticker may vary. For instance, on IDX exchange PT Indika Energy Tbk stocks are traded under the ticker INDY.
INDY stock has risen by 11.95% compared to the previous week, the month change is a 8.54% rise, over the last year PT Indika Energy Tbk has showed a 135.76% increase.
We've gathered analysts' opinions on PT Indika Energy Tbk future price: according to them, INDY price has a max estimate of 3,750.00 IDR and a min estimate of 3,750.00 IDR. Watch INDY chart and read a more detailed PT Indika Energy Tbk stock forecast: see what analysts think of PT Indika Energy Tbk and suggest that you do with its stocks.
INDY reached its all-time high on Jan 4, 2011 with the price of 5,550 IDR, and its all-time low was 110 IDR and was reached on Dec 15, 2015. View more price dynamics on INDY chart.
See other stocks reaching their highest and lowest prices.
See other stocks reaching their highest and lowest prices.
INDY stock is 3.39% volatile and has beta coefficient of 1.03. Track PT Indika Energy Tbk stock price on the chart and check out the list of the most volatile stocks — is PT Indika Energy Tbk there?
Today PT Indika Energy Tbk has the market capitalization of 18.52 T, it has increased by 7.99% over the last week.
Yes, you can track PT Indika Energy Tbk financials in yearly and quarterly reports right on TradingView.
INDY net income for the last quarter is −28.88 B IDR, while the quarter before that showed −10.80 B IDR of net income which accounts for −167.46% change. Track more PT Indika Energy Tbk financial stats to get the full picture.
Yes, INDY dividends are paid annually. The last dividend per share was 15.95 IDR. As of today, Dividend Yield (TTM)% is 0.45%. Tracking PT Indika Energy Tbk dividends might help you take more informed decisions.
PT Indika Energy Tbk dividend yield was 1.07% in 2024, and payout ratio reached 51.88%. The year before the numbers were 6.42% and 26.30% correspondingly. See high-dividend stocks and find more opportunities for your portfolio.
As of Feb 15, 2026, the company has 3.86 K employees. See our rating of the largest employees — is PT Indika Energy Tbk on this list?
EBITDA measures a company's operating performance, its growth signifies an improvement in the efficiency of a company. PT Indika Energy Tbk EBITDA is 2.09 T IDR, and current EBITDA margin is 7.81%. See more stats in PT Indika Energy Tbk financial statements.
Like other stocks, INDY shares are traded on stock exchanges, e.g. Nasdaq, Nyse, Euronext, and the easiest way to buy them is through an online stock broker. To do this, you need to open an account and follow a broker's procedures, then start trading. You can trade PT Indika Energy Tbk stock right from TradingView charts — choose your broker and connect to your account.
Investing in stocks requires a comprehensive research: you should carefully study all the available data, e.g. company's financials, related news, and its technical analysis. So PT Indika Energy Tbk technincal analysis shows the buy rating today, and its 1 week rating is strong buy. Since market conditions are prone to changes, it's worth looking a bit further into the future — according to the 1 month rating PT Indika Energy Tbk stock shows the strong buy signal. See more of PT Indika Energy Tbk technicals for a more comprehensive analysis.
If you're still not sure, try looking for inspiration in our curated watchlists.
If you're still not sure, try looking for inspiration in our curated watchlists.