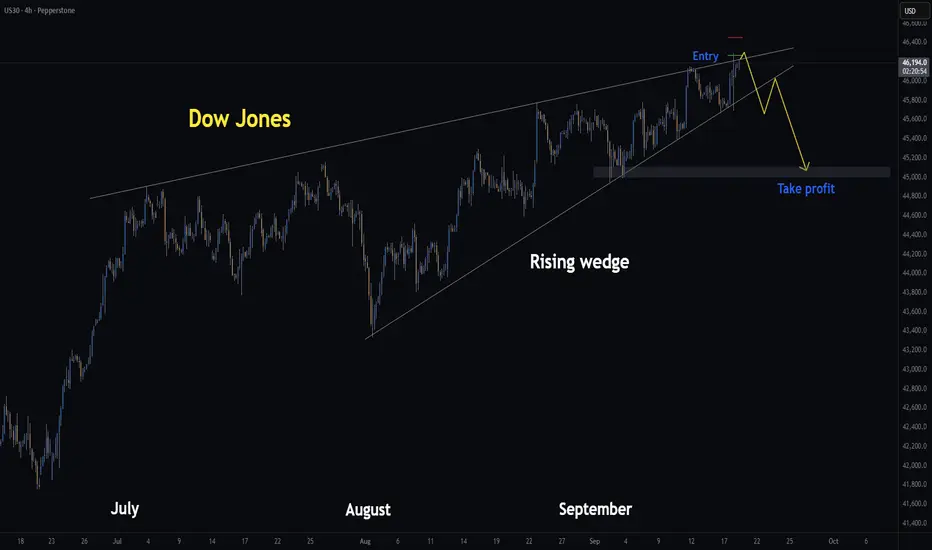
Dow Jones | H4 Rising Wedge | GTRadingMethod👋 Hello Traders.
Yesterday I mentioned I’d be watching for a breakout and retest setup — that plan still stands. However, I’ve also taken a short position off the diagonal resistance line.
🧐 Market Overview:
I’m currently seeing rising wedge structures across Nasdaq, S&P, Russell 2000, and Dow Jones. These patterns typically lean bearish, and I can’t ignore the confluence. That said, wedges can fail, and with the market leaning bullish after of the FOMC announcement, I’m aware this is swimming against the trend.
📊 Trade Plan:
Risk/Reward: 6.7
Entry: 46 267
Stop Loss: 46 450
Take Profit 1 (50%): 45 000
Take Profit 2 (50%): 45 000
(I’m already short from 46 267 and will look to add if price retests that level.)
💡 GTradingMethod Tip:
Bearish patterns like rising wedges can offer high R/R setups, but always remember — strong bullish backdrops (like major data events) can cause them to fail. Risk management is everything.
🙏 Thanks for checking out my post!
Make sure to follow me to catch the next idea and share your thoughts on what you think the markets will do today and how you would trade rising wedges :)
📌 Please note:
This is not financial advice. This content is to track my trading journey and for educational purposes only.
DOW trade ideas
Dow at record highs, outperfoms peers! But are risks brewing?The Dow Jones DJIA surged to new record highs, driven by defensive sector strength and expectations of Fed rate cuts. Dow outperformed due to its heavier weighting in defensive sectors (industrials, financials, consumer staples), which are favoured during economic uncertainty and falling yields. Technical analysis suggests further upside potential, as investors seek stability and dividends in Dow components amid lingering recession risks. However, key support levels must hold to sustain the rally.
The Dow has completed a V-shaped recovery, breaking above previous double-top highs from 2024/2025 (45,150), now acting as support. An open triangle pattern was identified, with the current move likely the fifth wave to the upside. The index trades above all major moving averages, confirming bullish momentum, but RSI shows hidden bullish divergence, supporting the case for continued upside only if support holds after a pullback.
Dow has critical support at 45k, must hold to maintain bullish momentum. A drop below 45,581 could trigger a correction. Short-term upside shows 47k, with a major Fibonacci cluster and technical inflexion in focus. Intermediate levels sit at 46300/45900/45640, with important long-term Targets at 45k, 49500, 50k, 53k.
Risks & Potential Scenarios
Divergence: Despite strong momentum, technical divergence suggests a possible corrective move if the Dow falls below 45581.
Bullish : Holding above 45581 and 45k supports further upside toward 47k and beyond.
Bearish : A break below 45581 could trigger a deeper pullback before any renewed rally.
Market Sentiment :
The bond market’s caution contrasts with stock market optimism, so stay vigilant.
This content is not directed to residents of the EU or UK. Any opinions, news, research, analyses, prices or other information contained on this website is provided as general market commentary and does not constitute investment advice. ThinkMarkets will not accept liability for any loss or damage including, without limitation, to any loss of profit which may arise directly or indirectly from use of or reliance on such information.

Us30 Trade Set Up Sep 18 2025www.tradingview.com
Price has swept PDH and pushed down hard inverting 1h FVGs and creating a bearish 1h FVH so if price continues to make internal bearish structure i will look for sells down to PDH

BEARISH ESCENARIO15m chart accumulation forming right now, expecting a sweep of liquidity to the upside tomorrow.

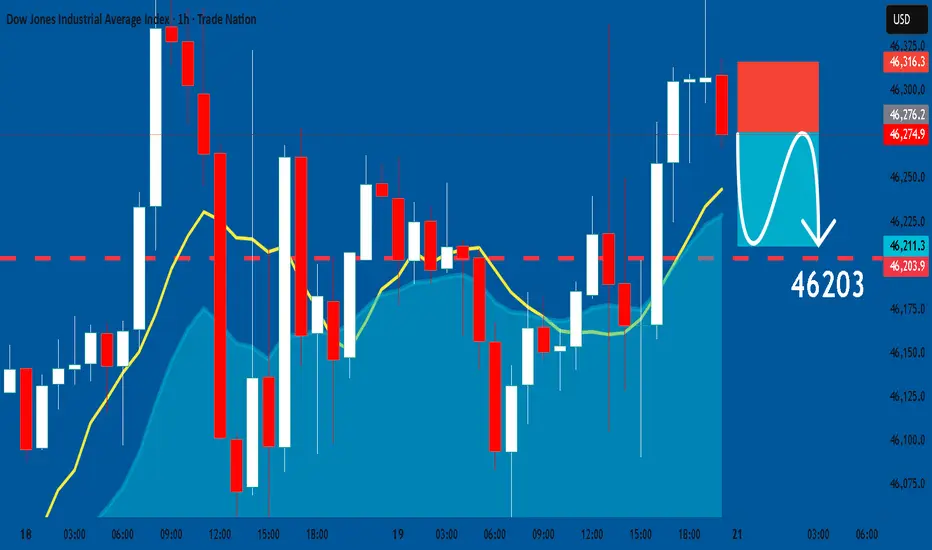
US30: Short Signal Explained
US30
- Classic bearish formation
- Our team expects pullback
SUGGESTED TRADE:
Swing Trade
Short US30
Entry - 46276
Sl - 46316
Tp - 46203
Our Risk - 1%
Start protection of your profits from lower levels
Disclosure: I am part of Trade Nation's Influencer program and receive a monthly fee for using their TradingView charts in my analysis.
❤️ Please, support our work with like & comment! ❤️
DOW/US30 - TIME FOR A KILLTeam, we have not been trading DOW/US30 since last week's successful short
WHY, we wait for the rate decision to come out
NOW, investors' hope is invalid, no momentum for a rate cut
LETs short the beast at 46135-46160
STOP LOSS AT 46250- OR 46280
EASY TARGET AT 46117-46070 - take partial 50-70% and bring stop loss to BE
2ND TARGET at 45972-45955
LETS GO

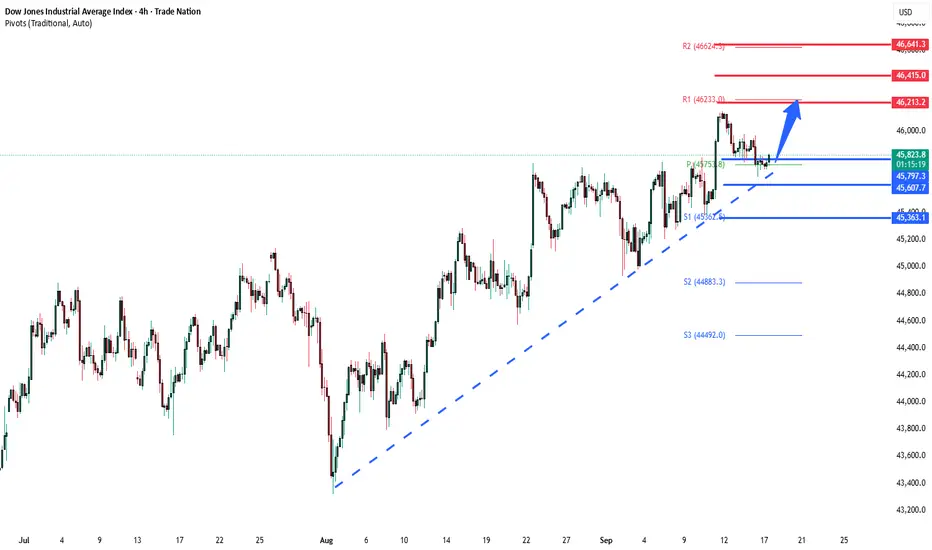
DowJones Key Tradin Levels - triple-witching dayKey Support and Resistance Levels
Resistance Level 1: 46415
Resistance Level 2: 46640
Resistance Level 3: 46860
Support Level 1: 45800
Support Level 2: 45600
Support Level 3: 45360
This communication is for informational purposes only and should not be viewed as any form of recommendation as to a particular course of action or as investment advice. It is not intended as an offer or solicitation for the purchase or sale of any financial instrument or as an official confirmation of any transaction. Opinions, estimates and assumptions expressed herein are made as of the date of this communication and are subject to change without notice. This communication has been prepared based upon information, including market prices, data and other information, believed to be reliable; however, Trade Nation does not warrant its completeness or accuracy. All market prices and market data contained in or attached to this communication are indicative and subject to change without notice.

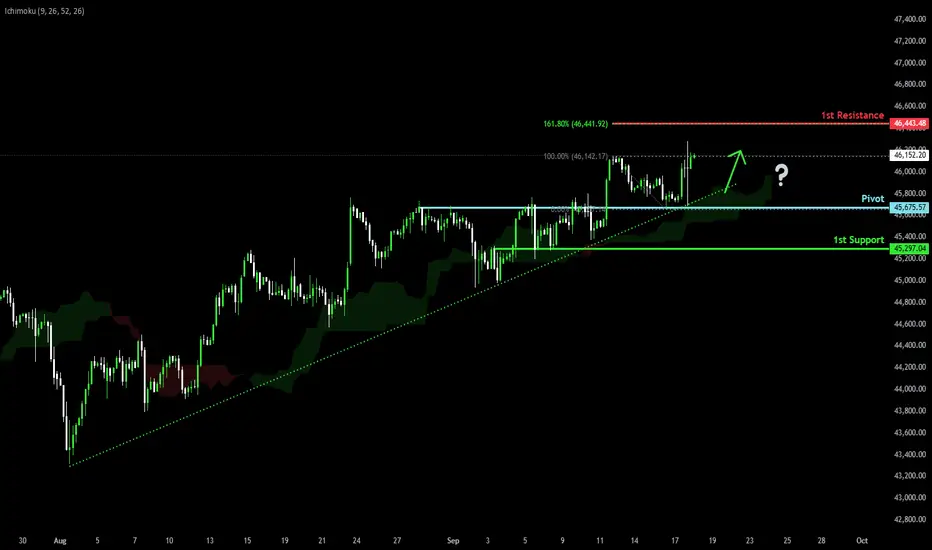
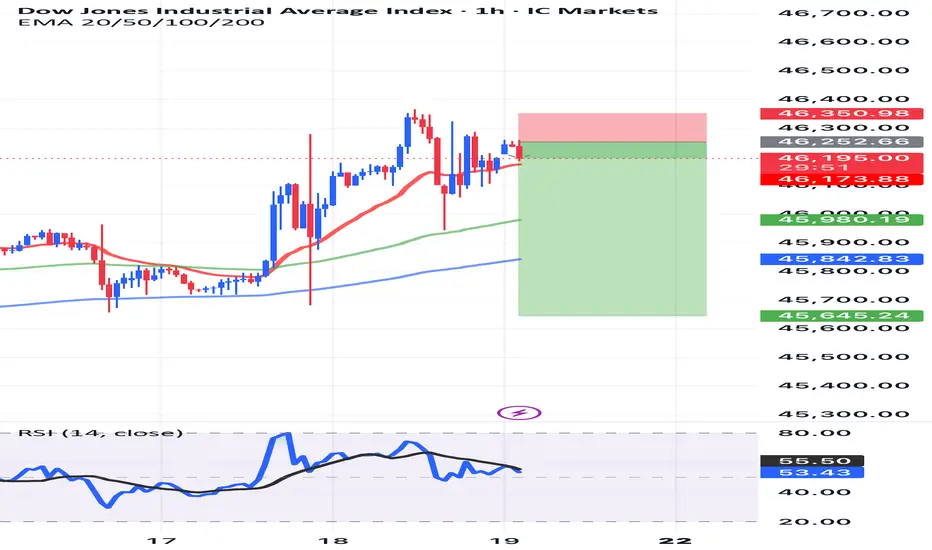
Bullish momentum to extend?Dow Jones (US30) has bounced off the pivot, which has been identified as a pullback support and could potentially rise to the 1st resistance which aligns with hte 161.8% Fibonacci extension.
Pivot: 45,675.57
1st Support: 45,297.04
1st Resistance: 46,443.48
Disclaimer:
The above opinions given constitute general market commentary, and do not constitute the opinion or advice of IC Markets or any form of personal or investment advice.
Any opinions, news, research, analyses, prices, other information, or links to third-party sites contained on this website are provided on an "as-is" basis, are intended only to be informative, is not an advice nor a recommendation, nor research, or a record of our trading prices, or an offer of, or solicitation for a transaction in any financial instrument and thus should not be treated as such. The information provided does not involve any specific investment objectives, financial situation and needs of any specific person who may receive it. Please be aware, that past performance is not a reliable indicator of future performance and/or results. Past Performance or Forward-looking scenarios based upon the reasonable beliefs of the third-party provider are not a guarantee of future performance. Actual results may differ materially from those anticipated in forward-looking or past performance statements. IC Markets makes no representation or warranty and assumes no liability as to the accuracy or completeness of the information provided, nor any loss arising from any investment based on a recommendation, forecast or any information supplied by any third-party.
US30Success in forex and stocks comes from a combination of knowledge, discipline, and patience. Understanding market trends, economic factors, and company
fundamentals is crucial, but equally important is controlling emotions and sticking to a well-planned strategy. Continuous learning, adapting to changing conditions, and managing risk wisely can turn opportunities into consistent growth over time.
Consistency, not luck, separates successful traders from the rest.

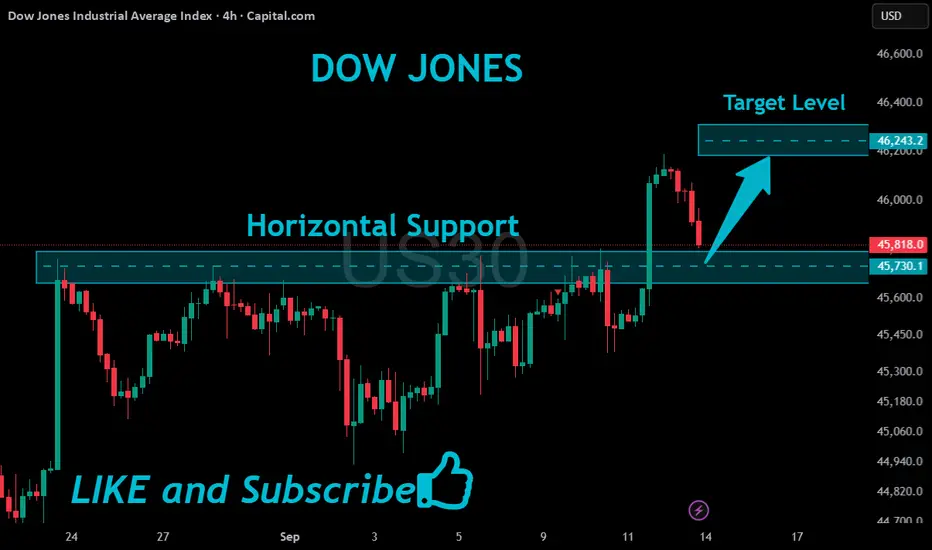
US30 In Support Below!
HI,Traders !
#US30 is trading in an
Uptrend and is
Now making a local bearish
Correction to retest the
Horizontal support below
Around 45730.1 from where
We will be expecting a
Further bullish move up !
Comment and subscribe to help us grow !
DOW JONES (US30): Your Plan to Trade FOMC Today
US30 keeps coiling on a recently broken daily key resistance
that turned into a support after a breakout.
To buy the market with confirmation after today's rate decision,
concentrate your attention on a double bottom pattern on a 4H time frame.
A bullish breakout of its neckline and a 4H candle close above 46850
will provide a reliable signal.
A bullish continuation will be expected to a current structure high then - 46087.
❤️Please, support my work with like, thank you!❤️
I am part of Trade Nation's Influencer program and receive a monthly fee for using their TradingView charts in my analysis.

DowJones Key trading levels ahead of Fed rate decisionKey Support and Resistance Levels
Resistance Level 1: 46210
Resistance Level 2: 46415
Resistance Level 3: 46640
Support Level 1: 45800
Support Level 2: 45610
Support Level 3: 45360
This communication is for informational purposes only and should not be viewed as any form of recommendation as to a particular course of action or as investment advice. It is not intended as an offer or solicitation for the purchase or sale of any financial instrument or as an official confirmation of any transaction. Opinions, estimates and assumptions expressed herein are made as of the date of this communication and are subject to change without notice. This communication has been prepared based upon information, including market prices, data and other information, believed to be reliable; however, Trade Nation does not warrant its completeness or accuracy. All market prices and market data contained in or attached to this communication are indicative and subject to change without notice.
US30 – Rejected at 46,145, Holding Above 45,700 SupportThe Dow Jones Index faced rejection near the 46,145 resistance and is now pulling back toward the 45,700 support zone. Price action here will determine whether buyers can sustain momentum or if sellers push lower.
Support at: 45,700 / 45,000 / 44,000 🔽
Resistance at: 46,145 🔼
🔎 Bias:
🔼 Bullish: Holding above 45,700 could lead to another retest of 46,145, with a breakout opening room for higher highs.
🔽 Bearish: A break below 45,700 would shift focus toward 45,000, and further weakness could target 44,000.
📛 Disclaimer: This is not financial advice. Trade at your own risk.

US30 Consolidates Ahead of Fed – Key Range 46,000 to 45,680US30 – Technical Overview
The Dow Jones continues to consolidate between 46,000 and 45,680 as traders await the Federal Reserve’s rate decision later this week.
Markets largely expect a 25 bps cut, but the key driver will be Chair Powell’s guidance on inflation, labor-market softness, and tariff risks—factors that could spark a breakout from the current range.
Technical Outlook
📉 Support test
Price remains inside a consolidation zone and is expected to retest 45,680 before attempting a rebound.
📈 Bullish continuation
A bounce from support could drive price back to 46,000, with a breakout above this level targeting 46,125.
A sustained move above 46,125 would open the path for a new ATH near 46,250 → 46,430, especially if the Fed signals a more dovish stance.
Key Levels
Pivot: 45,910
Resistance: 46,000 – 46,125 – 46,250
Support: 45,680 – 45,500
previous idea:

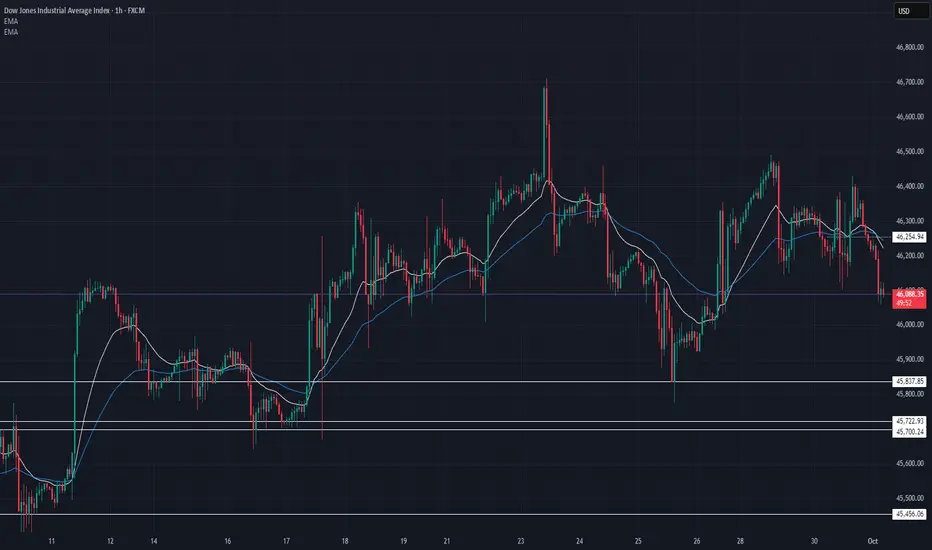
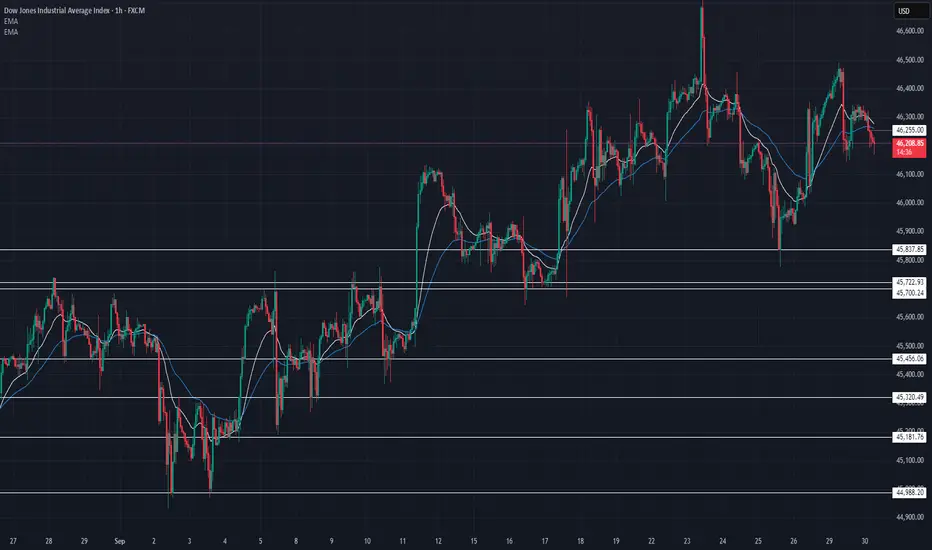
US30 Technical Breakdown – 10/01/2025📍 US30 Technical Breakdown – 10/01/2025
US30 slipped under 46,200, testing the 46,100 zone as support. EMAs rolling bearish → momentum shifting lower unless buyers defend.
📊 Market Behavior:
🔹 Lower highs forming after 46,500 rejection
🔹 46,100 acting as intraday demand
🔹 Below 45,837 → stronger sell-off risk
📌 Key Levels:
🔹 Resistance Zones:
46,250 → intraday barrier
46,400 → breakout ceiling
46,650 → bull target if regained
🔹 Support Zones:
46,100 → short-term demand
45,837 → key pivot
45,722 → deeper support
45,456 → bear target
🧠 Bias:
Leaning bearish ⚠️ unless price reclaims 46,250+
Bullish momentum only confirmed above 46,400 🚀
US30 Technical AnalysisPrice has been respecting the uptrend supported by the 50 SMA, with pullbacks finding buyers around the dynamic support zones. Recently, US30 rejected 46,400.0 resistance and is consolidating above 45,700.0 support, while the broader trend remains bullish.
Support at: 45,700.0 🔽 / 45,000.0 🔽
Resistance at: 46,400.0 🔼 / 47,115.8 🔼
🔎 Bias:
🔼 Bullish: A sustained hold above 46,000.0 and a breakout over 46,400.0 could extend the rally toward 47,115.8.
🔽 Bearish: A breakdown below 45,700.0 would expose 45,000.0 and weaken the uptrend momentum.
📛 Disclaimer: This is not financial advice. Trade at your own risk.


US30: Absolute Price Collapse Ahead! Short!
My dear friends,
Today we will analyse US30 together☺️
The recent price action suggests a shift in mid-term momentum. A break below the current local range around 46,224.50 will confirm the new direction downwards with the target being the next key level of 46,164.12 and a reconvened placement of a stop-loss beyond the range.
❤️Sending you lots of Love and Hugs❤️
US30 Technical Breakdown – 09/30/2025📍 US30 Technical Breakdown – 09/30/2025
US30 is consolidating after rejecting 46,450, holding above 46,100 support. EMAs are tightening → market waiting for direction.
📊 Market Behavior:
🔹 Sideways chop between 46,100 – 46,400
🔹 Sellers defending the upper zone
🔹 Buyers still holding structure above 45,800
📌 Key Levels:
🔹 Resistance Zones:
46,400 → rejection zone
46,650 → breakout trigger
🔹 Support Zones:
46,100 → short-term demand
45,837 → key pivot
45,722 → deeper support
45,181 → bear target if broken
🧠 Bias:
Neutral → breakout mode.
Bullish above 46,400 🚀 / Bearish below 46,100 ⚠️
possibility of uptrend The index is expected to consolidate above the support level and then start an upward trend.
Otherwise, a downward trend will form and the support level will be broken.

Volume profile indicator Volume Profile is an advanced charting tool that displays trading activity (volume) over a specified period at specified price levels
Volume Profile plots a histogram on the chart to show significant price levels based on volume (typically daily or weekly sessions)

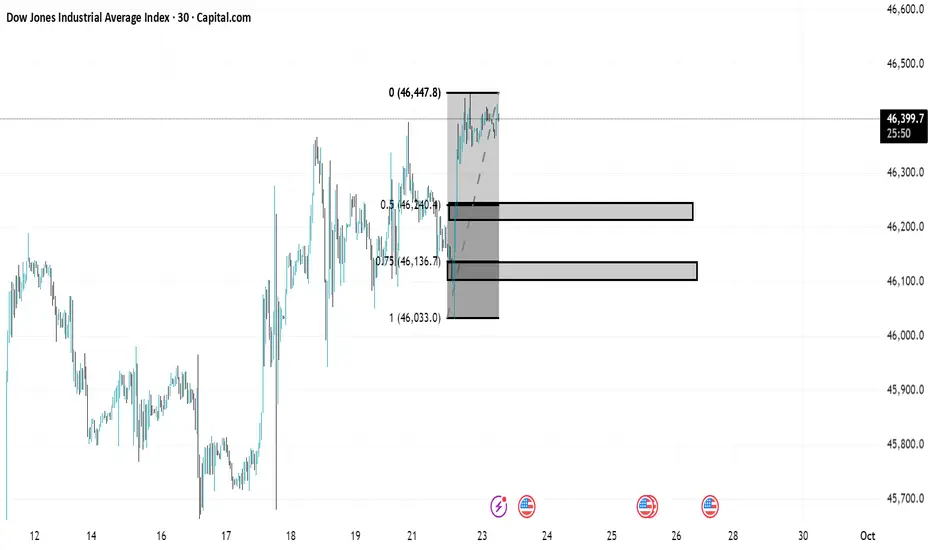
US30 TREND ANALYSISIn US30 there is a clear uptrend important areas are marked as always one is 50 percent area and the other one is 75 percent area .Once the market comeback for retest we will shift to smaller timeframe and look for trendshift after observing everything. When the market again comeback for the retest on smaller timeframe we will look for buy side trade.
important areas
50 percent zone(46245.3)
75 percent zone(46134.3)
bigger timeframe (30 minutes)
smaller timeframe(5 minutes)