INIT/USDT — The Big Battle at the Trendline!Is it time for a breakout and reversal, or just another false hope before the downtrend continues?
---
🔎 Overview
INIT/USDT is currently trading around 0.3626 USDT, after a prolonged downtrend since its peak in May. Price has formed a series of lower highs & lower lows, with the yellow descending
Related pairs

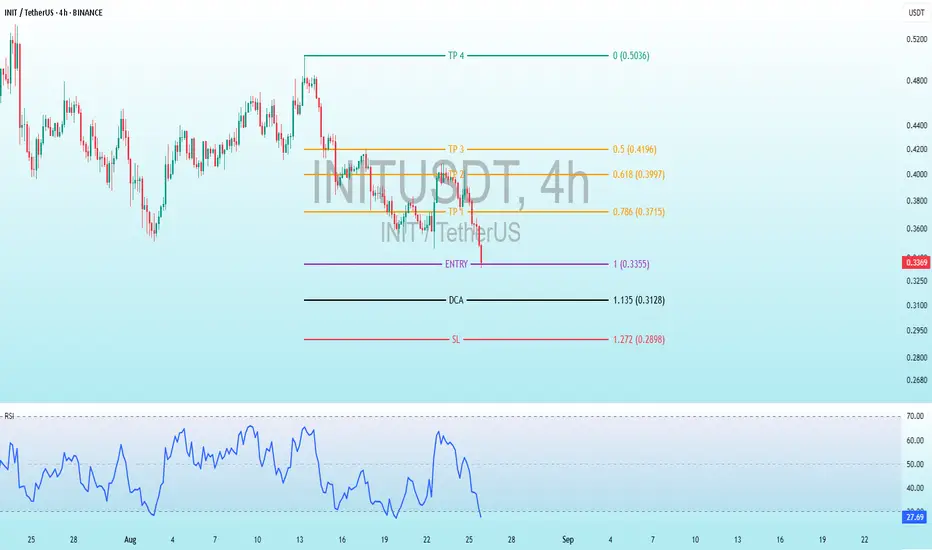
$INIT Epic Dip & Reversal Strategy Revealed!BINANCE:INITUSDT
Entry Level:
Marked at 1 0.3355 - 0.3370 USDT, indicating the intended entry point for a long position.
DCA (Dollar Cost Averaging): Set at 1.35 USDT, suggesting a level to add to the position if the price dips further.
Take Profit (TP) Levels:
TP1: 0.786 (0.3715) USDT
TP2: 0.6
It is a time for INITUSDT! 50% potential profit-0.65 USD targetThe chart displays the INT/USDT pair on a 4-hour timeframe from Binance, covering the period from June to August 2025. The Y-axis shows the price scale in USD, ranging from approximately 0.3000 to 0.8000, with the current price hovering around 0.447 USD. Candlesticks in turquoise (bullish) and red (

INITUSDT Forming Falling WedgeINITUSDT is showing signs of a classic Falling Wedge Pattern, a bullish chart formation that typically indicates a strong reversal or continuation to the upside. This pattern occurs when price action narrows within a descending range, creating lower highs and lower lows while momentum starts to fade
Initia · Higher Highs & Higher Lows, The Market GrowsI can see it moving. I can clearly see the end of a bearish move and trading conditions being 100% different to just a few months back.
I can see the difference between the down period and the sideways period. Initia is no longer going down, the bottom has become flat. I can see the change. Change

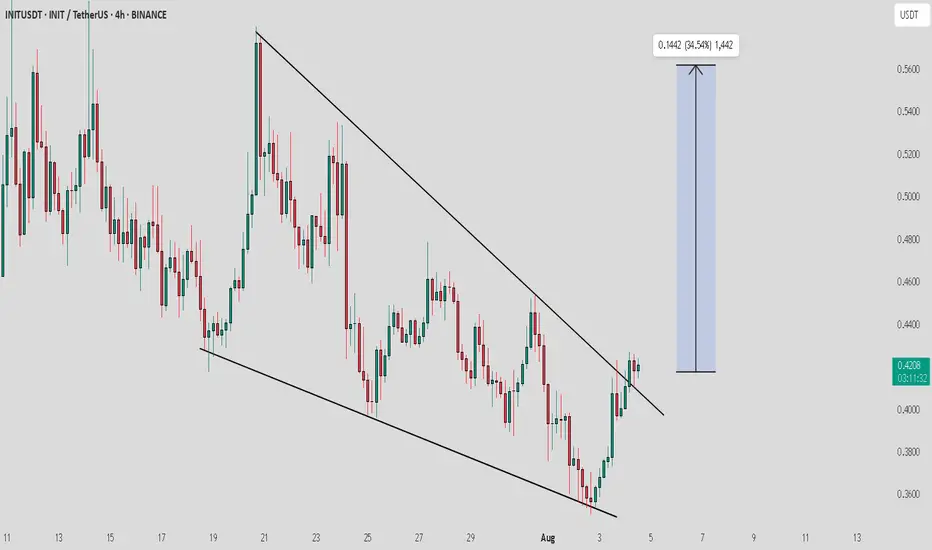
INIT / USDT : Momentum building..Keep a close watchINIT/USDT Breakout Alert
INIT/USDT is showing a strong breakout from a descending channel pattern, signaling a potential bullish move. This setup has great potential, and if the breakout continues, we could see significant upward momentum.
Target: Keep an eye on the next resistance levels, with a
INIT/USDT - Double bottom INIT has successfully double-bottomed around the $0.35 zone, confirming it as a strong demand area. The first leg off this support showed a powerful push from buyers, signaling renewed interest and a potential trend shift. Now, price action is heating up again as buyers step in aggressively with ris

INITUSDT at a Crossroads: Bounce or Break Break Down?📊 Comprehensive and Relevant Analysis
On the 12-hour timeframe, the INIT/USDT pair is currently retesting a crucial demand zone between $0.3500 – $0.3685. This zone previously acted as a strong support that triggered a sharp upward move in mid-July.
Now, price is sitting just above the lower edge

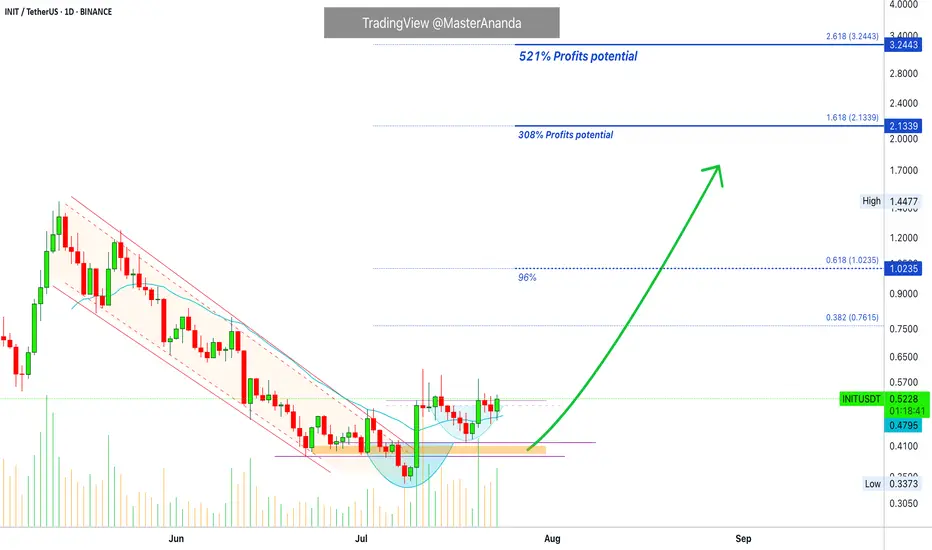
INITUSDT 1D#INIT is moving inside a falling wedge pattern on the daily chart. Consider buying at the current price and near the support level at $0.3992.
In case of a breakout above the pattern resistance, the upside targets are:
🎯 $0.5794
🎯 $0.7291
🎯 $0.8502
🎯 $0.9712
🎯 $1.1435
🎯 $1.3630
⚠️ As always, use

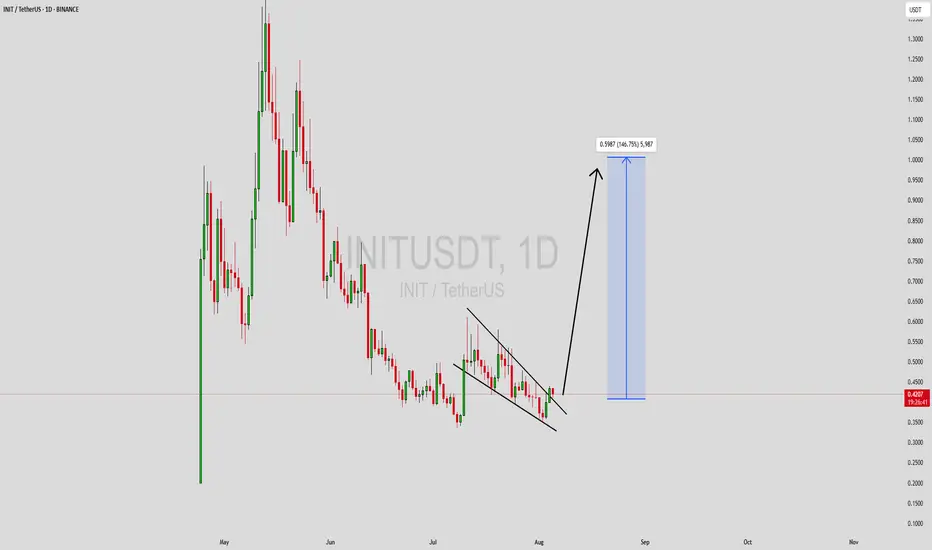
Initia Breaks Downtrend · 300% Profits Potential Chart SetupHere we have a nice chart setup and we are aiming for 144% short-term followed by 300%+ potential profits. Initia—INITUSDT—broke out of a downtrend 10-July with a full green candle and is already trading above EMA21. This is a solid, easy and simple chart setup.
Notice how the new projects continue
See all ideas
Summarizing what the indicators are suggesting.
Oscillators
Neutral
SellBuy
Strong sellStrong buy
Strong sellSellNeutralBuyStrong buy
Oscillators
Neutral
SellBuy
Strong sellStrong buy
Strong sellSellNeutralBuyStrong buy
Summary
Neutral
SellBuy
Strong sellStrong buy
Strong sellSellNeutralBuyStrong buy
Summary
Neutral
SellBuy
Strong sellStrong buy
Strong sellSellNeutralBuyStrong buy
Summary
Neutral
SellBuy
Strong sellStrong buy
Strong sellSellNeutralBuyStrong buy
Moving Averages
Neutral
SellBuy
Strong sellStrong buy
Strong sellSellNeutralBuyStrong buy
Moving Averages
Neutral
SellBuy
Strong sellStrong buy
Strong sellSellNeutralBuyStrong buy
Frequently Asked Questions
The current price of INIT3xShort/Tether (INIT) is 0.04852 USDT — it has risen 5.53% in the past 24 hours. Try placing this info into the context by checking out what coins are also gaining and losing at the moment and seeing INIT price chart.
INIT3xShort/Tether price has fallen by −2.78% over the last week, its month performance shows a −38.20% decrease, and as for the last year, INIT3xShort/Tether has decreased by −95.17%. See more dynamics on INIT price chart.
Keep track of coins' changes with our Crypto Coins Heatmap.
Keep track of coins' changes with our Crypto Coins Heatmap.
INIT3xShort/Tether (INIT) reached its highest price on May 7, 2025 — it amounted to 2.36371 USDT. Find more insights on the INIT price chart.
See the list of crypto gainers and choose what best fits your strategy.
See the list of crypto gainers and choose what best fits your strategy.
INIT3xShort/Tether (INIT) reached the lowest price of 0.02522 USDT on Aug 13, 2025. View more INIT3xShort/Tether dynamics on the price chart.
See the list of crypto losers to find unexpected opportunities.
See the list of crypto losers to find unexpected opportunities.
The safest choice when buying INIT is to go to a well-known crypto exchange. Some of the popular names are Binance, Coinbase, Kraken. But you'll have to find a reliable broker and create an account first. You can trade INIT right from TradingView charts — just choose a broker and connect to your account.
INIT3xShort/Tether (INIT) is just as reliable as any other crypto asset — this corner of the world market is highly volatile. Today, for instance, INIT3xShort/Tether is estimated as 25.88% volatile. The only thing it means is that you must prepare and examine all available information before making a decision. And if you're not sure about INIT3xShort/Tether, you can find more inspiration in our curated watchlists.
You can discuss INIT3xShort/Tether (INIT) with other users in our public chats, Minds or in the comments to Ideas.