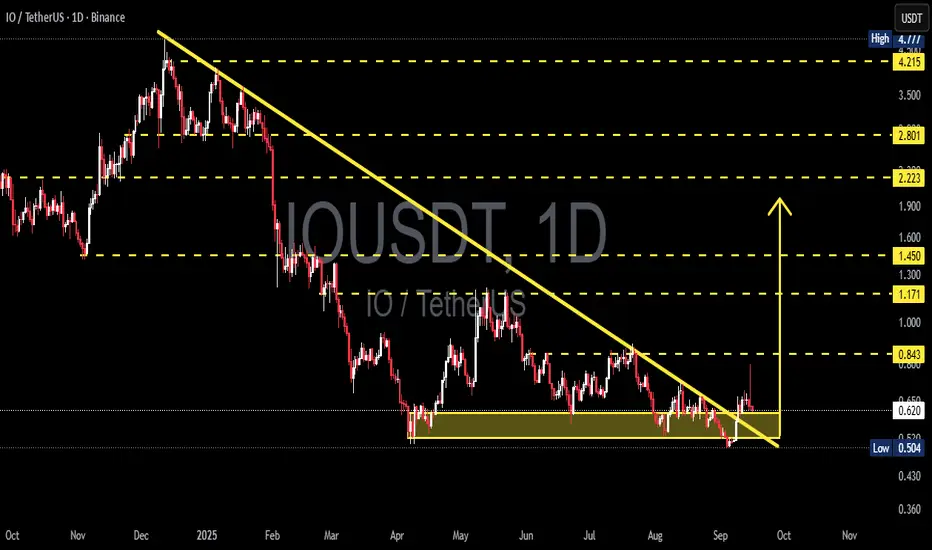
IO/USDT — Accumulation or Major Reversal Incoming?🔎 Current Situation
Timeframe: Daily (1D)
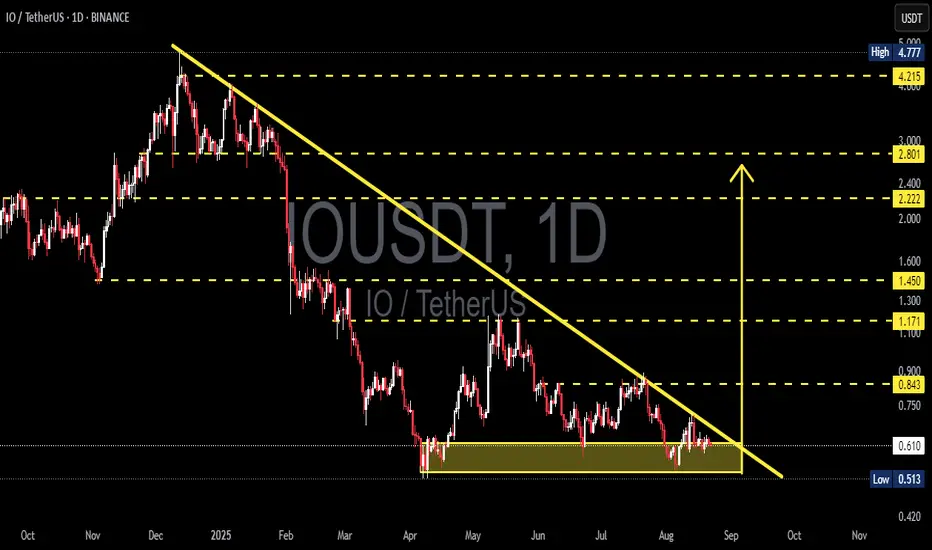
Main Trend: Prolonged downtrend since late 2024 (yellow trendline).
Key Zone: Price is consolidating inside the 0.50 – 0.62 accumulation box, which has acted as strong demand multiple times.
Breakout Attempt: Price briefly broke above the trendline and s
Related pairs
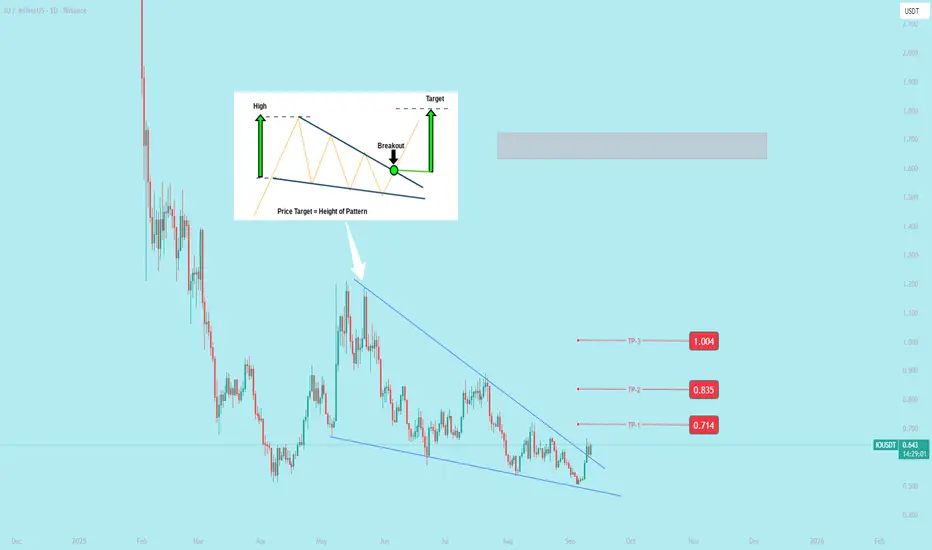
IOUSDT Forming Falling WedgeIOUSDT is displaying a classic falling wedge pattern, a bullish technical formation that often signals the end of a downtrend and the start of a strong upward move. The price action has been consolidating within narrowing ranges, showing reduced selling pressure and paving the way for a potential br
$IO Breakout falling wedge pattern The falling wedge is a bullish chart pattern in technical analysis that signals a potential price reversal to the upside.
IOUSDT Forming Falling WedgeIOUSDT is forming a classic falling wedge pattern, a bullish reversal signal that often precedes a strong upward breakout. After an extended period of consolidation within narrowing trendlines, the pair is now showing signs of strength with improving momentum. Historically, falling wedge breakouts l

iousdt done liquidity sweep and falling wedge patternthis counter looks good.
done liquidity sweep for 150 days
and potential falling wedge pattern.
watch closely for breakout or breakdown.
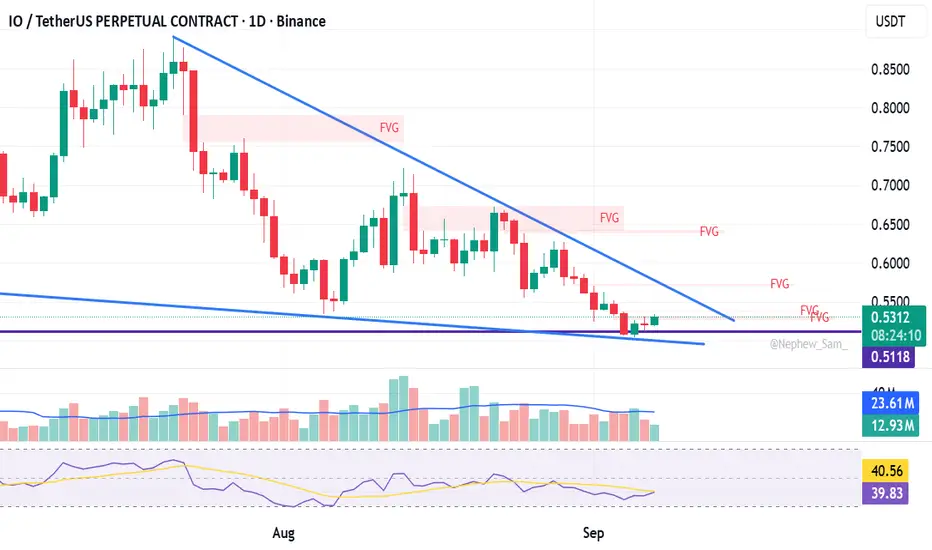
IOUSDT — Descending Triangle at Key Demand Zone!✨ Overview
The IOUSDT chart on the daily timeframe is showing a critical consolidation phase after a prolonged downtrend. Price is currently sitting inside the major demand zone 0.53–0.65, forming a descending triangle pattern — a classic setup that often leads to a decisive breakout move.
The fall
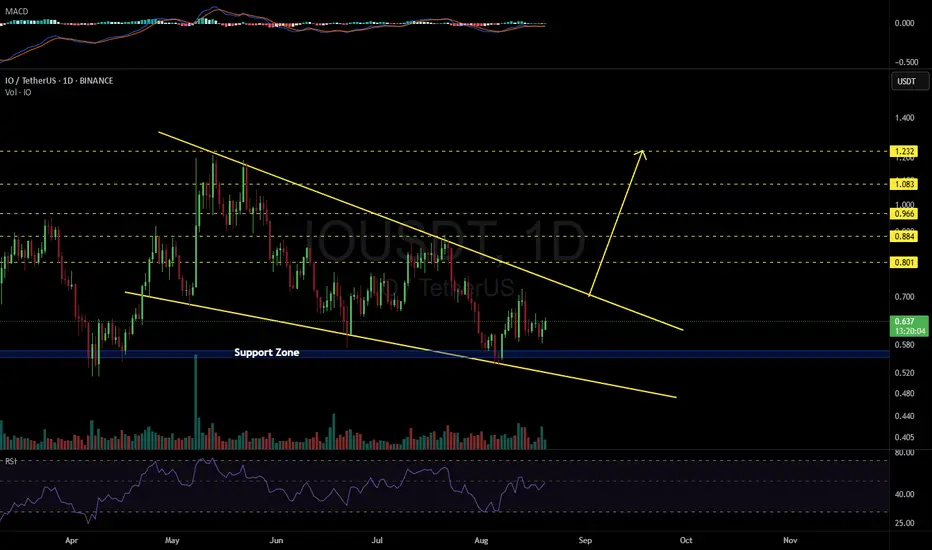
IOUSDT 1D#IO is moving inside a falling wedge pattern on the daily chart. Consider buying some #IO at the current price and near the support zone. In case of a breakout above the wedge resistance, the potential targets are:
🎯 $0.801
🎯 $0.884
🎯 $0.966
🎯 $1.083
🎯 $1.232
⚠️ As always, use a tight stop-loss an
IOUSDT Trade opportunityIOUSDT is trading within a robust descending channel, currently forming a potential bearish continuation pattern.
If the price breaks below the $1.482 level, it could lead to a new low. However, if this support holds, there could be a surprise reversal towards the key trendline shown on the chart.

IOUSDT Reversal SignalBINANCE:IOUSDT has broken out of a falling wedge on the 4H chart, signaling a potential trend reversal.
The price is trading above both the 50 EMA and 100 EMA, indicating growing bullish momentum.
A successful retest of the breakout zone could lead to a sharp move toward the $0.85–$1.10 level.
Res

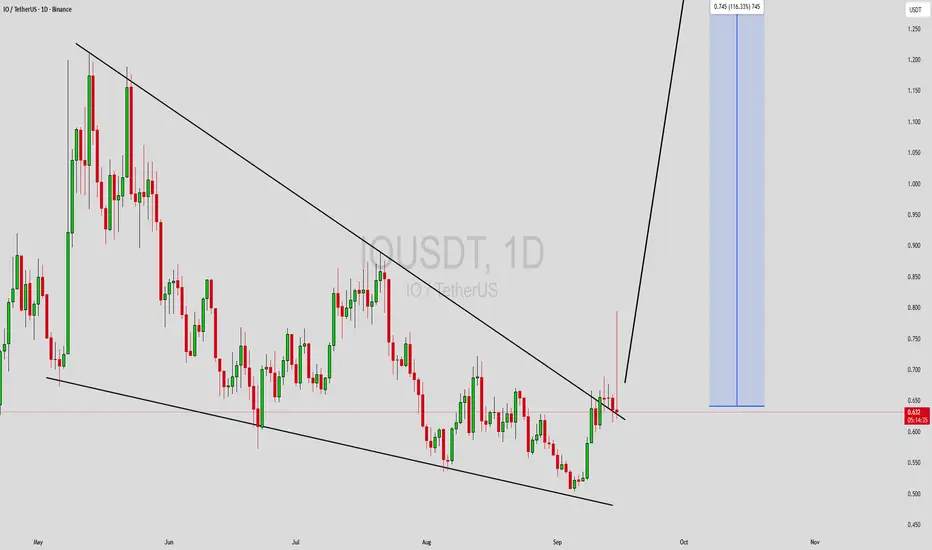
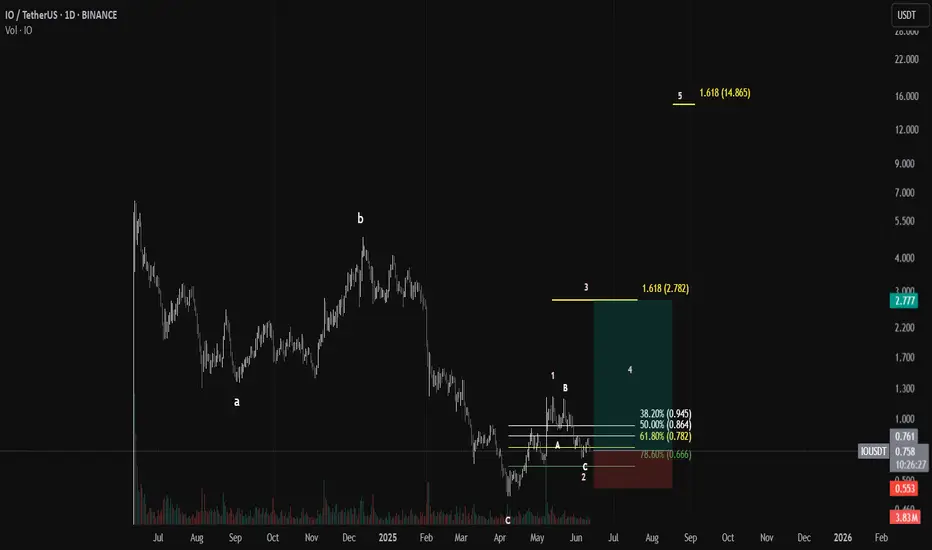
Io trade planIO/USDT Long Trade Setup | Daily Timeframe
📉 Structure: ABC Correction Completed
🚀 Elliott Wave Count: Wave 1 and 2 completed — potential Wave 3 breakout incoming
🔹 Entry Zone: 0.750 – 0.770 USDT
🔻 Stop-Loss: 0.666 USDT (below 78.6% Fib retracement)
🎯 Target 1 (Wave 3): 2.782 USDT (1.618 extension
See all ideas
Summarizing what the indicators are suggesting.
Oscillators
Neutral
SellBuy
Strong sellStrong buy
Strong sellSellNeutralBuyStrong buy
Oscillators
Neutral
SellBuy
Strong sellStrong buy
Strong sellSellNeutralBuyStrong buy
Summary
Neutral
SellBuy
Strong sellStrong buy
Strong sellSellNeutralBuyStrong buy
Summary
Neutral
SellBuy
Strong sellStrong buy
Strong sellSellNeutralBuyStrong buy
Summary
Neutral
SellBuy
Strong sellStrong buy
Strong sellSellNeutralBuyStrong buy
Moving Averages
Neutral
SellBuy
Strong sellStrong buy
Strong sellSellNeutralBuyStrong buy
Moving Averages
Neutral
SellBuy
Strong sellStrong buy
Strong sellSellNeutralBuyStrong buy
Displays a symbol's price movements over previous years to identify recurring trends.
Frequently Asked Questions
The current price of io.net / Tether SPOT (IO) is 0.536 USDT — it has risen 0.93% in the past 24 hours. Try placing this info into the context by checking out what coins are also gaining and losing at the moment and seeing IO price chart.
io.net / Tether SPOT price has fallen by −11.27% over the last week, its month performance shows a −8.59% decrease, and as for the last year, io.net / Tether SPOT has decreased by −76.37%. See more dynamics on IO price chart.
Keep track of coins' changes with our Crypto Coins Heatmap.
Keep track of coins' changes with our Crypto Coins Heatmap.
io.net / Tether SPOT (IO) reached its highest price on Jun 12, 2024 — it amounted to 6.500 USDT. Find more insights on the IO price chart.
See the list of crypto gainers and choose what best fits your strategy.
See the list of crypto gainers and choose what best fits your strategy.
io.net / Tether SPOT (IO) reached the lowest price of 0.505 USDT on Sep 5, 2025. View more io.net / Tether SPOT dynamics on the price chart.
See the list of crypto losers to find unexpected opportunities.
See the list of crypto losers to find unexpected opportunities.
The safest choice when buying IO is to go to a well-known crypto exchange. Some of the popular names are Binance, Coinbase, Kraken. But you'll have to find a reliable broker and create an account first. You can trade IO right from TradingView charts — just choose a broker and connect to your account.
Crypto markets are famous for their volatility, so one should study all the available stats before adding crypto assets to their portfolio. Very often it's technical analysis that comes in handy. We prepared technical ratings for io.net / Tether SPOT (IO): today its technical analysis shows the sell signal, and according to the 1 week rating IO shows the sell signal. And you'd better dig deeper and study 1 month rating too — it's sell. Find inspiration in io.net / Tether SPOT trading ideas and keep track of what's moving crypto markets with our crypto news feed.
io.net / Tether SPOT (IO) is just as reliable as any other crypto asset — this corner of the world market is highly volatile. Today, for instance, io.net / Tether SPOT is estimated as 3.61% volatile. The only thing it means is that you must prepare and examine all available information before making a decision. And if you're not sure about io.net / Tether SPOT, you can find more inspiration in our curated watchlists.
You can discuss io.net / Tether SPOT (IO) with other users in our public chats, Minds or in the comments to Ideas.