AUDJPY potential shorts due weaker than expected China eco data.Industrial output grew by 5.7% year-on-year in July, down from 6.8% in June, marking the slowest growth since November 2024. This fell short of the 5.9% forecast by analysts in a Reuters poll and 5.82% by Wind.
Retail sales, a key gauge of consumption, rose by 3.7% year-on-year in July, down from 4.8% in June and below the expected 4.6% (Reuters) and 4.87% (Wind). This was the slowest growth since December 2024.
The reason for this trade idea is that Australia ranks as China’s seventh-largest trading partner overall, based on data from the Australian Department of Foreign Affairs and Trade and Chinese trade reports. Australia is China’s fifth-largest source of imports (primarily commodities like iron ore, coal, and natural gas) and tenth-largest export destination. Any news emerging from China has the potential to impact the Australian dollar.
JPYAUD trade ideas

AUDJPY to continue bearishbuyer shows weaken in higher timeframe (>H4)
I'm waiting at marked area to enter short.
calculate your own risk & reward
Good Luck

AUDJPY SellVery clean chart, and I'm seeing some signs of weakness. Overall a pullback would be nice for some more shorts

LIVE TRADE: AUD JPY long 95.77The USD has gained strength on today's 'hot PPI' data. The data re-opens the possibility of a slower pace of FED cuts. Which is contrary to the recent narrative.
For now, the prospect of slower cuts hasn't dented the overall positive 'risk tone', the VIX remains below 15.
Having viewed recent JPY strength as 'profit taking' and unsure what today's data will do for the trajectory of the USD. And with the JPY weakening against everything, I've chosen to enter a 'risk on' trade.
I've chosen the AUD to long due to AUD USD currently sitting at 4HR support. And I like the fact the AUD JPY chart has room up to resistance.
It's a 25 pip stop loss, with 38 pip profit target.
The risk to the trade is if the USD weakness again, particularly Vs JPY. Or 'general negative market sentiment' if the market starts to deem higher inflation as a concern.
Please feel free to offer thoughts or questions:

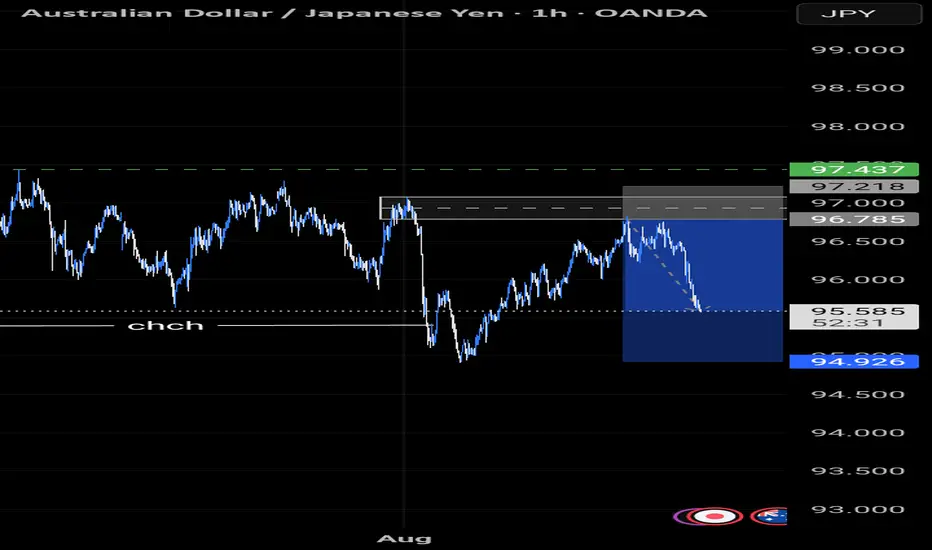
AUDJPY TRADE IDEA UPDATE We had a pullback to our Fibonacci level and our OB was tapped into...
We then are having a movement to the downside
AUD/JPY BEST PLACE TO BUY FROM|LONG
Hello, Friends!
AUD/JPY pair is in the downtrend because previous week’s candle is red, while the price is evidently falling on the 5H timeframe. And after the retest of the support line below I believe we will see a move up towards the target above at 96.660 because the pair oversold due to its proximity to the lower BB band and a bullish correction is likely.
Disclosure: I am part of Trade Nation's Influencer program and receive a monthly fee for using their TradingView charts in my analysis.
✅LIKE AND COMMENT MY IDEAS✅

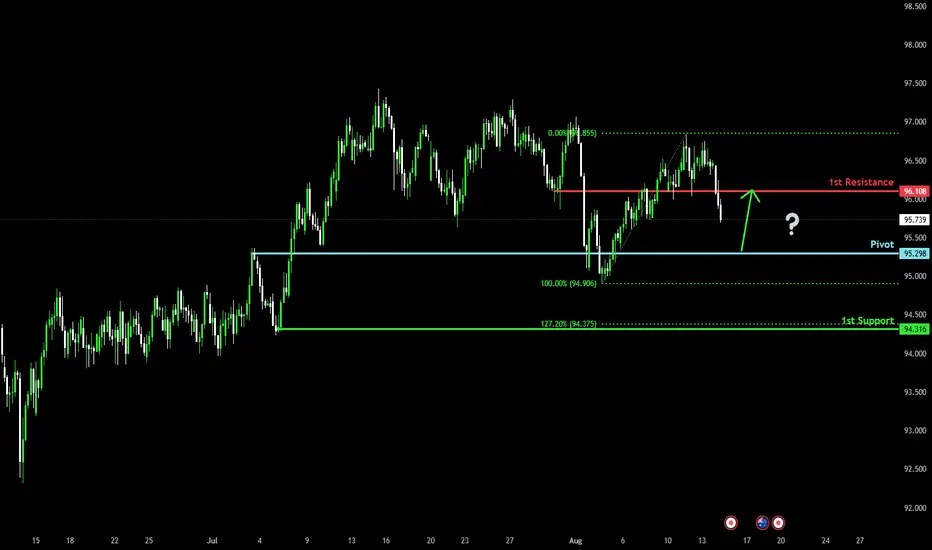
Bullish reversal?AUD/JPY is falling towards the pivot which has been identified as an overlap support and could bounce to the 1st resistance.
Pivot: 95.29
1st Support: 94.31
1st Resistance: 96.10
Risk Warning:
Trading Forex and CFDs carries a high level of risk to your capital and you should only trade with money you can afford to lose. Trading Forex and CFDs may not be suitable for all investors, so please ensure that you fully understand the risks involved and seek independent advice if necessary.
Disclaimer:
The above opinions given constitute general market commentary, and do not constitute the opinion or advice of IC Markets or any form of personal or investment advice.
Any opinions, news, research, analyses, prices, other information, or links to third-party sites contained on this website are provided on an "as-is" basis, are intended only to be informative, is not an advice nor a recommendation, nor research, or a record of our trading prices, or an offer of, or solicitation for a transaction in any financial instrument and thus should not be treated as such. The information provided does not involve any specific investment objectives, financial situation and needs of any specific person who may receive it. Please be aware, that past performance is not a reliable indicator of future performance and/or results. Past Performance or Forward-looking scenarios based upon the reasonable beliefs of the third-party provider are not a guarantee of future performance. Actual results may differ materially from those anticipated in forward-looking or past performance statements. IC Markets makes no representation or warranty and assumes no liability as to the accuracy or completeness of the information provided, nor any loss arising from any investment based on a recommendation, forecast or any information supplied by any third-party.
AUDJPY – DAILY FORECAST Q3 | W33 | D14 | Y25📊 AUDJPY – DAILY FORECAST
Q3 | W33 | D14 | Y25
Daily Forecast 🔍📅
Here’s a short diagnosis of the current chart setup 🧠📈
Higher time frame order blocks have been identified — these are our patient points of interest 🎯🧭.
It’s crucial to wait for a confirmed break of structure 🧱✅ before forming a directional bias.
This keeps us disciplined and aligned with what price action is truly telling us.
📈 Risk Management Protocols
🔑 Core principles:
Max 1% risk per trade
Only execute at pre-identified levels
Use alerts, not emotion
Stick to your RR plan — minimum 1:2
🧠 You’re not paid for how many trades you take, you’re paid for how well you manage risk.
🧠 Weekly FRGNT Insight
"Trade what the market gives, not what your ego wants."
Stay mechanical. Stay focused. Let the probabilities work.
FX:AUDJPY


AUDJPY Trade Idea – Risking 1% for Potential 5% Gain 13/8/2025I trade with a fixed 1:5 risk–reward ratio, focusing on setups that offer asymmetric profit potential. My approach emphasizes precise entries, strict risk management, and the patience to let trades reach their full potential.
This method allows me to risk small while aiming for meaningful gains, keeping my results consistent and sustainable over time. Trading, for me, is as much about mindset as it is about method — staying calm, following the plan, and letting probabilities work in my favor.
Disclaimer: This is purely an idea shared for educational purposes. I take no responsibility for any financial decisions you make. Please assess it carefully and adapt it to your own trading plan before acting.

AUD/JPY Rebound Stalls Ahead of Monthly HighThe recent rebound in AUD/JPY seems to be stalling ahead of the monthly high (97.07) as it no longer carves a series of higher highs and lows, and failure to hold above the weekly low (96.00) may push the exchange rate toward the monthly low (94.91).
A close below the 95.10 (38.2% Fibonacci extension) to 95.20 (23.6% Fibonacci extension) region brings the July low (93.97) on the radar, with the next area of interest coming in around 92.80 (50% Fibonacci extension) to 93.30 (23.6% Fibonacci extension).
However, a breach of the monthly high (97.07) may lead to a test of the July high (97.43), with the next area of interest coming in around 97.90 (23.6% Fibonacci extension) to 98.30 (38.2% Fibonacci retracement).
--- Written by David Song, Senior Strategist at FOREX.com

AUD/JPY at Decision Point – Bulls or Bears to Take Control?1. COT Analysis
JPY: Net shorts among Non-Commercials increased (+5.3K shorts, -1.8K longs), indicating growing bearish pressure on the yen. Commercials, however, heavily accumulated longs (+13.5K), suggesting that large players may be hedging or positioning for a potential yen rebound.
AUD: Still heavily net short, with Non-Commercials reducing longs (-2.5K) and slightly increasing shorts (+2.9K). This reflects a continued speculative bearish sentiment on the Australian dollar.
→ COT Implication: The divergence between a heavily shorted JPY and an AUD already under bearish pressure can lead to increased volatility. Without supportive macro drivers for the AUD, the pair may struggle to sustain upward moves.
2. Seasonality
JPY: Historically weak in August (20-year average: -0.61%), with sharper declines in the last 5 and 2 years. This tends to favor AUD/JPY upside in the first part of the month.
AUD: Slightly positive in the past 2 years (+0.01%), but negative over longer periods.
→ Short-term seasonality is moderately supportive of upside, but historical patterns don’t back a strong directional trend.
3. Sentiment
Retail positioning: 63% short vs 37% long. Historically, retail traders often find themselves on the wrong side of major moves, making this setup moderately bullish for AUD/JPY in the short term.
4. Technical Analysis
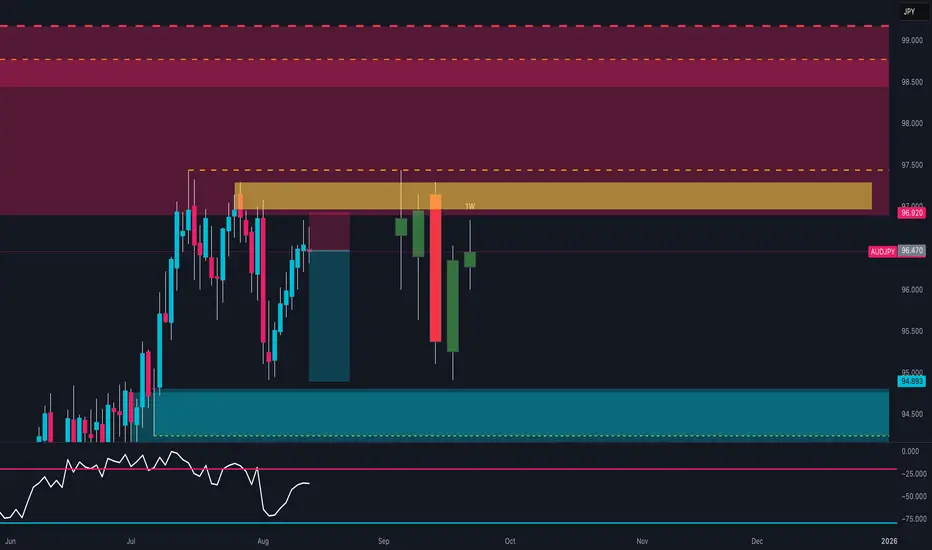
Weekly Supply Zone: 96.88–98.77. Price is currently below this area after a strong rejection in recent weeks.
Weekly Demand Zone: 94.90–95.00, previously tested with a bullish reaction.
RSI: Neutral zone, no overbought/oversold signals, but slightly tilted downward on the weekly timeframe.
Price Action: Current candle shows a recovery attempt after a bearish rejection, but unless the weekly closes above 96.92, the risk of another drop toward 95 remains high.
5. Trading Bias
Bullish Scenario: Weekly break & close above 96.92 with volume → Target 97.80 / 98.50.
Bearish Scenario: Weekly rejection below 96.90 and daily break of 95.80 → Target 95.00 / 94.50.
Macro Context: In risk-on environments, AUD tends to outperform JPY; in risk-off, the yen rebounds quickly.
📌 Summary:
Short-term neutral-to-bullish bias driven by contrarian retail sentiment and moderately bullish seasonality, but 96.92 remains a critical resistance that must be broken to unlock more upside. Failure here could send the pair back to 95.00, with risk of breakdown if macro sentiment worsens.

AUD/JPY Approaches Monthly HighAUD/JPY climbs to a fresh weekly high (96.84) as it carves a series of higher highs and lows, and a breach above the monthly high (97.07) may lead to a test of the July high (97.43).
Need a move/close above the 97.90 (23.6% Fibonacci extension) to 98.30 (38.2% Fibonacci retracement) zone to bring the January high (99.17) on the radar, with the next area of interest coming in around 100.90 (38.2% Fibonacci extension).
However, AUD/JPY may give back the rebound from the monthly low (94.91) should it snap the bullish price series, with a close below the 95.10 (38.2% Fibonacci extension) to 95.20 (23.6% Fibonacci extension) region bringing the July low (93.97) on the radar.
--- Written by David Song, Senior Strategist at FOREX.com

Bearish reversal off swing high resistance?AUD/JPY is rising towards the pivot, which acts as a swing high resistance and could potentially drop to the 50% Fibonacci support.
Pivot: 96.93
1st Support: 95.80
1st Resistance: 97.42
Risk Warning:
Trading Forex and CFDs carries a high level of risk to your capital and you should only trade with money you can afford to lose. Trading Forex and CFDs may not be suitable for all investors, so please ensure that you fully understand the risks involved and seek independent advice if necessary.
Disclaimer:
The above opinions given constitute general market commentary, and do not constitute the opinion or advice of IC Markets or any form of personal or investment advice.
Any opinions, news, research, analyses, prices, other information, or links to third-party sites contained on this website are provided on an "as-is" basis, are intended only to be informative, is not an advice nor a recommendation, nor research, or a record of our trading prices, or an offer of, or solicitation for a transaction in any financial instrument and thus should not be treated as such. The information provided does not involve any specific investment objectives, financial situation and needs of any specific person who may receive it. Please be aware, that past performance is not a reliable indicator of future performance and/or results. Past Performance or Forward-looking scenarios based upon the reasonable beliefs of the third-party provider are not a guarantee of future performance. Actual results may differ materially from those anticipated in forward-looking or past performance statements. IC Markets makes no representation or warranty and assumes no liability as to the accuracy or completeness of the information provided, nor any loss arising from any investment based on a recommendation, forecast or any information supplied by any third-party.

AUDJPY Strategy That Outsmarts the Noise: Entry & Target Ready!Hey friends 👋
I’ve prepared an analysis for the AUDJPY pair. If the price reaches the 96.201 - 96.169 zone, I’ll be looking to open a buy position from that level.
My target will be set at 96.524.
Every single like you send is a huge source of motivation for me to keep sharing these analyses. Big thanks to everyone who supports with a like 🙏

Bullish bounce off pullback support?AUD/JPY has bounced off the support level which is a pullback support and could bounce from this level to our take profit.
Entry: 96.14
Why we like it:
There is a pullback support.
Stop loss: 95.04
Why we like it:
There is a swing low support.
Take profit: 97.22
Why we like it:
There is a multi swing high resistance.
Enjoying your TradingView experience? Review us!
Please be advised that the information presented on TradingView is provided to Vantage (‘Vantage Global Limited’, ‘we’) by a third-party provider (‘Everest Fortune Group’). Please be reminded that you are solely responsible for the trading decisions on your account. There is a very high degree of risk involved in trading. Any information and/or content is intended entirely for research, educational and informational purposes only and does not constitute investment or consultation advice or investment strategy. The information is not tailored to the investment needs of any specific person and therefore does not involve a consideration of any of the investment objectives, financial situation or needs of any viewer that may receive it. Kindly also note that past performance is not a reliable indicator of future results. Actual results may differ materially from those anticipated in forward-looking or past performance statements. We assume no liability as to the accuracy or completeness of any of the information and/or content provided herein and the Company cannot be held responsible for any omission, mistake nor for any loss or damage including without limitation to any loss of profit which may arise from reliance on any information supplied by Everest Fortune Group.

AUDJPYBased on the provided 4-hour chart of AUD/JPY, here is a brief summary and outlook.
The AUD/JPY pair has recently been trading within a descending channel, as shown by the parallel trend lines. The price has just made a rally to the upper boundary of this channel, retesting a significant resistance zone. This resistance also coincides with a Fair Value Gap (FVG) area, which often acts as a point of price rejection. The Stochastic Momentum Index (SMI) in the lower panel is also showing an overbought condition, which further supports the potential for a reversal.
The chart illustrates a likely bearish scenario where the price is rejected at the current resistance level. The orange arrow depicts a potential movement where the price could fall back towards the support zone around 95.70. This support level has been significant in the past, acting as both resistance and support. A successful move to this level would be a continuation of the descending trend within the channel.
The expectation is for a bearish reversal from the current levels. Traders should look for confirmation of the rejection at the FVG and the channel's upper boundary. A successful break above the resistance at 96.73 would invalidate this bearish outlook. The key support level to watch for potential profit-taking is at 95.70.

AUD/JPY Breakout Loading – Bullish Flag Signals Next Big Move!Pair: AUD/JPY – TF: 1H
Trend: Bullish
Divergence: NIL
Pattern: Bullish Flag
Harmonics: NIL
BIAS: Bullish
Strategy: Buy STOP Entry at Breakout of HH
Entry: Buy Stop @ 96.56
Stop Loss (SL): 95.95
Take Profit (TP1): 97.17
Lot Size: 0.23
Risk:Reward: 1:1
Risk: $100 | Reward: $100
🔹 Technical Outlook:
The bullish flag pattern is forming after a strong upward impulse.
Alligator indicator shows a wide-open mouth—indicating strong momentum.
Higher timeframe (4H) also confirms bullish bias.
Breakout of the recent Higher High (HH) expected to trigger further upside.
🔹 Fundamental Snapshot:
Australia’s retail sales rose 1.2% in June, beating forecasts, signaling consumer demand strength and adding support to the AUD.
Bank of Japan maintained its interest rate at 0.40%–0.50%, keeping monetary policy loose.
Rising Japanese Government Bond (JGB) yields to 1.6% (highest since 2008) may offer some Yen support, but technicals still favor AUD/JPY upside in the short term.
💬 Plan: Execute Buy Stop above HH for continuation of bullish move, aligned with both technical patterns and supportive macro backdrop.
📌 Note: Always manage your risk according to your capital and strategy.
#AUDJPY #Forex #PriceAction #TechnicalAnalysis #BullishFlag #AlligatorIndicator #BreakoutTrading #SwingTrading #DayTrading #FXMarket #JPY #AUD #TraderLife #ForexSignals #TradeSetup #ChartAnalysis #H1Timeframe #TradingView

AUD/JPY SENDS CLEAR BEARISH SIGNALS|SHORT
Hello, Friends!
AUD/JPY pair is in the uptrend because previous week’s candle is green, while the price is clearly rising on the 4H timeframe. And after the retest of the resistance line above I believe we will see a move down towards the target below at 96.380 because the pair overbought due to its proximity to the upper BB band and a bearish correction is likely.
Disclosure: I am part of Trade Nation's Influencer program and receive a monthly fee for using their TradingView charts in my analysis.
✅LIKE AND COMMENT MY IDEAS✅

AUD/JPY LONG FROM SUPPORT
Hello, Friends!
The BB lower band is nearby so AUD-JPY is in the oversold territory. Thus, despite the downtrend on the 1W timeframe I think that we will see a bullish reaction from the support line below and a move up towards the target at around 96.130.
Disclosure: I am part of Trade Nation's Influencer program and receive a monthly fee for using their TradingView charts in my analysis.
✅LIKE AND COMMENT MY IDEAS✅


AUDJPY 4Hour TF - August 10th,2025🟦 AUDJPY 4H Analysis
📅 August 10, 2025
Top-Down Trend Bias:
• Monthly – Bullish
• Weekly – Bullish
• Daily – Bullish
• 4H – Bearish
AUDJPY pushed above 96.15 resistance zone after a short term bullish correction. Higher timeframes remain bullish, but the 4H could still show signs of further bearish movement.
🔍 Key Zone: 96.15
This zone has acted as support and resistance in the past and will be the deciding area for the next directional move.
✅ Scenario A: Bullish Breakout (Blue Path)
1.If price holds above 96.150 area
2.Look for continuation into 97.20 support
This would align with the higher timeframe bullish bias
⚠️ Scenario B: Bearish Rejection (Orange Path)
1.If price breaks and holds below 96.150
2.Watch for bearish confirmation (engulfing, LTF BOS, rejection wicks)
Target: 94.50 support zone
This would maintain the current 4H bearish structure despite the bullish HTF backdrop.
🧠 Final Notes
• 96.15 is the short term decision point for both buyers and sellers
• HTFs favor longs, but sellers may control the 4H
• Confirmation at the zone is key before taking either direction
