AUDJPY Analysis Price has broken below the 97.60 support and is now retesting it as new resistance. As long as this level holds, I’ll be looking for bearish continuation setups targeting the 96.80 zone, with potential extension towards 96.40 if momentum increases.
JPYAUD trade ideas

AUDJPY SELL PROJECTION CHART AUDJPY on the daily TF is in a strong resistance zone , so that's why you see it in a downtrend, that's why we keep saying rejection to the downside... once price gets to that POI we expect a sell downwards

Lingrid | AUDJPY Momentum Slowdown Bull SignalFX:AUDJPY is consolidating inside a downward channel after repeated rejections at the 98.3 resistance zone. The chart shows a compression channel within the broader bearish trendline, with liquidity resting below the 97.1 area. A rebound from the current liquidity pocket could fuel a short-term move toward 97.7 before facing resistance again. Broader structure remains bullish unless price can sustain below the downward trendline.
⚠️ Risks:
A clean break below 97.1 may drag price toward the deeper 96.7 support area.
Stronger JPY from risk-off flows could accelerate downside pressure.
Unexpected shifts in Australian economic data could disrupt the technical setup.
If this idea resonates with you or you have your own opinion, traders, hit the comments. I’m excited to read your thoughts!

AUDJPY: Long Trade Explained
AUDJPY
- Classic bullish formation
- Our team expects pullback
SUGGESTED TRADE:
Swing Trade
Long AUDJPY
Entry - 97.434
Sl - 97.350
Tp - 97.587
Our Risk - 1%
Start protection of your profits from lower levels
Disclosure: I am part of Trade Nation's Influencer program and receive a monthly fee for using their TradingView charts in my analysis.
❤️ Please, support our work with like & comment! ❤️

audjpy buyhello traders
this is my view for this pair
what do you think
share your point of view with me

Bearish on AUD/JPYI am bearish on AUD/JPY due to expectations on rate differentials... RBA is easing amidst controlled inflation while BOJ promises tightening amidst rising inflation in Japan. Risks to this trade thesis abound... Risk sentiment changes affecting AUD, global growth surprises affecting sage-haven lows and politics in Japan in unpredictable times.
My target is 96.80-96.70 by October 15 and 96.00 by end of October if there arent any significant fundamental changes to this trade

Forex Weekly Review: Fundamental analysis.The week starting Monday 15 September was a week of two halves for the USD.
Sentiment for the dollar has been growing more and more subdued in anticipation of a faster pace of rate cuts. And USD selling continued during Monday and Tuesday, in anticipation of a 'dovish' FOMC outcome.
Perhaps the market was a little over zealous though, although the FOMC did indeed provide a rate cut, combined with a much more dovish rhetoric than a few months ago. Mr POWELL'S balanced approach disappointed USD bears. The USD and US YIELDS rose for the remainder of the week.
Ultimately, the concenciuos appears to be that it was a final hurrah bout of USD strength, before weakening into year end. I would tend to agree with that narrative, but I'll let the USD itself and US YIELDS suggest whether the dollar is longable or shortable this coming week. It'll be interesting to see if the US 10 YEAR can get back above 4.2.
All things considered, the market liked Mr POWELL'S narrative suggesting the US economy is in good shape, (for now) the softening labour market is not too much of a concern and the 'soft landing' native remains as the S&P continues to push all time highs. Which means the JPY 'should' be shortable. I say 'should' because the BOJ held its own rate meeting this week. The interest rate 'hold' was initially seen as hawkish. But a toning down of rate hike expectations during the press conference saw JPY gains reverse. And (for now) I continue to view the JPY as a short possibility.
The other currency usually associated as a short in a risk on environment (the CHF) continues to be stubbornly strong. Possibly hanging on to the coat tail of the EUR, but it does appear the CHF has it's own underlying fundamental strength. And my mind keeps wandering back to the article I read a few months ago about the SNB benefiting from relativity high holdings of gold. It does make sense as the price of gold continues to skyrocket.
There were two other rate decisions of note this week . A BOC cut and a BOE hold. Both with very limited forward guidance, which leads me to assume my status quo thoughts of more cuts sooner from the BOC and more cuts but at a slower pace from the BOE. Although the CAD did have a surprise boost from 'tariff talk' on Friday. And UK fiscal concerns continue to keep any GBP positivity on a knife edge.
On a personal note, it was a week of three trades. Unusually, two in one day when I tried to the advance of negative CAD sentiment and positive UK data on Tuesday, with two GBP CAD long trades. One stopped out and one hit profit.
I then placed a JPY short, post BOJ press conference, when I felt the initial JPY strength would reverse. The trade was eventually closed at break even following a meek US open.
I begin the new week with a tentative bias for risk on trades. Whether the USD takes part as a long or a short is up in the air.
Results:
Trade 1: GBP CAD -1
Trade 2: GBP CAD +1.5
Trade 3: AUD JPY: 0
Total = +0.5%
AUDJPY swingsPrice finally closes above prev swing high, this week should continue the uptrend targeting 108. On LTF such as the 4H, I'm looking for a pullback into 96.7. Once price hits I'll be eyeing the 5-15m for a clean entry with minimum risk. I'll also be checking for divergence against the Yen's highs for a potential swing snipe 🎯

AUDJPY ENTRY POINTAUDJPY is in a bullish trend which broke structure but we are waiting for a liquidity grab into our POI for a potential continuation buy.

AUDJPY Momentum Weakens, Sellers Eye Deeper PullbackAUDJPY has lost steam after a strong recovery rally, with sellers now pressing back below trendline support. The recent rejection near 98.40 signals exhaustion, and the pair looks set for a corrective leg lower toward key support zones. Unless buyers reclaim higher ground quickly, the near-term risk is skewed to the downside.
Current Bias
Bearish – price action shows a breakdown from recent upward momentum, with downside targets opening below 97.10.
Key Fundamental Drivers
RBA Policy: Australia’s central bank remains cautious with no immediate tightening bias, limiting AUD support.
BOJ Policy: Still ultra-loose but rising JGB yields and quiet speculation about adjustments give JPY some underlying support.
Commodities: Weakness in iron ore and concerns around Chinese growth cap AUD upside.
Macro Context
Interest Rates: RBA is holding rates steady, while markets anticipate the Fed and ECB easing earlier than BOJ. Yield differentials still favor AUDJPY upside, but recent data has weakened AUD’s momentum.
Economic Growth: Australia’s growth is slowing; Japan is stable but not accelerating, making yield spreads the main driver.
Geopolitics: Trade tensions and tariff-related uncertainty push investors toward JPY during risk-off episodes, undermining AUD.
Primary Risk to the Trend
A rebound in Chinese demand or a risk-on rally in equities could boost AUD and derail the bearish setup.
Most Critical Upcoming News/Event
Australian retail sales and CPI updates
Japanese inflation data
China PMIs for growth signals impacting AUD
Leader/Lagger Dynamics
AUDJPY is a lagger compared to USDJPY and EURJPY, which tend to set the tone for yen pairs. It is also influenced by AUDUSD moves, making it sensitive to Chinese and commodity-linked headlines.
Key Levels
Support Levels: 97.10, 96.29
Resistance Levels: 97.90, 98.40
Stop Loss (SL): 98.72 (above recent highs)
Take Profit (TP): 97.10 (first target), 96.29 (secondary target)
Summary: Bias and Watchpoints
AUDJPY is turning bearish after losing momentum at 98.40, with sellers eyeing 97.10 and 96.29 as key downside targets. A stop above 98.72 helps protect against sharp rebounds, while risk sentiment and China data remain the main watchpoints. The pair is more of a lagger, following broader yen moves and AUD commodity flows, so traders should watch USDJPY and AUDUSD closely for signals.

Sellers Absorbed - Bears Trapped at 97To see my confluences and/or linework, step 1: grab chart, step 2 : unhide Group 1 in object tree, step 3, hide and unhide specific conflunces.
🎯 AUDJPY: Sellers Absorbed at Critical Zone - Bulls Take Control
The Market Participant Battle:
The most powerful confluence just revealed itself: On Thursday September 18 at 6pm, we witnessed a massive red candle with POSITIVE delta - clear evidence that aggressive sellers are being absorbed by institutional buyers at this critical level. This is textbook absorption where smart money steps in to buy every sell order that hits the market. Combined with a bullish stacked imbalance at this exact price, we're witnessing bears trapped in a liquidity zone where institutional buyers have set their trap. Price should explosively return higher as trapped shorts cover.
Confluences:
Confluence 1: Volume Footprint Delta Divergence (CRITICAL)
The Thursday 18 Sep 6pm candle shows the smoking gun - a large red bar with positive delta (+404 total delta visible on footprint). This means despite price closing lower, buyers absorbed ALL selling pressure and then some. This single bar delta divergence is one of the most powerful reversal signals in orderflow trading. Additionally, there's a bullish stacked imbalance at this level showing buyers overwhelming sellers at multiple price points.
Confluence 2: Proven Market Participants Zone (Points 1-2-4)
The close above point 1 from point 3 validates point 2 as a proven set of institutional buyers. Point 4's return to this exact zone shows smart money re-entering at their original accumulation area. This is classic institutional behavior - they defend their levels and add to positions on retests. The absorption visible in the footprint confirms these are the SAME buyers from point 2.
Confluence 3: VWAP 1st Standard Deviation from Major Pivot
The VWAP anchored from pivot 0 shows point 4 precisely touching the 1st standard deviation band. This represents a statistically significant mean reversion opportunity where 68% of price action typically occurs. The positive delta at this VWAP level confirms algorithmic buying programs are active.
Confluence 4: Fibonacci Golden Zone (0.62-0.79)
The pullback from points 2-3 shows point 4 landing perfectly within the 0.62-0.79 Fibonacci retracement range. This mathematical precision combined with the absorption pattern suggests institutional algorithms are executing buy programs at these predetermined levels.
Confluence 5: Volume Profile POC Magnetic Zone
The fixed range volume profile from points 1-2 shows the Point of Control aligning with point 4. The extended profile from 0.5 to 3 shows resistance at the upper value area high, tracing back to pivot 0. This high-volume node is where the absorption is occurring.
Confluence 6: Triple Divergence Power Play
Both RSI and MFI show a rare 3rd-degree hidden bullish divergence between points 2 and 4. Combined with the delta divergence on the footprint, we have FOUR separate divergence signals all confirming the same thing - bears are exhausted.
Confluence 7: OBV Trend Confirmation
On-Balance Volume shows an unbroken uptrend with price touching the lower Bollinger Band at point 4. The positive delta despite red candles confirms this is accumulation, not distribution.
Web Research Findings:
- Technical Analysis: Multiple sources confirm AUDJPY in strong bullish trend with 97.45 as key support
- Recent News/Earnings: RBA cut to 3.60% but GDP surprised at 0.6% quarterly growth - economy stronger than expected
- Analyst Sentiment: "Strong Buy" ratings across multiple timeframes
- Data Releases & Economic Calendar: Light week ahead - technical patterns can play out cleanly
- Interest Rate Impact: BOJ remains at 0.50% while RBA at 3.60% - differential still favors AUD
Layman's Summary:
Big money is buying every sell order that hits the market - that's what the positive delta on red candles means. It's like watching whales eat up all the small fish. When you see sellers getting absorbed this aggressively at a support level, it usually means a violent move up is coming as trapped shorts panic-cover their positions.
Machine Derived Information:
- Image 1: 4H chart showing numbered pivot points - Significance: Clear 1-2-3-4 pattern with support test - AGREES ✔
- Image 2: 4H chart with indicators - Significance: Triple divergence setup confirmed - AGREES ✔
- Image 3: Volume Footprint showing delta absorption - Significance: Smoking gun evidence of buyer absorption - STRONGLY AGREES ✔
Actionable Machine Summary:
The volume footprint provides irrefutable evidence of institutional accumulation. The positive delta on red candles is the orderflow equivalent of catching someone red-handed. Combined with mathematical precision across VWAP, Fibonacci, and volume nodes, plus quadruple divergences, this setup screams institutional accumulation before a major move higher.
Conclusion:
Trade Prediction: SUCCESS
Confidence: VERY HIGH
The absorption pattern visible in the footprint is the missing piece that elevates this from high-probability to near-certainty. When sellers can't push price lower despite aggressive selling (positive delta on red bars), it means buyers are absorbing everything and preparing for a squeeze higher. Risk/reward exceeds 5:1 with stops below 96.80 and targets at 98.50-99.00. This is a gift setup.

AUDJPY Bullish setup with volume profileHello!
We have here an interesting setup in AUDJPY 4H chart.
If you can see, after placing the volume profile in the trending leg, the poc aligns with a previous resistance zone.
If price arrives here, there is a good chance for it to turn pullback.
Quick 1:1.
Trade at your own risk

AUD/JPY – Institutional Long SetupMacro & COT
Despite net shorts still dominating the AUD, the latest COT report shows a notable increase in longs (+8,076) and a sharp reduction in shorts (-19,995).
On the JPY side, institutions added +11,181 shorts, signaling persistent weakness in the yen.
This intermarket delta points to relative strength of the AUD against the JPY in the coming sessions.
Technical Structure
Price is retracing within the 0.25–0.375 Fibonacci zone, holding firmly above the demand area near 95.40.
The broader structure remains bullish, with the latest pullback confirming demand absorption.
Scenarios
Primary Bias (Long): Continuation towards 98.40 → 99.90 as long as demand holds.
Invalidation: A clean break below the demand zone at 95.40 would invalidate the bullish outlook.
Monitoring
Since price still needs time to approach the zone of interest, this setup may take more than a week to trigger.
Until then, monitoring weekly COT positioning and price action as it approaches demand will be key to confirm institutional flow and entry timing.
📌 Institutional Outlook:
AUD/JPY is setting up for a potential long continuation trade, backed by COT positioning, yen weakness, and demand zone confluence on the H4 chart. Patience is required as price approaches the area of interest.

Short Idea On AUDJPYBased on :
- Supply zone and weekly avwap as entry level
- VP target 4rr
- Cot Analysis
- Quantitative Analysis
AUDJPY - Weekly Turning point?Looking at this AUD/JPY weekly chart, we're seeing a textbook Elliott Wave 5-wave impulse sequence that's been playing out over several years, and it's reached a critical juncture.
The Big Picture Setup:
Starting from the 2020 lows around 60-65, the Australian Dollar has been in a massive bull run against the Japanese Yen. What we're looking at is a complete 5-wave Elliott impulse that began in 2020 and appears to have topped out in 2024.
How the Waves Unfolded:
Wave 1 kicked off the rally from 2020 lows, pushing up to around 85
Wave 2 was a healthy correction back to the mid-70s in 2021
Wave 3 was the powerhouse move - the strongest and longest wave that took us from the 70s all the way up past 100, which is classic Wave 3 behavior
Wave 4 gave us another correction down to around 90-95 levels
Wave 5 completed the sequence with a final push to the highs around 109-110 in 2024
What's Happening Now:
Here's where it gets interesting. The price has reversed from those Wave 5 highs and we're now in what appears to be the beginning of a major corrective ABC pattern.
The chart shows two key selling zones:
The "FIRST SELL ZONE" around 103-104 levels
The "LAST SELL ZONE" around 97-100 levels
Right now, we're trading around 97.50, which puts us right in that critical last sell zone. This suggests the market is at a make-or-break level.
The Trading Setup:
The red X marked at the top indicates this was likely identified as a major reversal point. The "Take Profit" level is marked way down around 84-87, which would represent a substantial decline from current levels.
What This Means:
If this Elliott Wave count is correct, we could be looking at a significant multi-year correction in AUD/JPY. The pair has completed its major bullish cycle and may now be entering a prolonged bearish phase. That last sell zone around current levels could be the final opportunity for the bulls before a more serious decline unfolds.
The key thing to watch is whether price can hold above that 97 area, or if it breaks down toward that much lower target zone.

Have my eyes on Australian DollarAUDJPY - I already talked about Australian Dollar on my GBPAUD personal view. I am waiting the High Impact Extended news for AUD to see how the price will move.

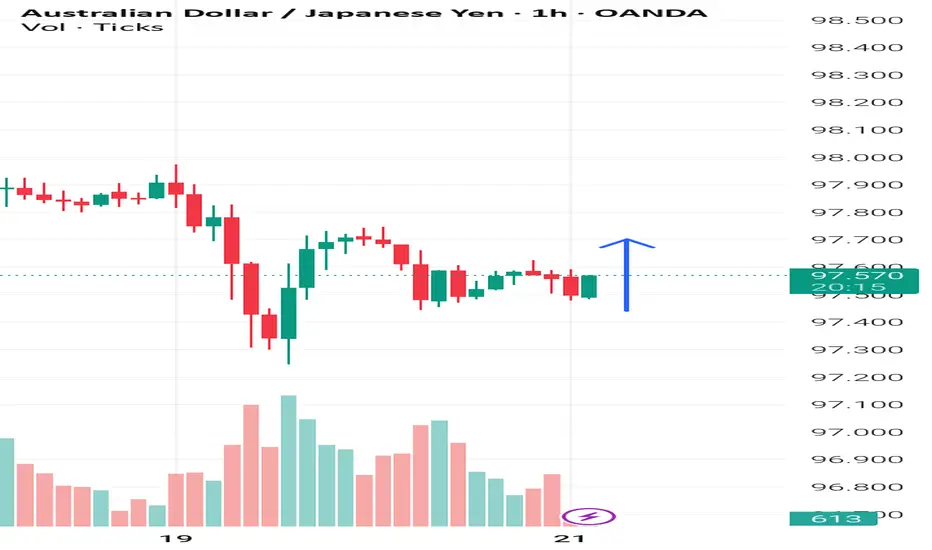
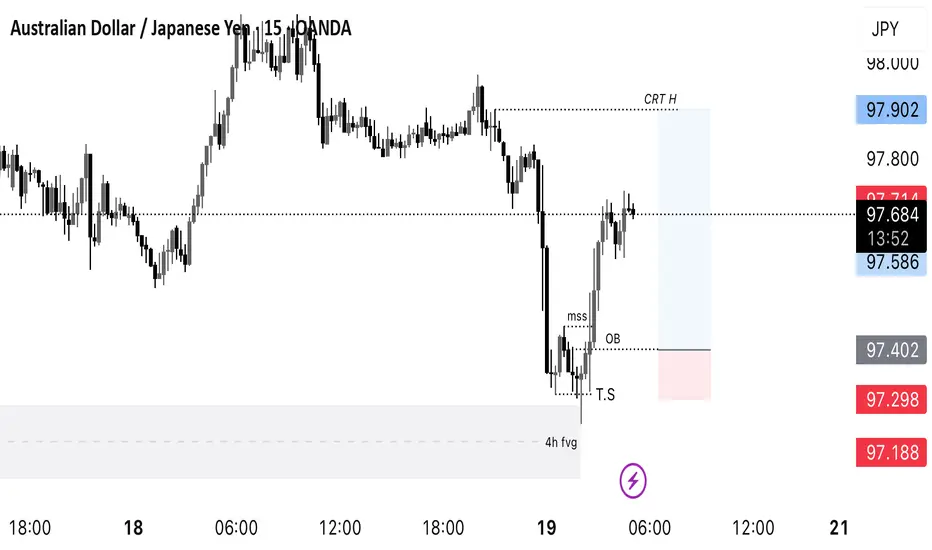
Buy idea on AudJpyPrice takes out a 4h candle’s low and then mitigates a 4h fair value gap.
On the 15m it gives a market structure shift upwards and I set limit as an order block. Targets is 4h CRT high
Short JPY: live trade post BOJ meeting. The BOJ held interest rates, initially it appeared it was a 'hawkish hold' (two votes for a rate hike). The JPY strengthened.
But at the press conference, the immediate likelihood of another hike was played down. Hence I've placed a 'JPY short trade' in expectation the initial post decision strength will reverse.
It's a 25 pip stop loss, with 30 pip profit target.
The risk to the trade is negative market sentiment.
If it's ongoing I will close the trade before end of day to avoid weekend risk.

AUD/JPY SHORT FROM RESISTANCE
Hello, Friends!
The BB upper band is nearby so AUD-JPY is in the overbought territory. Thus, despite the uptrend on the 1W timeframe I think that we will see a bearish reaction from the resistance line above and a move down towards the target at around 96.239.
Disclosure: I am part of Trade Nation's Influencer program and receive a monthly fee for using their TradingView charts in my analysis.
✅LIKE AND COMMENT MY IDEAS✅

19.09.25 Morning ForecastPairs on Watch -
FX:AUDJPY
FX:GBPJPY
A short overview of the instruments I am looking at for today, multi-timeframe analysis down to what I will be looking at for an entry. Enjoy!

AUDJPY Retracement RoadmapPrice has dropped into my marked retracement zone.
I see strong chances of a bounce from this area.
My expectation → pullback towards 97.550 (Fib 0.382 level).
👉 Watching carefully how price reacts near the 0.5–0.618 zone for confirmation.

18.09.2025 #AUDJPY🆓 Sell Entry: 98.1000
⏹️ Stop Loss: 98.8000
*️⃣ Take Profit-1: 97.4300
*️⃣ Take Profit-2: 97.0000

AUDJPY Strong cyclical Sell SignalLast time we made a call on the AUDJPY pair was 6 months ago (March 28, see chart below), giving a sell signal that quickly hit our 91.000 Target:
This time we have the price trading near the Top (Higher Highs trend-line) of a 4-month Channel Up but in the past 2 days has seen a minor pull-back on its 4H MA50 (blue trend-line).
This can be explained cyclically as based on the previous two Higher Highs and using the Time Cycles, the pattern topped exactly 2 days ago (just under the 1.382 Fib extension) and is technically in need of a correction towards its 0.5 Fibonacci retracement level.
As a result, and since the 1D RSI also dipped below its MA (consistent with both previous tops), we turn bearish on this pair, targeting 96.500.
-------------------------------------------------------------------------------
** Please LIKE 👍, FOLLOW ✅, SHARE 🙌 and COMMENT ✍ if you enjoy this idea! Also share your ideas and charts in the comments section below! This is best way to keep it relevant, support us, keep the content here free and allow the idea to reach as many people as possible. **
-------------------------------------------------------------------------------
💸💸💸💸💸💸
👇 👇 👇 👇 👇 👇
