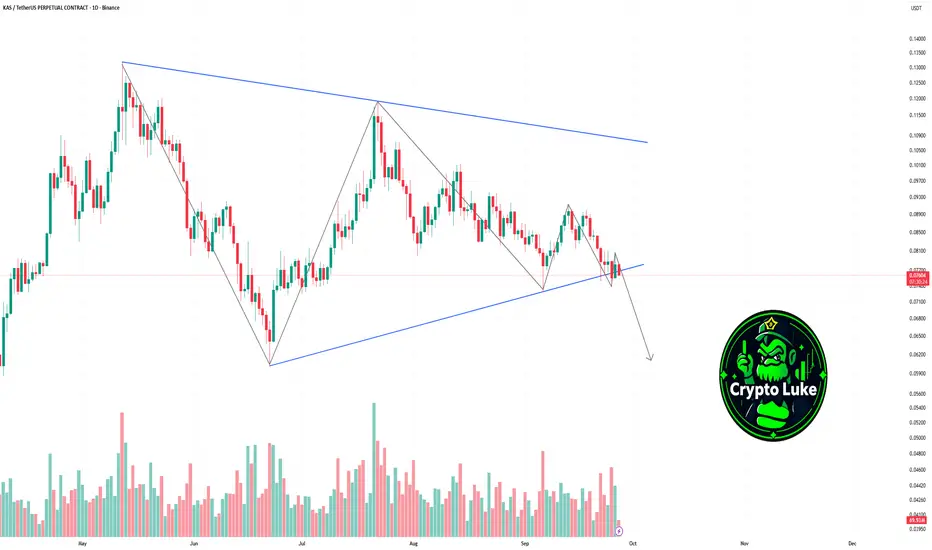
Kaspa is breaking down the triangle!Hi Traders, Kaspa is testing the ascending trendline and looks ready to break down. A confirmed close below this level could trigger further downside continuation.
Kas long to $0.08970 areaJust opened a long position on Kas. Aiming for $0.089571
sl: 0.086340
Time sensitive

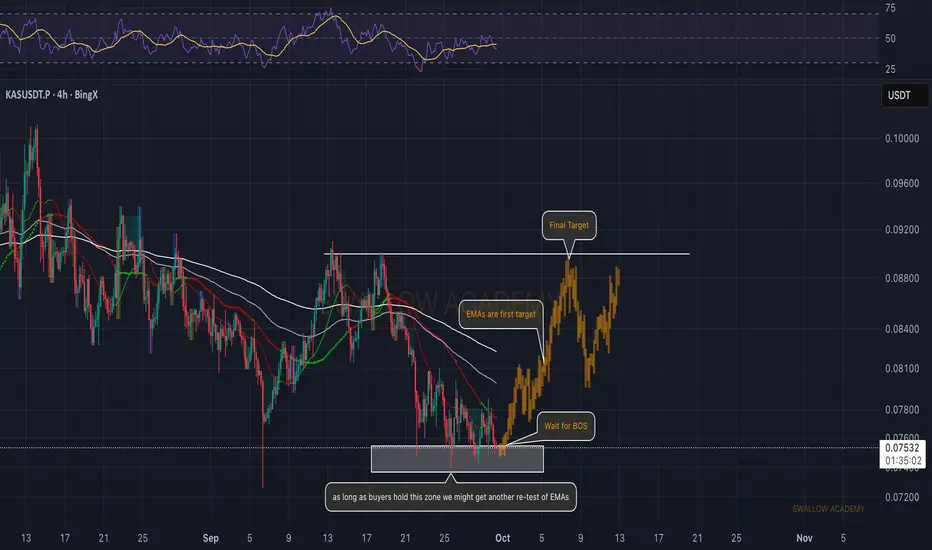
Kaspa (KAS): Expecting Bounce From Current Support ZoneKAS is holding its current support zone well, giving buyers a chance to defend structure. As long as this area doesn’t break, we could see another push into the EMAs, which stand as the first target. From there, a successful break of structure will be the key step for continuation toward higher leve
Kaspa (KAS): Looking For Buy Entry After 200EMAKAS is holding the ascending support trendline while pressing against the EMAs. Buyers are building momentum and we are looking for a full-scale breakout from here. If confirmed, the next target sits around 0.16.
Swallow Academy

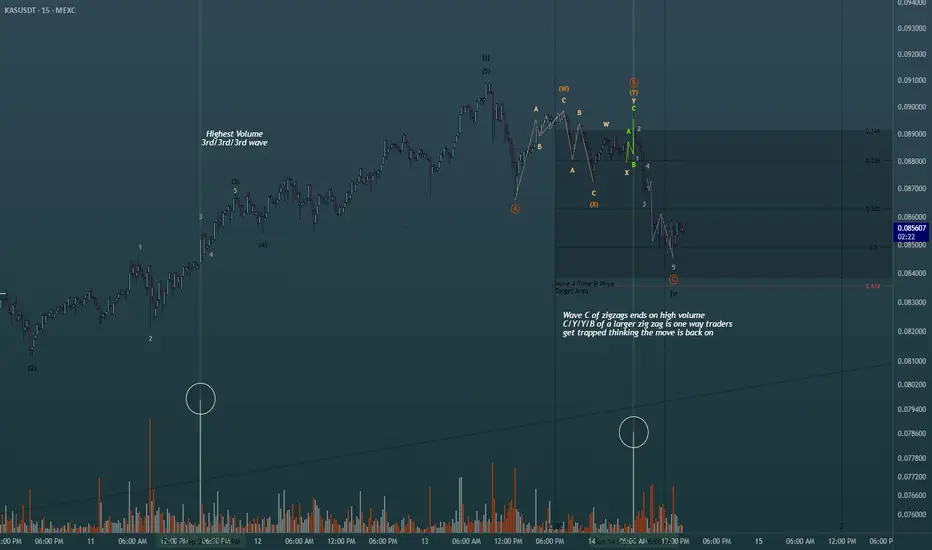
Using simple volume for added confluence in Elliott Wave Theory!Shown on the chart is 2 of the ways you can use the highest volume spikes on the chart to find out where you are in the wave count. Easiest way is to find the highest volume with the steepest slope of trend to label as your third wave. Same concept whether its bearish bars printing or bullish bars.
KAS Market Update📊 CSE:KAS Market Update
Two potential entry / re-entry zones:
👉 First around $0.083927 🟢
👉 Second deeper entry around $0.077555 🟢
⚡ Wait for confirmation — both levels could offer strong bounce setups 🚀
⚡ Trade smarter, not hope 🔑

KASUSDT.P LONGLet the price move toward our entry price.
I hoping the price will take the liquidity and than go up.
Lets wait and watch how price react at our levels.
Always take 50% profit at our 50% level and than bring the s.l to the entry price.
Keep supporting guys keep following me.

Kas Long & ShortLong based on strong support and accumulation zone
Short based on possible Bat Harmonic Pattern

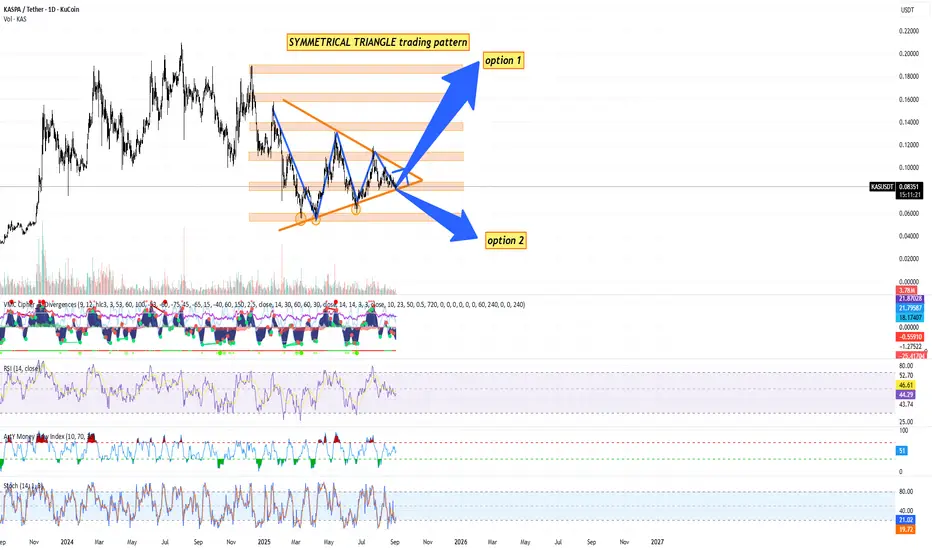
KASPA / USDT DAILY CHART KUCOIN - TA + TRADE PLANTechnical Analysis (Daily Timeframe) by Blaž Fabjan
Chart Pattern
The price is consolidating within a Symmetrical Triangle pattern.
This is a neutral continuation pattern – it signals that a major breakout (either upward or downward) is approaching as the apex is nearing.
Both higher lows and
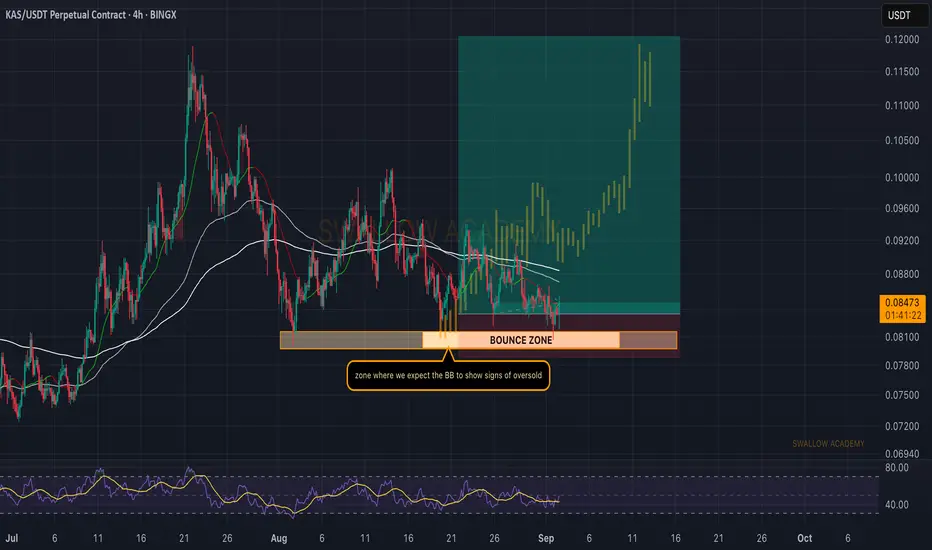
Kaspa (KAS): Expecting Explosive Bounce Soon KAS is still sitting in our bounce zone, and the game plan remains unchanged. As long as price holds above this support, we keep looking for a proper reversal to take us higher.
We’ll be paying attention to the Bollinger Bands here as well — once they start showing oversold conditions, the bounce b
See all ideas
Displays a symbol's price movements over previous years to identify recurring trends.