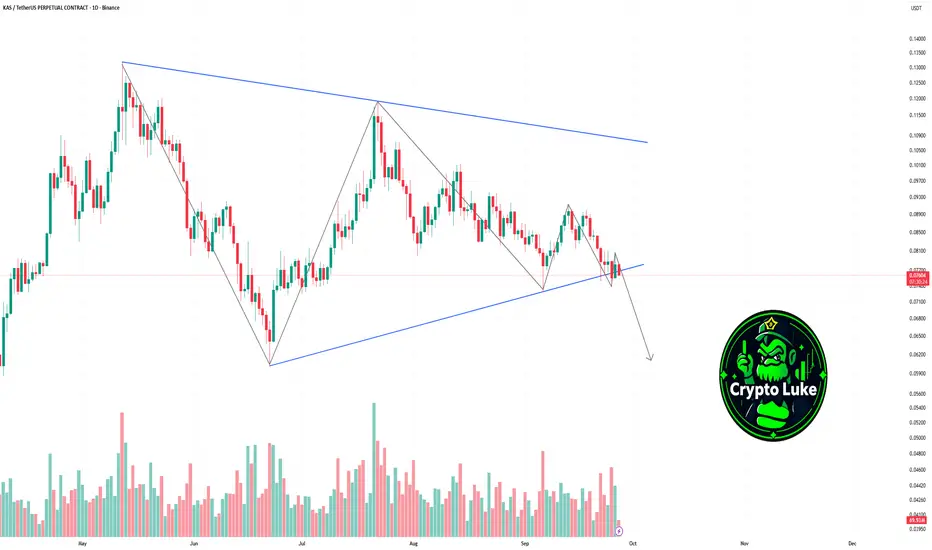
Kaspa is breaking down the triangle!Hi Traders, Kaspa is testing the ascending trendline and looks ready to break down. A confirmed close below this level could trigger further downside continuation.
KASUSDT.P trade ideas
Kas long to $0.08970 areaJust opened a long position on Kas. Aiming for $0.089571
sl: 0.086340
Time sensitive

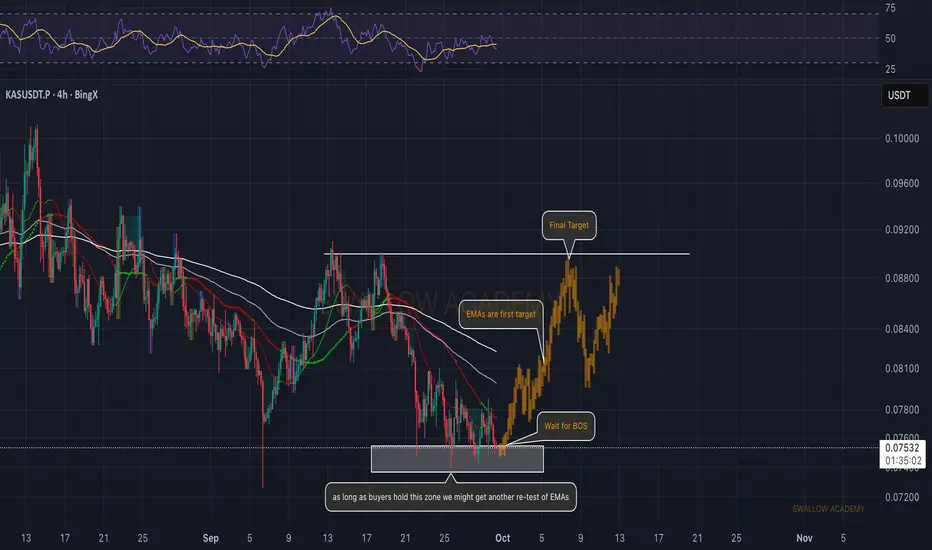
Kaspa (KAS): Expecting Bounce From Current Support ZoneKAS is holding its current support zone well, giving buyers a chance to defend structure. As long as this area doesn’t break, we could see another push into the EMAs, which stand as the first target. From there, a successful break of structure will be the key step for continuation toward higher levels, with the final target sitting at $0.092.
Swallow Academy
Kaspa (KAS): Looking For Buy Entry After 200EMAKAS is holding the ascending support trendline while pressing against the EMAs. Buyers are building momentum and we are looking for a full-scale breakout from here. If confirmed, the next target sits around 0.16.
Swallow Academy

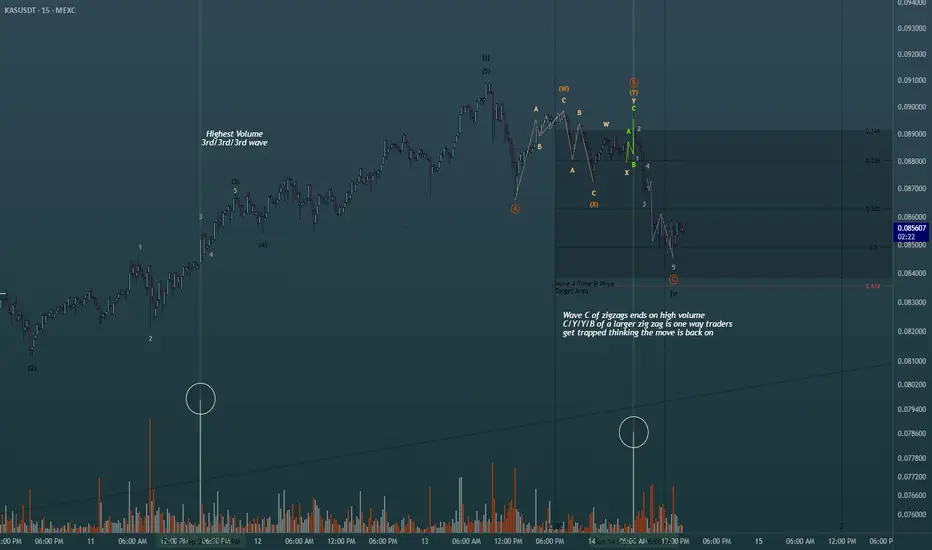
Using simple volume for added confluence in Elliott Wave Theory!Shown on the chart is 2 of the ways you can use the highest volume spikes on the chart to find out where you are in the wave count. Easiest way is to find the highest volume with the steepest slope of trend to label as your third wave. Same concept whether its bearish bars printing or bullish bars. The highest volume shown is actually part of the retracement, albeit in one of the actionary waves (moving with trend), alot of buying happened at the termination of the wave C of the zig zag shown in green. Perfect scenario to rake in buy orders from retail then dump on them to finish out the WXY pattern. This is just 2 of the many scenarios in which you can find help from the volume oscillator to give you a directional bias in Elliott Waves. Happy Trading
KAS Market Update📊 CSE:KAS Market Update
Two potential entry / re-entry zones:
👉 First around $0.083927 🟢
👉 Second deeper entry around $0.077555 🟢
⚡ Wait for confirmation — both levels could offer strong bounce setups 🚀
⚡ Trade smarter, not hope 🔑

KASUSDT.P LONGLet the price move toward our entry price.
I hoping the price will take the liquidity and than go up.
Lets wait and watch how price react at our levels.
Always take 50% profit at our 50% level and than bring the s.l to the entry price.
Keep supporting guys keep following me.

Kas Long & ShortLong based on strong support and accumulation zone
Short based on possible Bat Harmonic Pattern

KASPA / USDT DAILY CHART KUCOIN - TA + TRADE PLANTechnical Analysis (Daily Timeframe) by Blaž Fabjan
Chart Pattern
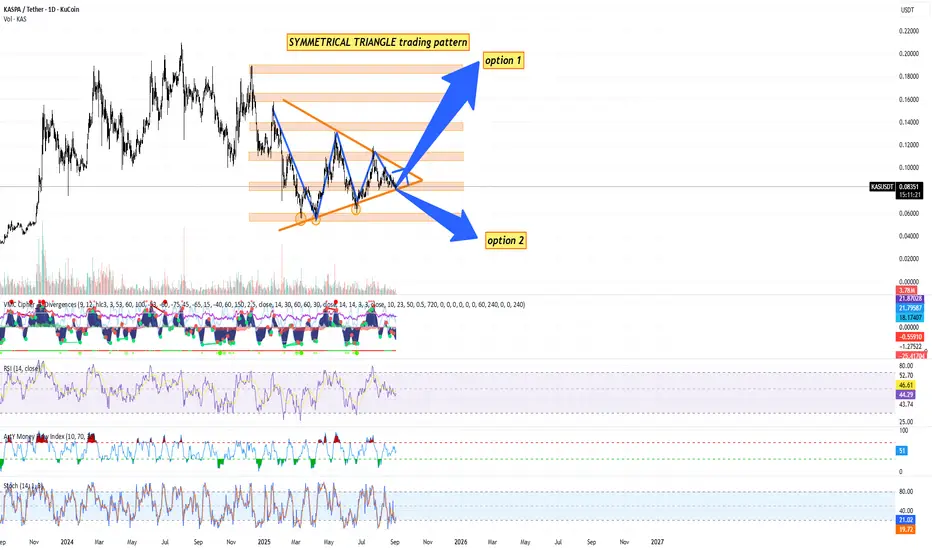
The price is consolidating within a Symmetrical Triangle pattern.
This is a neutral continuation pattern – it signals that a major breakout (either upward or downward) is approaching as the apex is nearing.
Both higher lows and lower highs confirm the formation.
Key Support & Resistance Levels
Immediate support zone: $0.080 – $0.082
Strong support below: $0.070
Immediate resistance: $0.095 – $0.100
Major resistances above: $0.120, $0.140, $0.160, $0.200, $0.220
Indicators
Volume: Declining within the triangle – typical before a breakout.
RSI (14): ~46 → Neutral, no overbought/oversold signals.
Stochastic RSI: Oversold (~20), suggesting possible short-term upside bounce.
MFI (Money Flow Index): Neutral (~51), showing balanced inflows/outflows.
MACD/VM indicator: Bearish momentum has slowed, histogram flattening.
Scenarios
Option 1 (Bullish breakout): If KAS breaks above the $0.095–$0.100 zone with volume, next targets are $0.120 → $0.140 → $0.160 → $0.200+.
Option 2 (Bearish breakdown): If KAS loses $0.080, potential retest of $0.070 → $0.060 support levels.
Trading Plan for KAS/USDT
🔹 Short-Term Swing Trade (1–4 weeks)
Entry Zone (Buy):
Aggressive: $0.082 – $0.085 (current support area).
Conservative: On confirmed breakout above $0.095 with volume.
Stop Loss:
Below $0.078 (tight stop) OR below $0.070 (safe stop).
Take Profit Targets:
$0.100 (first resistance, partial TP)
$0.120 (main target)
$0.140 (strong resistance)
🔹 Medium-Term Position Trade (1–3 months)
Entry Strategy: Accumulate in the $0.080–$0.085 range.
Stop Loss: Below $0.070 (close daily candle confirmation).
Targets:
Base case: $0.160
Optimistic case: $0.200 – $0.220
🔹 Risk Management
Risk per trade: 1–2% of portfolio.
Position sizing according to stop-loss distance.
Avoid over-leveraging; triangle breakouts can produce false moves before direction confirms.
Kaspa is entering the decision zone – the symmetrical triangle is compressing, and a major breakout is imminent in coming weeks.
Momentum indicators show neutrality, giving equal probability for either breakout direction.
The safest approach is to wait for breakout confirmation (daily close above $0.095 or below $0.080 with volume).
If bullish, Kaspa could target +40–100% upside over the next quarter. If bearish, downside risk is -20–30%.
Recommendation:
For conservative traders → wait for breakout confirmation.
For aggressive traders → accumulate around support ($0.082–$0.085) with tight stop-loss below $0.078 and scale out profits at resistance levels.
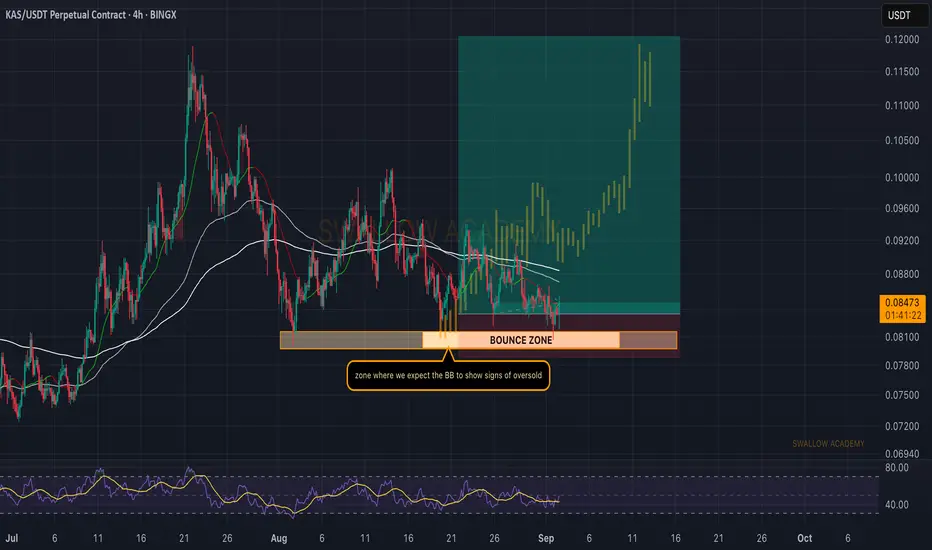
Kaspa (KAS): Expecting Explosive Bounce Soon KAS is still sitting in our bounce zone, and the game plan remains unchanged. As long as price holds above this support, we keep looking for a proper reversal to take us higher.
We’ll be paying attention to the Bollinger Bands here as well — once they start showing oversold conditions, the bounce becomes even more likely. No changes for now, patience until the buyers step in.
Swallow Academy
KASPA retracement for wave 2 complete?Shown is a count for an extended wave 5 of the first impulse. wave 2 barely retraced enough to satisfy me so i included an image with an extended correction for wave 2. Main chart shows a 1,2 forming for a bullish continuation in wave 3....IF the correction is done and we continue grinding up with 1,2 structures. Could KASPA run all the way to December! Time will tell. Happy Trading

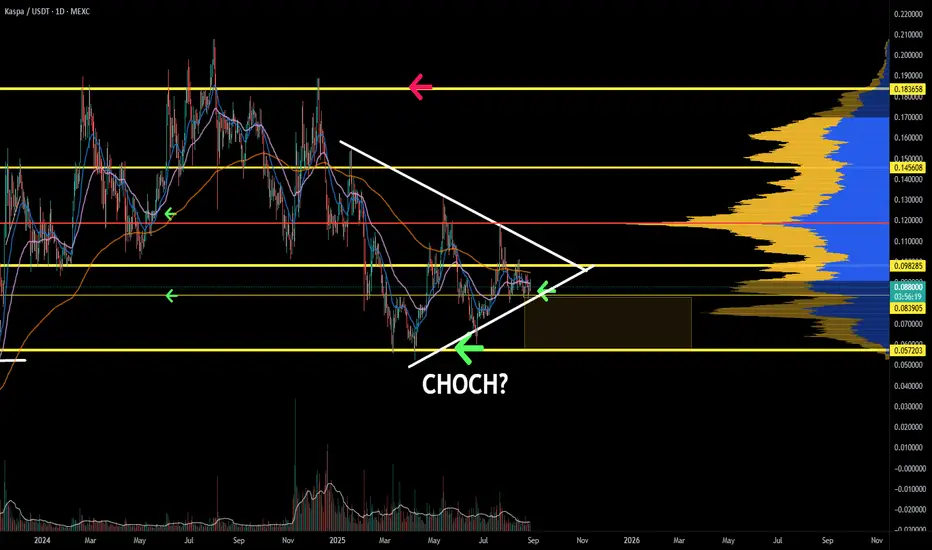
Kaspa in the trenches looking for its bottom. KAS is consolidating above the defined POI. If a proper CHOCH can be achieved here, we have likely touched the bottom. However, a BOS will bring the price down to the next extension.
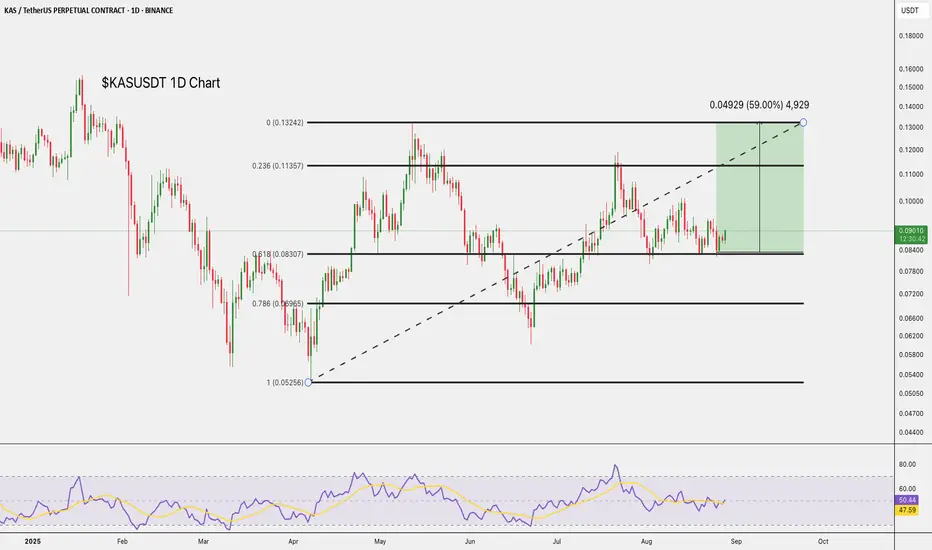
$KAS Poised for 59% Upside.CSE:KAS is holding above the $0.08403 support.
A bounce here could push it toward $0.10118 and possibly $0.13275, offering about 59% upside.
RSI is neutral, leaving room for momentum to build.
DYOR, NFA
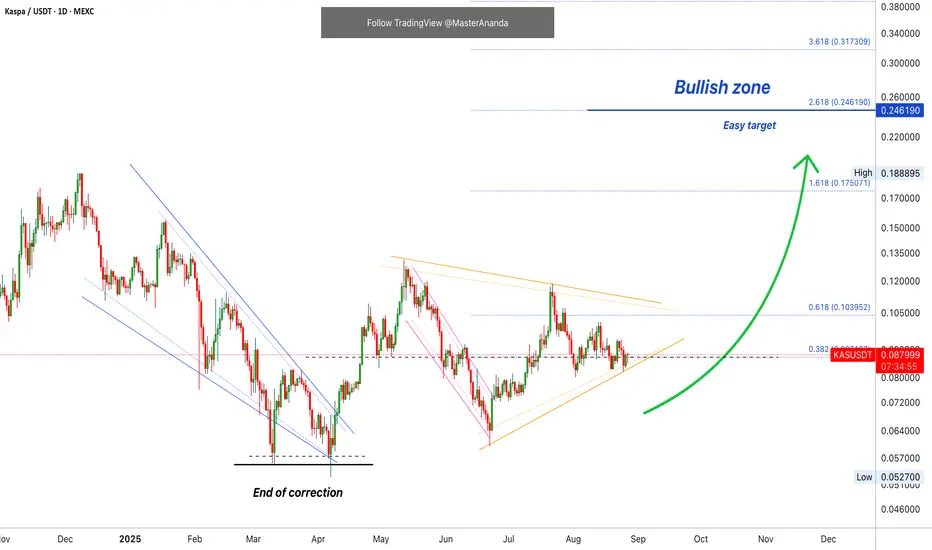
Kaspa · Futures Trade-NumbersHere we have the daily (D) Kaspa (KASUSDT) chart. To me is really important to start by knowing the market direction. I can start with a process of elimination.
An uptrend is not present because we don't have higher highs and higher lows.
A downtrend is not present because we don't have lower highs and lower lows.
Which one comes next?
A correction (downtrend) just ended and the market produced a bullish move as a bounce. The jump from the 7-April low and support to the high mid-May. That's the first move and that's change.
So we know the market is no longer in a downtrend and we know it produced a bullish jump.
What happens after this bullish jump? What happens after the May peak?
The market corrects but ends in a higher low. This is classic. I know these are the same signals but they work. It is basic and simple.
The retrace from May ended in a higher low in June and this reveals a bullish bias.
So we know we are in a transition. Not a downtrend but not an uptrend either, but we know the market is bullish because the last jump ended in a higher low. The last jump is being consolidated before additional growth.
This one can take up to 10X or even more. You have to choose your own level of margin of course. Full trade-numbers below:
_____
LONG KASUSDT
ENTRY: 0.083000 - 0.089000 (STOP: 0.082000)
TARGETS: 0.103952, 0.131119, 1.58286, 1.75071, 0.202222, 0.246190
_____
Thank you for reading.
If you enjoy the content, consider hitting follow. It only takes a minute and it makes the whole difference.
Namaste.
Kaspa (KAS): Waiting For Bounce Zone To Be Reached KAS looks pretty weak, and we are expecting to see some flash downside movement from here, which then would give us an opportunity for upside movement with a potential. lof 1:9 RR position.
Entering into Q4—expecting bullish movement.
Swallow Academy

KAS Setup – Retest of Broken Resistance as SupportKASPA (KAS) has recently broken above a key resistance zone, and is now retesting that level as support — a classic bullish continuation signal.
📌 Entry Zone: $0.090 – $0.095
🎯 Targets:
• TP1: $0.105 – $0.12
• TP2: $0.13 – $0.15
• TP3: $0.17 – $0.19
🛑 Stop Loss: Just below $0.08
If the support holds, this area offers a low-risk, high-reward opportunity for spot traders targeting the next leg up.
📈 Always manage your risk. Wait for confirmation on lower timeframes if needed.

KASPA – Structurally Bottomed & Primed for the Next Leg Up?On KASPA’s first explosive run in Feb 2023, price rocketed from $0.007 to $0.04275 by April before topping out and beginning a deep correction.
That correction shaved off 73%, bottoming at $0.01165 — my initial spot entry, I might add 👍.
From there, KASPA went on a fantastic run, eventually topping at $0.2083 — a level most retail traders remember as the peak of the hype cycle.
Since then, the asset has been trapped under a long-term downward resistance line for over a year. And here’s the interesting part — history just repeated itself. Price has once again cooled off by roughly 73%, this time landing right in the Fibonacci 0.786 retracement zone and testing the top of the previous breakout’s resistance zone.
The $0.0527 low in May 2025 may very well have been the bottom of this entire correction, putting KASPA into a reaccumulation phase and setting the stage for the next major leg up.
Of course, the timing and size of that move will depend on:
Overall market health
Global economic conditions
Federal monetary policy
Progress in KASPA’s adoption — especially large exchange listings
Regardless, KASPA’s unique fundamentals — first-mover BlockDAG technology, no pre-sale, and fully organic community-driven funding — make it an attractive long-term play at current prices and below.

Kas dump back to $0.08Just now opened a new short position on KAS. Aiming for new lows around 0.08
SL: 0.088180, I think that should be conservative enough. Only went in with small size as I have 2 other positions open.
2-2.67RR
Time sensitive
DTT strategy applied

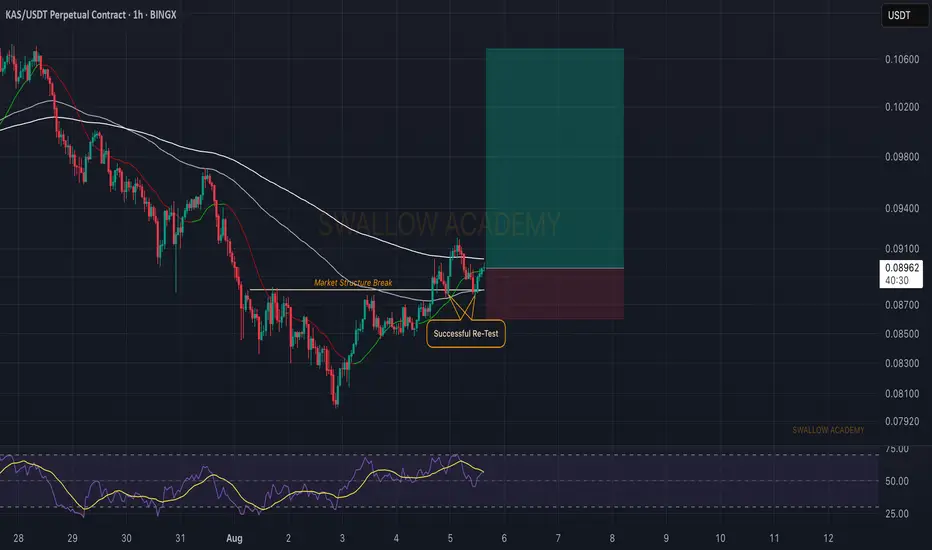
Kaspa (KAS): Market Structure Break + Re-Test = Buy EntryKaspa looks good for the long haul here, with a 1:5 risk and reward ratio. There is nothing much to say, other than as long as we keep that current buy-side momentum, we are good for a long time here.
Ideal and final confirmation would be if we would form the break of structure near the $0.92 area.
Swallow Academy
Kas short to $0.082662Just now opened up a short position on KAs
Sl: 0.086270
Tp: 0.082662
Roughly 2rr

Kas short to $0.0816Just now opened a short on KAS.
Sl: $0.08749
limit entry: $0.08548
Tp: $0.0816
Risk to reward: 1:2
DTT analysis applied - learn more on X

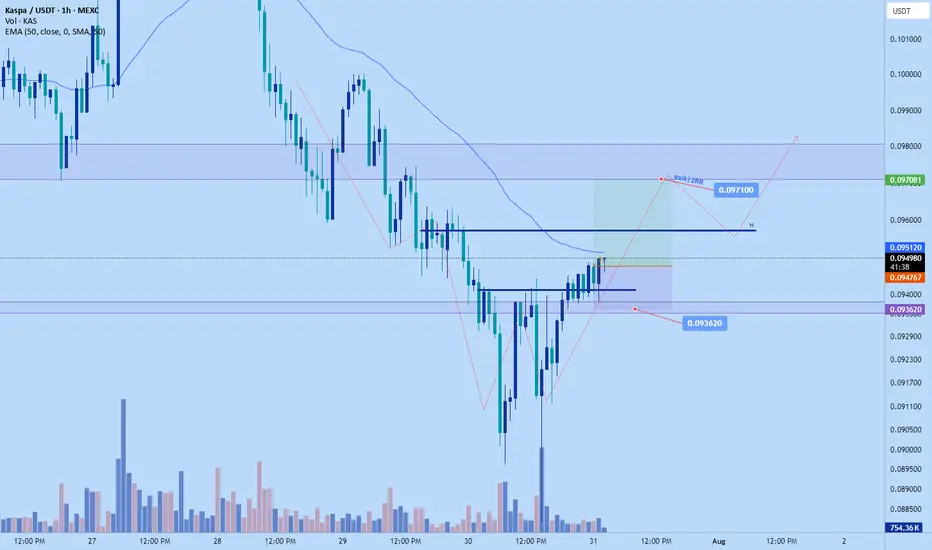
Kas scalp long to $0.0971Just now opened a long position on Kas. Based on the bulls are gaining control right now and the price is relatively low on htf
Setup aligns wit my DTT strategy
Sl: $0.093620
Time sensitive.
long on $kas-0.045-0.073 accumulationno VC
No premine
No Owner
Pure bitcoin idea is kaspa
TA: Currently making lower high , W pattern, if it could se support levels at 0.055-0.065
August 31 L2 , kaspelx smart contract launch,
Igra lab also planning,
