#KDA/USDT bullish structure formed at the chart#KDA
The price is moving within a descending channel on the 1-hour frame, adhering well to it, and heading for a strong breakout and retest.
We have a bearish trend on the RSI indicator that is about to be broken and retested, which supports the upward breakout.
There is a major support area in g

#KDA/USDT Stay Adaptive ?#KDA
The price is moving within a descending channel on the 1-hour frame and is expected to break and continue upward.
We have a trend to stabilize above the 100 moving average once again.
We have a downtrend on the RSI indicator that supports the upward move with a breakout.
We have a support a

#KDA/USDT bullish structure formed at the chart#KDA
The price is moving within a descending channel on the 1-hour frame, adhering well to it, and heading for a strong breakout and retest.
We have a bearish trend on the RSI indicator that is about to be broken and retested, which supports the upward breakout.
There is a major support area in g

KadenaKda usdt daily analysis
Time frame daily
Risk rewards ratio >4.2 👈👌
Target 0.58$
I have a short time long position for kadena with same Risk rewards ratio
Entrance = 0.36$
Target = 0.45$
LS =0.34$

KDA/USDT — Accumulation or Annihilation? Key Decision Zone!🧩 Big Picture
Kadena (KDA) is still trapped in a long-term consolidation phase after its sharp decline from the 2021 peak. Currently, price is holding at the 0.31–0.42 USDT support zone, which has acted as a “last fortress” for buyers for over 3 years.
The structure is intriguing: despite the domi

#KDA/USDT Stay Adaptive ?#KDA
The price is moving within an ascending channel on the 1-hour frame, adhering well to it, and is on its way to breaking strongly upwards and retesting it.
We have support from the lower boundary of the ascending channel, at 0.3848.
We have a downtrend on the RSI indicator that is about to br

#KDA/USDT Stay Adaptive ?#KDA
The price is moving within an ascending channel on the 1-hour frame, adhering well to it, and is on track to break it strongly upwards and retest it.
We have support from the lower boundary of the ascending channel, at 0.4300.
We have a downtrend on the RSI indicator that is about to break a

KADENA UPDATEKadena is currently in a strong position in the crypto space. The token has been trading around US $0.44–0.46 with healthy 24-hour volumes and signs of renewed traction. Its unique multi-chain Proof-of-Work architecture, Chainweb, allows the network to remain scalable, energy-efficient, and ready fo

#KDA/USDT Stay Adaptive ?#KDA
The price is moving within a descending channel on the 1-hour frame, adhering well to it, and is on its way to breaking it strongly upwards and retesting it.
We have a bounce from the lower boundary of the descending channel. This support is at 0.4260.
We have a downtrend on the RSI indicato

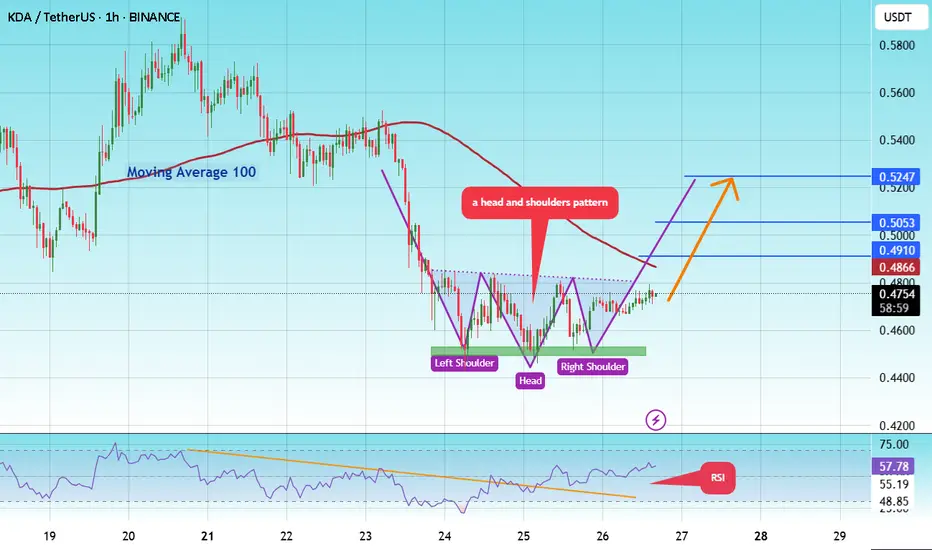
#KDA/USDT Stay Adaptive ! #KDA
The price is moving in a head and shoulders pattern on the 1-hour frame and is expected to break and continue higher.
We have a trend to stabilize above the 100 moving average once again.
We have a bearish trend on the RSI indicator, supporting the upward move with a break above it.
We have
See all ideas
Summarizing what the indicators are suggesting.
Oscillators
Neutral
SellBuy
Strong sellStrong buy
Strong sellSellNeutralBuyStrong buy
Oscillators
Neutral
SellBuy
Strong sellStrong buy
Strong sellSellNeutralBuyStrong buy
Summary
Neutral
SellBuy
Strong sellStrong buy
Strong sellSellNeutralBuyStrong buy
Summary
Neutral
SellBuy
Strong sellStrong buy
Strong sellSellNeutralBuyStrong buy
Summary
Neutral
SellBuy
Strong sellStrong buy
Strong sellSellNeutralBuyStrong buy
Moving Averages
Neutral
SellBuy
Strong sellStrong buy
Strong sellSellNeutralBuyStrong buy
Moving Averages
Neutral
SellBuy
Strong sellStrong buy
Strong sellSellNeutralBuyStrong buy
Displays a symbol's price movements over previous years to identify recurring trends.
Curated watchlists where KDAUSDT.P is featured.

Smart contracts: Make the smart decision
36 No. of Symbols
See all sparks