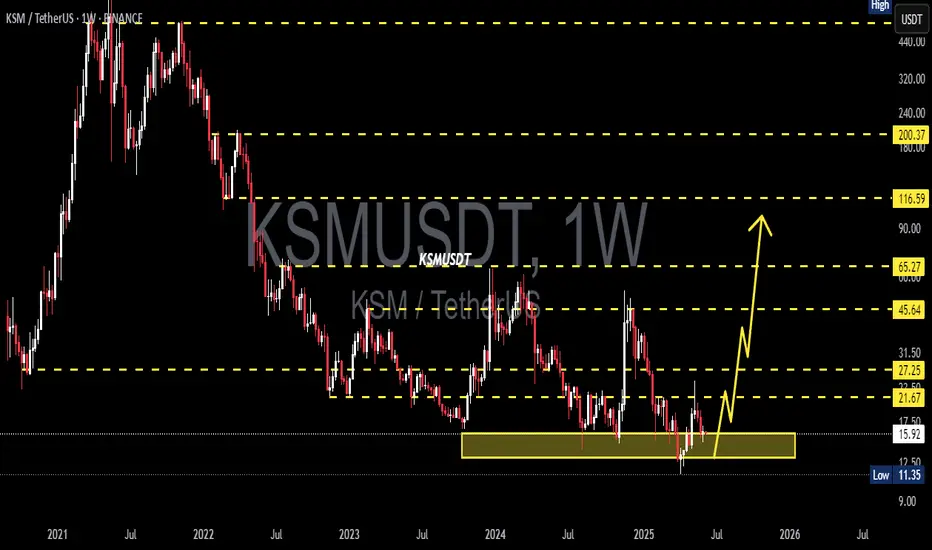
KSM Bullish Outlook Accumulation Zone Holding StrongKSM is showing signs of strength after a prolonged downtrend, holding firmly within the accumulation zone around 11–16. A breakout from this base would set the stage for a major recovery, with the immediate target at 51.14 and a broader projection towards 260.79. As long as price sustains above the

KSM is Ready for 150% + Up Move KSM is making a pattern at Support zone and It is Ready for Breakout from that pattern . and at the same time Altcoin Season Index is at 74 , when it is >75 it is sign of very bullish in altcoins and Breakouts will have very high potential to give a big move .
and at the same time Bitcoin dominance

KSM - 10 WEEKS STUCK IN NEUTRAL BOX🚨 ASX:KSM - Price Analysis: Neutral Stalemate - Bearish Test Incoming? 📉
Quick TA on - charts in limbo mode. 💡
Daily View:
🔸 Very neutral zone, price stuck under key resistances: $15.80 & $16.15. 🤝
🔸 Daily uptrend supporting prices, but buy volume is weak... No real firepower yet. 🐂💤
Expecta

KSM Analysis (4H)Liquidity pools have accumulated at the top, and the price has hit an important supply zone.
Currently, the price is below the flip zone, and there are still untouched liquidity pools at the lower part of the chart. On our chart, we can also see bearish CHs.
The best zone to enter a sell/short pos

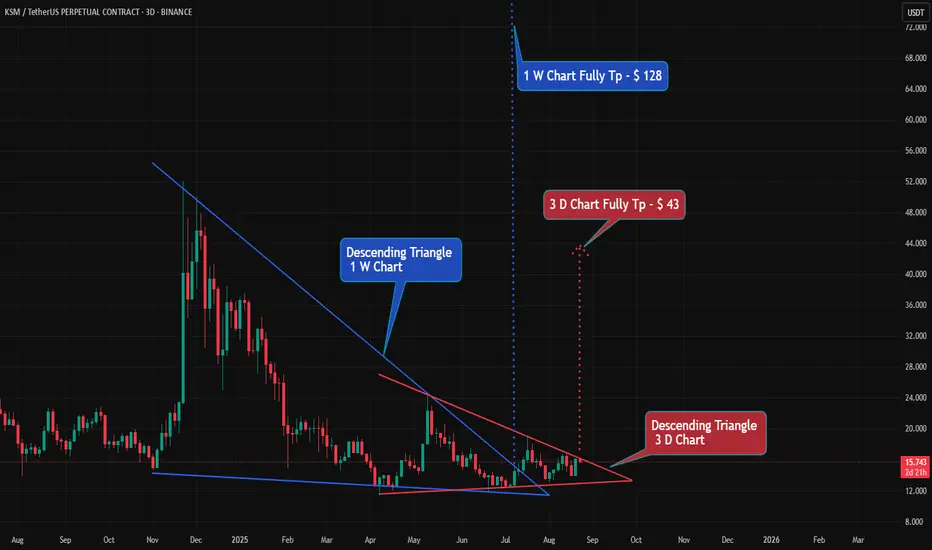
KSM 1W chart has a Desending tringle pattern that has been broke#KSM 1W chart has a Desending tringle pattern that has been broken. 🔼🔼
#KMS Coin is currently forming a Descending Triangle pattern on the 3D chart.
👀 When the market reaches the $723 level, 👀 it shows a double bottom pattern. If it also breaks out, it can rise to $1060.🔼
💵 Tp 1 : $ 443
💵 Tp 2 :
KSM/USDT 15m CHART ANALYSIS.KSM/USDT – 15-Minute Chart Analysis
The market has shown a clear Change of Character (CHoCH), followed by a confirmed Break of Structure (BOS) to the downside, signaling a potential shift in market direction.
Currently, price is retracing and building liquidity below the Buy Side Liquidity (BS

KSMUSDT 1D#KSM is on the verge of breaking out above the descending triangle resistance on the daily chart. Consider buying some #KSM here and near the support level at $14.39.
If a breakout occurs, the potential targets are:
🎯 $21.03
🎯 $24.02
🎯 $27.00
🎯 $31.26
🎯 $36.68
⚠️ Always use a tight stop-loss and a

KSMUSDTHello friends, the KSM currency has made a good double bottom and I think it is prone to good growth (this is just my personal opinion, check it out for yourself). Good luck.

KSMUSDT D – Start of Wave 3? After a clear 5-wave impulsive move up, KSMUSDT seems to have completed a deep ABC correction, potentially marking the end of Wave 2.
📉 Wave 1: We had a clean five-wave move from the bottom, which fits classic Elliott Wave structure.
📉 Wave 2: The correction that followed was much deeper than the

KSMUSDT 1W AnalysisKSM ~ 1W Analysis
#KSM Buy back gradually from here if you still have confidence in this coin with a short term target of 20%+ from here.
See all ideas
Displays a symbol's price movements over previous years to identify recurring trends.