KSM Bullish Outlook Accumulation Zone Holding StrongKSM is showing signs of strength after a prolonged downtrend, holding firmly within the accumulation zone around 11–16. A breakout from this base would set the stage for a major recovery, with the immediate target at 51.14 and a broader projection towards 260.79. As long as price sustains above the accumulation area, the bullish outlook remains valid, while only a decisive drop back below the zone would invalidate the setup.
KSMUSDT.P trade ideas
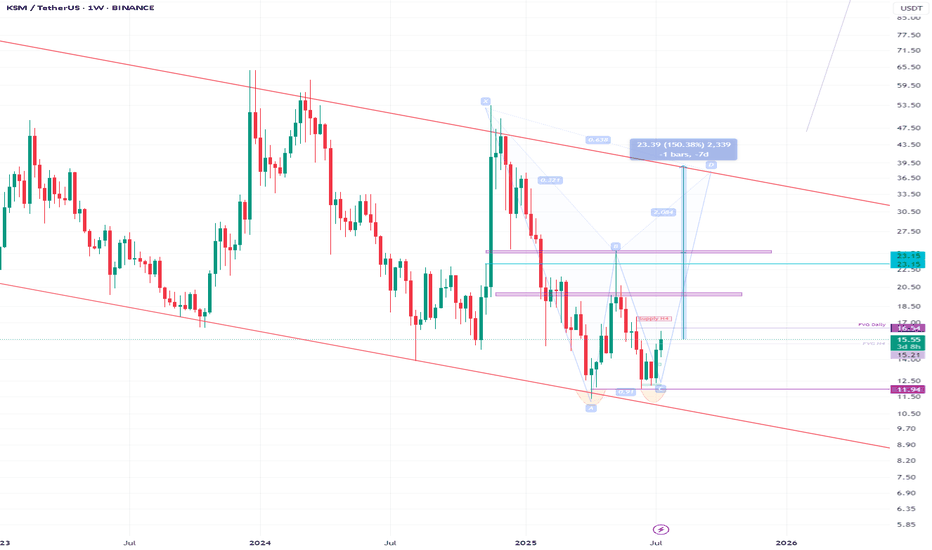
KSM is Ready for 150% + Up Move KSM is making a pattern at Support zone and It is Ready for Breakout from that pattern . and at the same time Altcoin Season Index is at 74 , when it is >75 it is sign of very bullish in altcoins and Breakouts will have very high potential to give a big move .
and at the same time Bitcoin dominance is decreasing and altcoins dominance is started increasing , so look on all the altcoins
and follow proper risk management , it has very good chances to move UP side but first we have to protect the down side , where risk management comes into game .
Follow for more Ideas and potential coins/ Stocks .
KSM - 10 WEEKS STUCK IN NEUTRAL BOX🚨 ASX:KSM - Price Analysis: Neutral Stalemate - Bearish Test Incoming? 📉
Quick TA on - charts in limbo mode. 💡
Daily View:
🔸 Very neutral zone, price stuck under key resistances: $15.80 & $16.15. 🤝
🔸 Daily uptrend supporting prices, but buy volume is weak... No real firepower yet. 🐂💤
Expectations:
🔸 This feels like a bearish test. Next move? Possible correction to the $14.20-$14.00 demand zone.
🔸 Bulls need to smash above $16.15 (daily) to flip the script!
Weekly Tip:
🔸 Watch the bigger picture: 10 weeks of sideways action between $17.30 and $13.90 (closing).
🔸 Key signal? A weekly close above or below could trigger the next major move! ⚠️
Sum-Up:
Tough chart with heavy indecision.
My bias: Likely bearish. Stay alert! 👀
(DYOR, not advice!)
KSM Analysis (4H)Liquidity pools have accumulated at the top, and the price has hit an important supply zone.
Currently, the price is below the flip zone, and there are still untouched liquidity pools at the lower part of the chart. On our chart, we can also see bearish CHs.
The best zone to enter a sell/short position is the red-marked area.
The target can be the green-marked box.
A daily candle close above the invalidation level will invalidate this analysis.
For risk management, please don't forget stop loss and capital management
When we reach the first target, save some profit and then change the stop to entry
Comment if you have any questions
Thank You
KSM 1W chart has a Desending tringle pattern that has been broke#KSM 1W chart has a Desending tringle pattern that has been broken. 🔼🔼
#KMS Coin is currently forming a Descending Triangle pattern on the 3D chart.
👀 When the market reaches the $723 level, 👀 it shows a double bottom pattern. If it also breaks out, it can rise to $1060.🔼
💵 Tp 1 : $ 443
💵 Tp 2 : $ 499
💵 Tp 3 : $ 575
💵 Tp 4 : $ 723
💵 Tp 5 : $ 1060
KSM/USDT 15m CHART ANALYSIS.KSM/USDT – 15-Minute Chart Analysis
The market has shown a clear Change of Character (CHoCH), followed by a confirmed Break of Structure (BOS) to the downside, signaling a potential shift in market direction.
Currently, price is retracing and building liquidity below the Buy Side Liquidity (BSL) level.
Two well-defined Points of Interest (POIs) above serve as potential supply zones where smart money may look to execute sell orders.
A sweep of BSL followed by a rejection from either POI could offer a high-probability short entry, aligning with the bearish structure.
Maintain patience and wait for confirmation before execution.
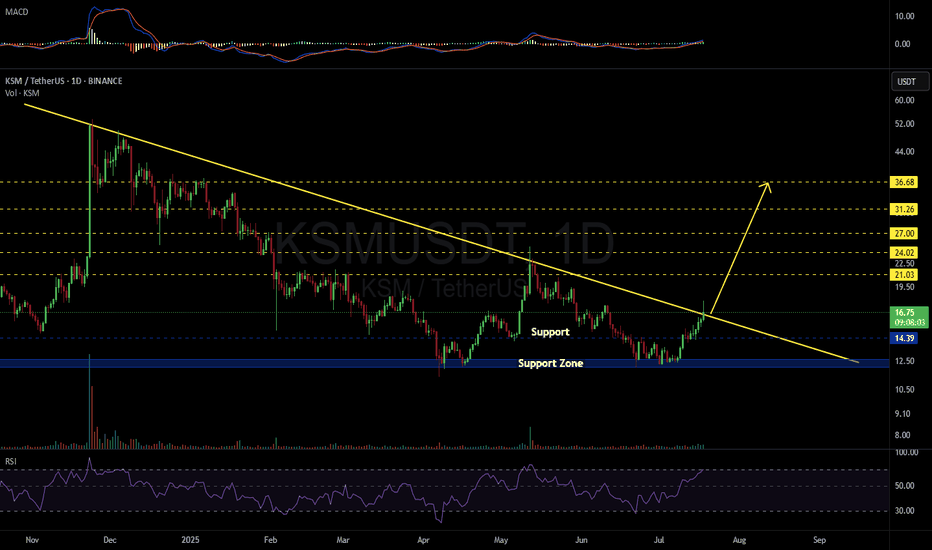
KSMUSDT 1D#KSM is on the verge of breaking out above the descending triangle resistance on the daily chart. Consider buying some #KSM here and near the support level at $14.39.
If a breakout occurs, the potential targets are:
🎯 $21.03
🎯 $24.02
🎯 $27.00
🎯 $31.26
🎯 $36.68
⚠️ Always use a tight stop-loss and apply proper risk management.
KSMUSDT D – Start of Wave 3? After a clear 5-wave impulsive move up, KSMUSDT seems to have completed a deep ABC correction, potentially marking the end of Wave 2.
📉 Wave 1: We had a clean five-wave move from the bottom, which fits classic Elliott Wave structure.
📉 Wave 2: The correction that followed was much deeper than the ideal Fibonacci retracement zone. However, crucially, it never violated the low of Wave 1, which means it still holds valid under Elliott Wave rules. The correction unfolded as a textbook ABC pattern, with Wave C digging deep into the previous structure — showing panic selloff and possibly a final capitulation.
🔄 Key Development Now:
The resistance trendline of the correction has just been broken, suggesting potential momentum shift. This could mark the beginning of Wave 3, which is typically the strongest and most impulsive wave in Elliott Wave theory.
📈 Potential Target for Wave 3: Around the 39.5.80–42.00 area based on Fibonacci projections, but this is an early assumption and requires confirmation by price action and volume.
⚠️ Important Risk Note:
Despite this bullish technical setup, the current market remains risky. The bounce is fresh, and confirmation is still lacking. There's still the possibility of a deeper retest or invalidation of this count if price closes below the base of Wave 1.
🧠 Trade Plan:
- Wait for follow-through confirmation.
- Manage risk carefully — this is an early entry scenario.
- A stop below the recent low (~11.30) would be logical for this wave count.
📊 What do you think? Is this the beginning of a powerful Wave 3, or just another fakeout?
💬 Drop your thoughts or alternate wave counts in the comments!
KSM/USDT Market OutlookKSM/USDT Market Outlook
KSM/USDT has confirmed a breakdown below the $16.40 level and is now consolidating within the $15.00 – $16.00 range.
We recommend waiting for a decisive move out of this zone
• A breakout above $16.00 may open up a long opportunity.
• A breakdown below $15.00 would likely present a stronger short setup, aligning with the current bearish structure.
🎖️
KSM Weekly Setup – Breakout Building or More Chop Ahead?🔥 KSM – Breakout or Retest?
🕰️ Weekly Chart: Still holding within a falling wedge—a bullish structure with breakout potential. 👀
📅 Daily Chart: Recently broke out of an ascending channel and is now retesting the support zone.
📍 Key Support: 19.8 – 21.17
📍 Resistance Zone: 23.3 – 26.9
⚡ A solid bounce from support could ignite the next leg higher. But if consolidation continues, expect more chop before a clear move.
Stay focused—this zone could decide the next trend!
KSM in a Accumulation Wyckoff EventKSM is ready to be bought.
Context:
PS—preliminary support, where substantial buying begins to provide pronounced support after a prolonged down-move. Volume increases and price spread widens, signaling that the down-move may be approaching its end.
SC—selling climax, the point at which widening spread and selling pressure usually climaxes, as heavy or panicky selling by the public is being absorbed by larger professional interests at or near a bottom. Often price will close well off the low in a SC, reflecting the buying by these large interests.
AR—automatic rally, which occurs because intense selling pressure has greatly diminished. A wave of buying easily pushes prices up; this is further fueled by short covering. The high of this rally will help define the upper boundary of an accumulation TR.
ST—secondary test, in which price revisits the area of the SC to test the supply/demand balance at these levels. If a bottom is to be confirmed, volume and price spread should be significantly diminished as the market approaches support in the area of the SC. It is common to have multiple STs after a SC.
Test—Large operators always test the market for supply throughout a TR (e.g., STs and springs) and at key points during a price advance. If considerable supply emerges on a test, the market is often not ready to be marked up. A spring is often followed by one or more tests; a successful test (indicating that further price increases will follow) typically makes a higher low on lesser volume.
SOS—sign of strength, a price advance on increasing spread and relatively higher volume. Often a SOS takes place after a spring, validating the analyst’s interpretation of that prior action.
LPS—last point of support, the low point of a reaction or pullback after a SOS. Backing up to an LPS means a pullback to support that was formerly resistance, on diminished spread and volume. On some charts, there may be more than one LPS, despite the ostensibly singular precision of this term.
BU—”back-up”. This term is short hand for a colorful metaphor coined by Robert Evans, one of the leading teachers of the Wyckoff method from the 1930s to the 1960s. Evans analogized the SOS to a “jump across the creek” of price resistance, and the “back up to the creek” represented both short-term profit-taking and a test for additional supply around the area of resistance. A back-up is a common structural element preceding a more substantial price mark-up, and can take on a variety of forms, including a simple pullback or a new TR at a higher level.
KSMa sleeping giant, which is totally oversold, so as i see it and did a visualization on how it must go next 10 days, i think we have 2 options, 1st to go as it is marked, and 2nd to make a pump 80-130%
this is not a financial advice, please trade cautiously.
spot trade
before enter always do your own research
good luck
Univers Of Signals | KSM : Accumulation or Breakdown Ahead?In this analysis, I want to review KSM for you. This project is one of the platforms within the Polkadot ecosystem and currently ranks 157th on CoinMarketCap with a market cap of $289 million.
📅 Weekly Timeframe
On the weekly timeframe, we observe a consolidation zone ranging from $15.36 to $55.85. The price has been fluctuating within this range for over two years. By comparing the weekly chart with Bitcoin’s chart, we can see that the KSM/BTC pair is in a downtrend, making it currently not a good buy against Bitcoin.
🔍 However, if we analyze this chart independently, if the price bounces off the $15.36 support and starts moving upward, we can consider buying if it breaks out of the upper box limit. In that case, we can confirm that this two-year range was an accumulation zone, leading to a long-term bullish trend.
📊 The buying volume within this range has been higher than selling volume, which can be a positive sign for buyers and increases the chances of an upward breakout. However, the bullish legs have been relatively short-lived, while the bearish legs have followed more technical and structured movements.
🚀 If the price breaks out of the range to the upside, the technical targets would be $177.68 and $530.43. This means a significant amount of capital would need to enter this coin, which seems unlikely at the moment.
❌ On the other hand, if the price breaks below the range, there will be no significant support left, and we will need to see where the new historical bottom forms.
📅 Daily Timeframe
On the daily timeframe, as you can see, the price failed to reach the upper boundary of the range at $60.88 during its last bullish leg and got rejected at $51.21, initiating its downtrend. The price has since moved within a descending channel, approaching the bottom of the range.
✅ Yesterday's candle was heavily rejected from the mid-line of the channel, engulfing all recent candles from the past few days. This indicates strong selling pressure, which could initiate a much deeper downtrend.
📉 If the price breaks below the channel, the downtrend momentum will intensify, potentially leading to a parabolic bearish move for KSM. The key trigger level for confirming a parabolic downtrend is $16.08, and if this level is breached, we can expect a new bearish phase.
🧩 However, if the price breaks above the channel, the current breakout trigger is $22.37. A break above this level could be a buy signal for a long position.
📝 Final Thoughts
This analysis reflects our opinions and is not financial advice.
Share your thoughts in the comments, and don’t forget to share this analysis with your friends! ❤️
TradeCityPro | KSM: Accumulation or Breakdown Ahead?👋 Welcome to TradeCity Pro!
In this analysis, I want to review KSM for you. This project is one of the platforms within the Polkadot ecosystem and currently ranks 157th on CoinMarketCap with a market cap of $289 million.
📅 Weekly Timeframe
On the weekly timeframe, we observe a consolidation zone ranging from $15.36 to $55.85. The price has been fluctuating within this range for over two years. By comparing the weekly chart with Bitcoin’s chart, we can see that the KSM/BTC pair is in a downtrend, making it currently not a good buy against Bitcoin.
🔍 However, if we analyze this chart independently, if the price bounces off the $15.36 support and starts moving upward, we can consider buying if it breaks out of the upper box limit. In that case, we can confirm that this two-year range was an accumulation zone, leading to a long-term bullish trend.
📊 The buying volume within this range has been higher than selling volume, which can be a positive sign for buyers and increases the chances of an upward breakout. However, the bullish legs have been relatively short-lived, while the bearish legs have followed more technical and structured movements.
🚀 If the price breaks out of the range to the upside, the technical targets would be $177.68 and $530.43. This means a significant amount of capital would need to enter this coin, which seems unlikely at the moment.
❌ On the other hand, if the price breaks below the range, there will be no significant support left, and we will need to see where the new historical bottom forms.
📅 Daily Timeframe
On the daily timeframe, as you can see, the price failed to reach the upper boundary of the range at $60.88 during its last bullish leg and got rejected at $51.21, initiating its downtrend. The price has since moved within a descending channel, approaching the bottom of the range.
✅ Yesterday's candle was heavily rejected from the mid-line of the channel, engulfing all recent candles from the past few days. This indicates strong selling pressure, which could initiate a much deeper downtrend.
📉 If the price breaks below the channel, the downtrend momentum will intensify, potentially leading to a parabolic bearish move for KSM. The key trigger level for confirming a parabolic downtrend is $16.08, and if this level is breached, we can expect a new bearish phase.
🧩 However, if the price breaks above the channel, the current breakout trigger is $22.37. A break above this level could be a buy signal for a long position.
📝 Final Thoughts
This analysis reflects our opinions and is not financial advice.
Share your thoughts in the comments, and don’t forget to share this analysis with your friends! ❤️


