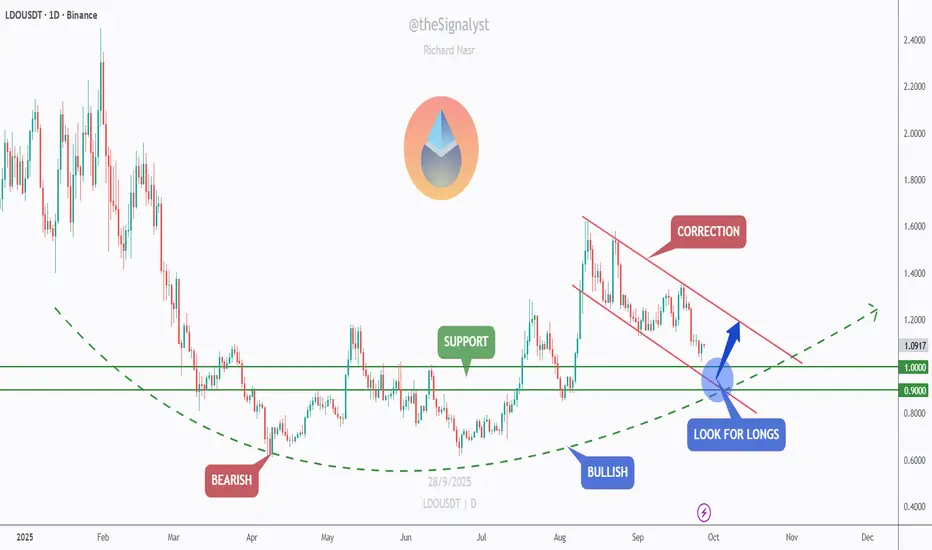
LDO – Waiting at the $1 ConfluenceLDO is overall bullish and currently in a correction phase inside a falling red channel. I’m waiting for price to reach the confluence of the support zone + round number $1.00 + lower red trendline. That intersection is where I’ll look for longs if we get a clear bullish reaction.
If we bounce: first targets $1.15–$1.20, then $1.30–$1.40 (channel top). A clean break/retest above $1.10 would add confirmation.
Invalidation: a daily close below $0.90 would put the setup on hold.
Does the $1 confluence hold and kick off the next leg up? 🤔
⚠️ Disclaimer: This is not financial advice. Always do your own research and manage risk properly.
📚 Stick to your trading plan regarding entries, risk, and management.
Good luck! 🍀
All Strategies Are Good; If Managed Properly!
~Richard Nasr
LDOUSDT.3S trade ideas
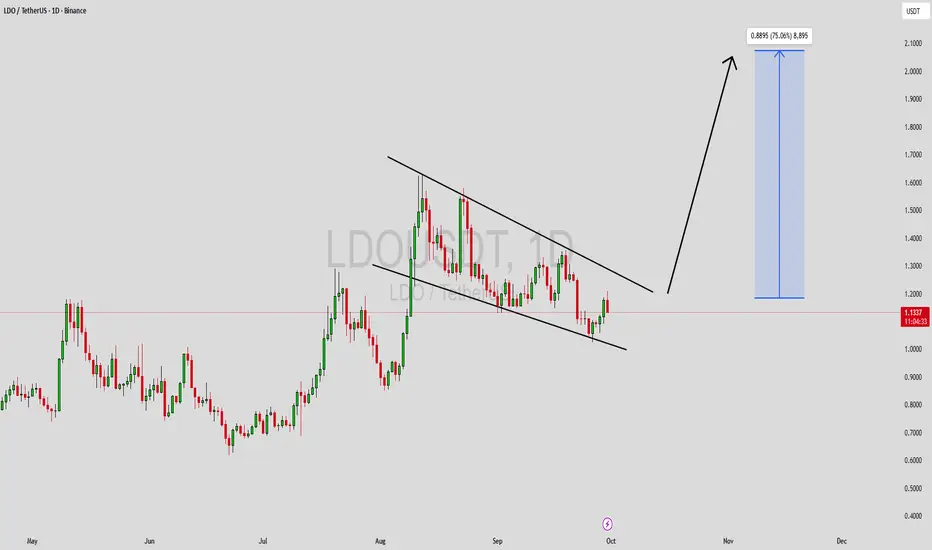
LDOUSDT Forming Falling WedgeLDOUSDT is currently shaping a falling wedge pattern, a classic bullish reversal signal in technical trading. This structure reflects consistent price compression with lower highs and lower lows, but the momentum of sellers is steadily weakening. When combined with strong volume, this setup becomes a high-probability breakout formation, pointing to a potential upside of 60% to 70%+ once resistance levels are cleared.
The falling wedge often precedes explosive breakouts as market participants recognize the shift in momentum. For LDOUSDT, a breakout confirmation above its upper trendline could trigger strong buying interest, inviting both short-term traders and long-term investors to enter positions. This could result in a sharp price acceleration toward higher resistance levels, fueling a sustained bullish trend.
Investor attention toward this project is also on the rise, strengthening the fundamentals behind the technical setup. The combination of favorable sentiment, healthy trading activity, and clear chart structure makes LDOUSDT an attractive opportunity for those seeking strong risk-to-reward trades in the current market environment.
✅ Show your support by hitting the like button and
✅ Leaving a comment below! (What is You opinion about this Coin)
Your feedback and engagement keep me inspired to share more insightful market analysis with you!
Here is the good long opportunity 👉The price has perfectly bounced from the trend line and has now broken out of the key $0.17 resistance area. From here, I expect a new bullish move and a breakout from the bull flag toward a 1.4$, 1.63$, 1.8$, Here a is the good area to enter this position

#LDO/USDT — Critical Retest at Demand Zone vs Long-Term Downtre#LDO
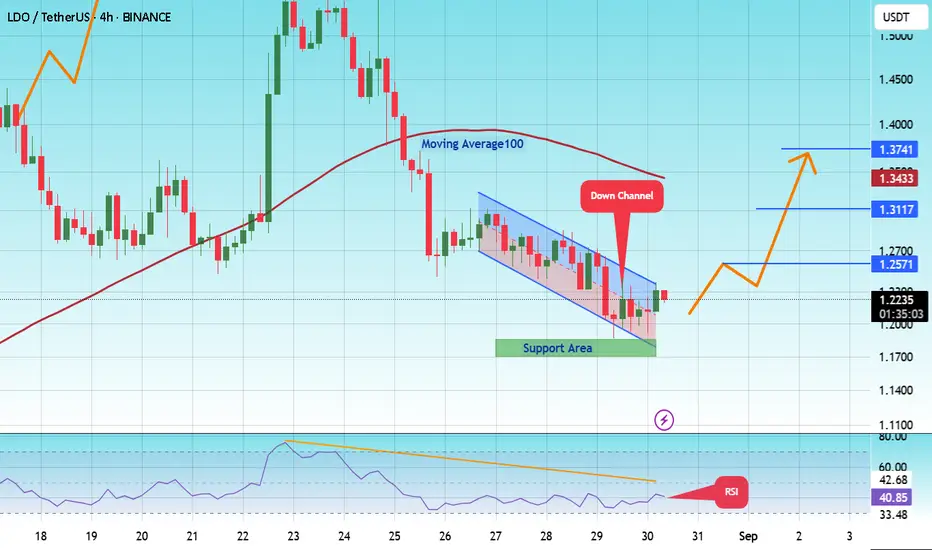
The price is moving within a descending channel on the 1-hour frame, adhering well to it, and is heading for a strong breakout and retest.
We have a bearish trend on the RSI indicator that is about to be broken and retested, which supports the upward breakout.
There is a major support area in green at 1.04, representing a strong support point.
We are heading for consolidation above the 100 moving average.
Entry price: 1.10
First target: 1.14
Second target: 1.20
Third target: 1.27
Don't forget a simple matter: capital management.
When you reach the first target, save some money and then change your stop-loss order to an entry order.
For inquiries, please leave a comment.
Thank you.

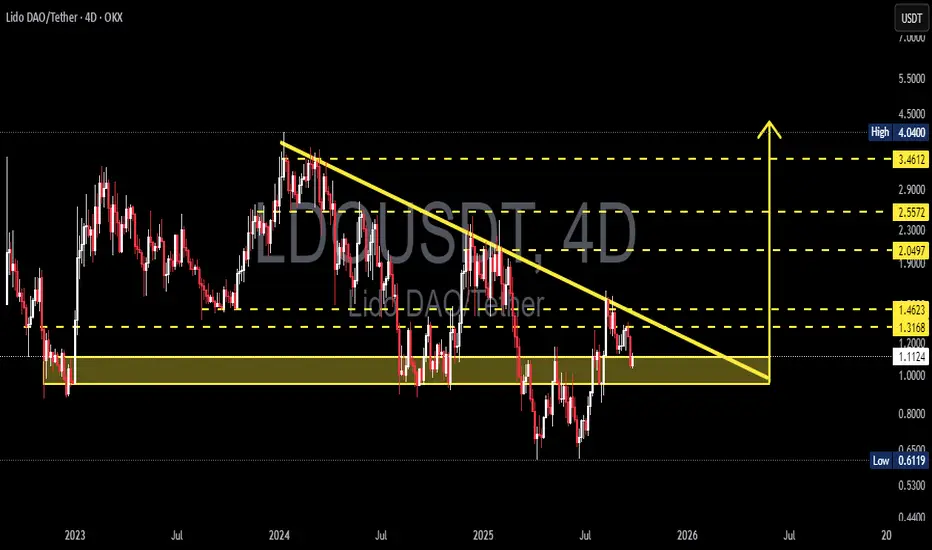
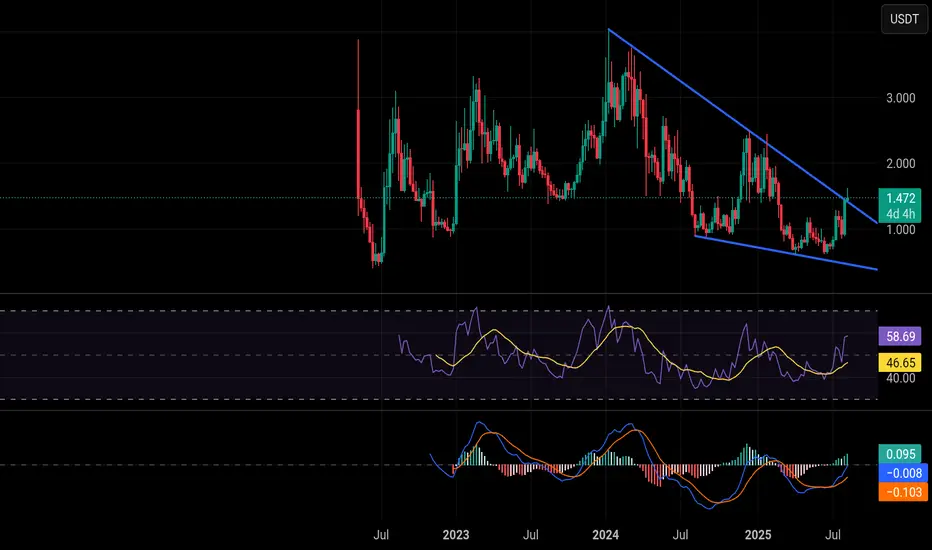
LDOUSDT — Critical Retest at Demand Zone vs Long-Term Downtren!Lido DAO (LDO) is currently sitting at a make-or-break level. The chart shows price being squeezed between a long-term descending trendline from the 2023–2024 highs and a strong demand zone around $1.00–1.12. This setup signals a major decision point: either a bullish reversal is about to begin, or bearish continuation will take over.
---
🔎 Key Technical Structure
Descending Trendline: consistent lower-highs pressuring every bounce → sellers still in control on the bigger picture.
Demand Zone $1.00–1.12: highlighted in yellow, repeatedly acting as strong support → buyers are defending aggressively.
Support vs Resistance Clash: the meeting point of horizontal demand and the trendline creates a descending triangle-like structure. Typically bearish, but if demand holds, it could trigger a powerful reversal breakout.
---
🚀 Bullish Scenario
Confirmation: 4D close above the trendline and $1.46.
Upside targets:
$2.05 (Target 1, key resistance)
$2.55 (Target 2, prior supply area)
$3.46 (Target 3, major resistance)
Potential upside: +80% to +210% from current levels if breakout is strong.
---
🔻 Bearish Scenario
Confirmation: 4D close below $1.00 support.
Downside target: retest of structural low at $0.61.
Potential downside: about -45% from current levels.
---
⚖️ Conclusion
LDO is at a critical decision zone:
Break above $1.46 → opens the door to $2–3+ rally.
Breakdown below $1.00 → likely continuation toward $0.61.
For swing traders, this is a moment to wait for confirmation before committing to a major position. This demand zone could be the foundation for accumulation or the beginning of deeper downside.
---
📢 Note
Always wait for candle close (4D/1W) + volume confirmation before entering. This analysis is for educational purposes only — not financial advice.
---
#LDO #LDOUSDT #LidoDAO #DeFi #Crypto #TechnicalAnalysis #Breakout #SupportResistance #SwingTrade
A Bullish Opportunity for Lido DaoThe price of Lido DAO (LDO) is at a critical point right now, according to technical analysis on the weekly timescale. It is testing the Double Bottom pattern's neckline around US$1.1108 and is also making an effort to break through the 8-EMA resistance at US$1.1957. The price has a broad range of potential for upward movement if it can effectively break out of the 8-EMA level and reject the neckline without dropping below the bullish trendline that supports it. The initial objective is about US$1.5683, and a more optimistic target is around US$2.1888.

LDOUSDT UPDATE#LDO
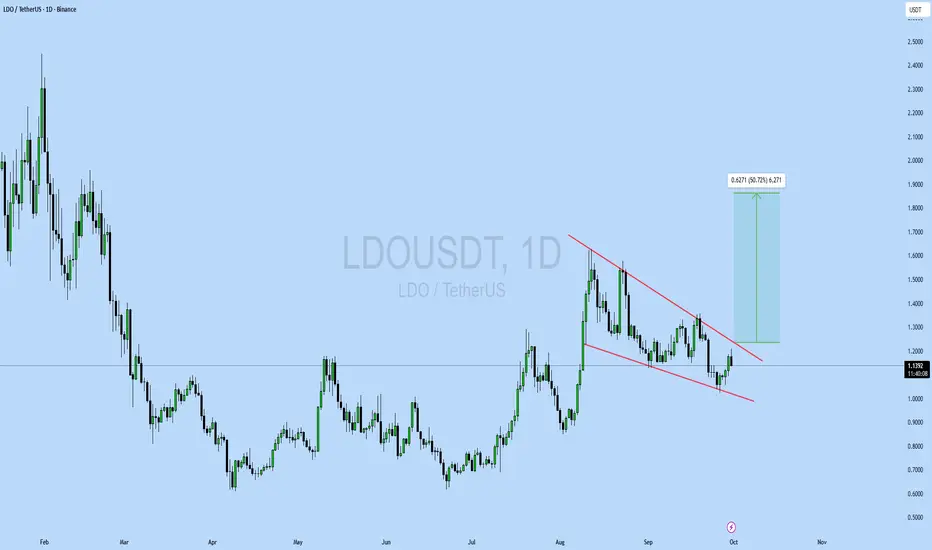
UPDATE
LDO Technical Setup
Pattern: Bullish falling wedge breakout
Current Price: $1.138
Target Price: $1.76
Target % Gain: 50.72%
LDO is breaking out of a falling wedge on the 1D timeframe, signaling a bullish reversal with upside potential toward $1.76. Momentum favors continuation if buyers sustain pressure. Always use proper risk management.
#LDO/USDT#LDO
The price is moving within a descending channel on the 1-hour frame and is expected to break and continue upward.
We have a trend to stabilize above the 100 moving average once again.
We have a downtrend on the RSI indicator that supports the upward move with a breakout.
We have a support area at the lower boundary of the channel at 1.18, acting as strong support from which the price can rebound.
We have a major support area in green that pushed the price upward at 1.17.
Entry price: 1.22.
First target: 1.57.
Second target: 1.31.
Third target: 1.37.
To manage risk, don't forget stop loss and capital management.
When you reach the first target, save some profits and then change the stop order to an entry order.
For inquiries, please comment.
Thank you.
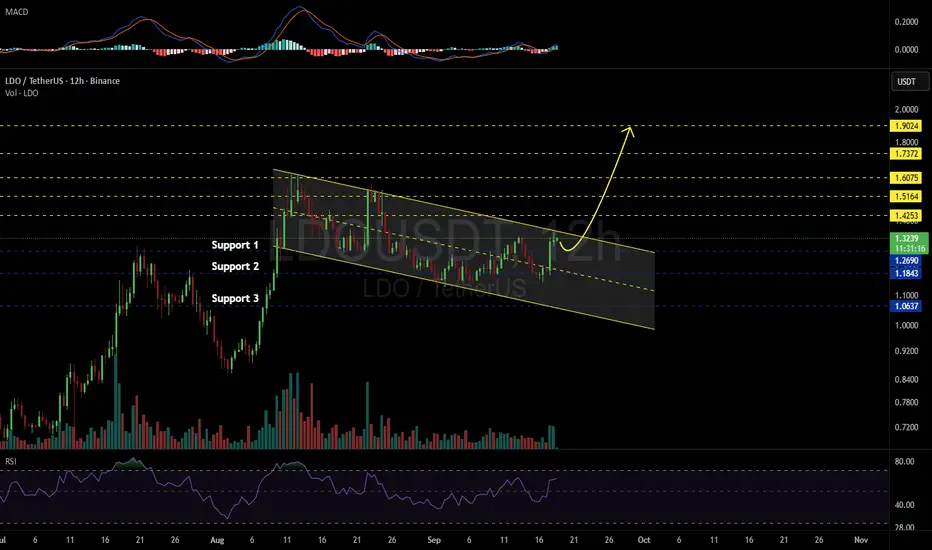
LDOUSDT 12H#LDO is moving inside a bullish flag pattern on the 12H timeframe. Consider buying here at the current price and near the support levels of:
🛡$1.2690
🛡$1.1843
🛡$1.0637
In case of a breakout above the flag resistance, the potential targets are:
🎯 $1.4253
🎯 $1.5164
🎯 $1.6075
🎯 $1.7372
🎯 $1.9024
⚠️ Always remember to use a tight stop-loss and follow proper risk management.
LDO About to start a new bullish move👉 A bullish flag has formed on the chart, and the price has perfectly bounced from the $1.15 support area. From here, I expect a new bullish rally and a breakout above the trend line toward a 1.32$, 1.43$, 1.63$ And 1.76$ as a next targets

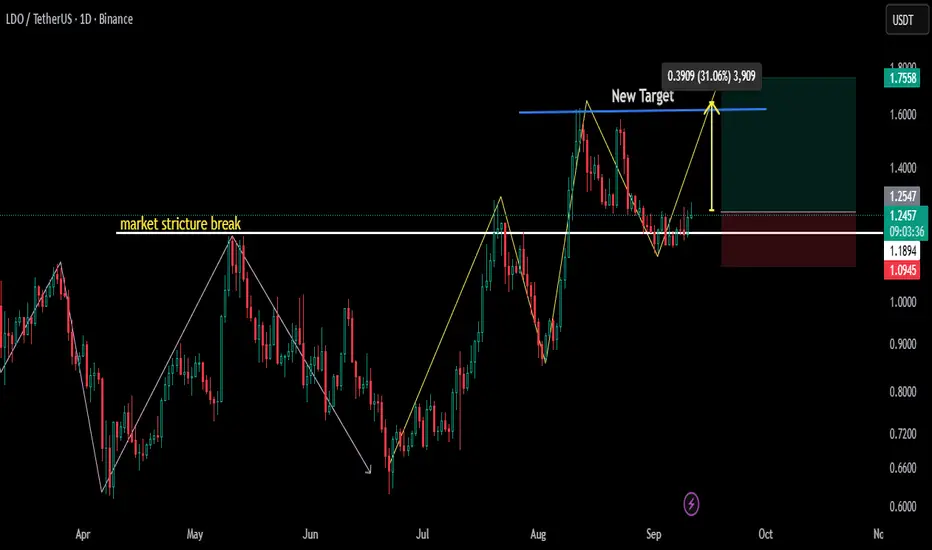
Market Structure Breaks LDOUSDT 1Day charts time for bullsPreviously market are in down trend in daily charts lower highs and lower lows now market structure breaks and time for uptrend ..
STOPLOSS .. Below higher low
PAIR... LDOUSDT
TREND,, Market structure Breaks
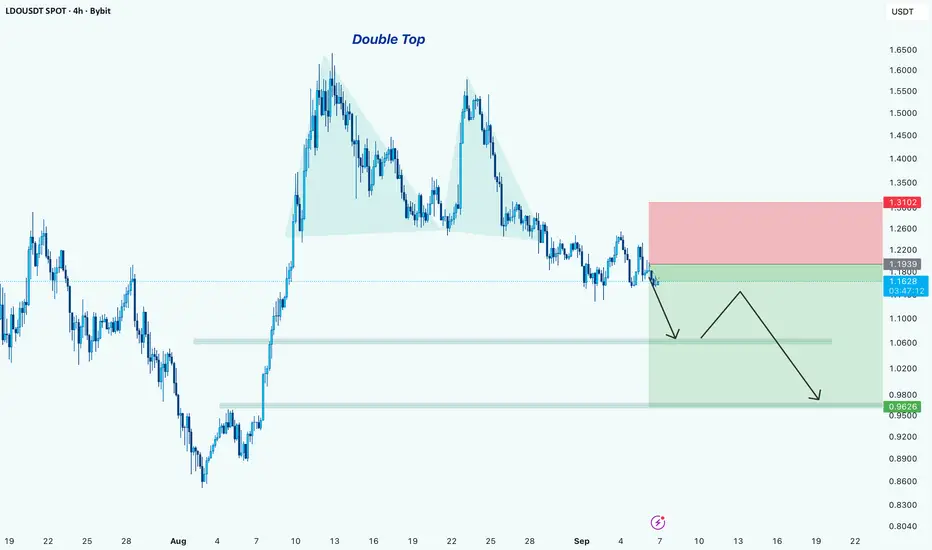
LDO/USDT –> Double Top Formation Signals Bearish PressureHello guys!
Lido DAO (LDO) has printed a clear double top pattern on the 4H chart.
After failing to break above the $1.65 area twice, price is now trading below the neckline zone and struggling to regain bullish strength.
If sellers remain in control, the next major support lies around $1.05 – $1.07 , followed by a deeper downside target near $0.95 – $0.98 . These levels align with previous demand zones and could act as take-profit areas for shorts.
On the flip side, invalidation comes if price reclaims $1.31 – $1.32 (stop zone), which would weaken the double top structure and potentially reopen bullish momentum.
For now, the structure favors bears, and continuation lower seems likely unless bulls step in with strong volume.
LDO over sold and still sellingsame situation with LDO with the same set up
publishing these ideas to show how market specially alt coins move in the same range

TradeCityPro | LDOUSDT The Best Spot Entry Point👋 Welcome to TradeCityPro Channel!
Let's move on to the LDO analysis, which has the most Ethereum possible in this staking network, and its job is to form nodes and structure transactions, and it has solved the problem of having 32 Ethereum to be a validator.
🌐 Overview of Bitcoin
Before starting the analysis, let me remind you again that we moved the Bitcoin analysis section out of this part and made it a separate daily analysis as per your request, so we can discuss Bitcoin’s condition in more detail and analyze its charts and dominance separately.
This is the general Bitcoin dominance analysis that we promised to cover separately and analyze in longer time frames:
🔗
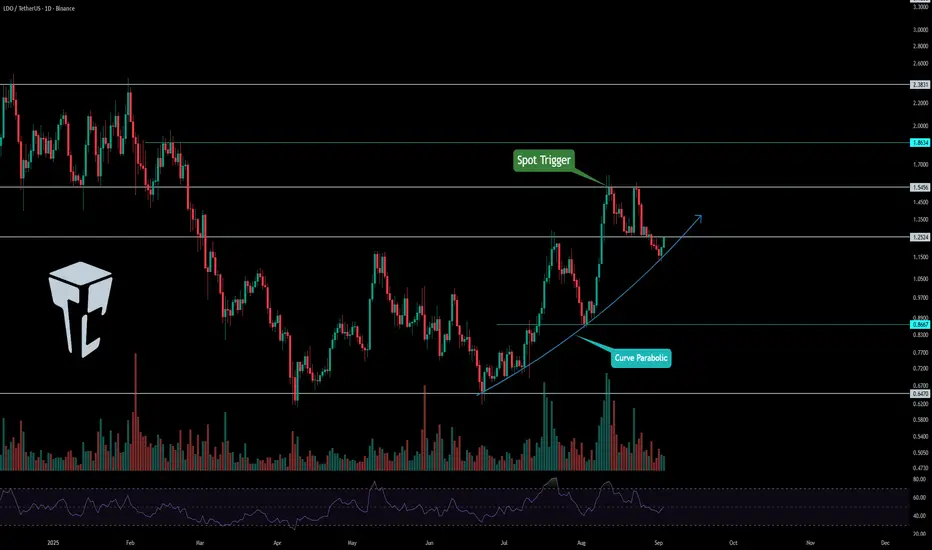
📊 Weekly Timeframe
After the previous decline, LDO reached the important weekly support at 0.647 and showed a reaction.
With buyer presence, the price moved upward and is now sitting right under a resistance that once acted as a strong support. After breaking that level in the past, the price made a sharp move which makes this an important zone to watch.
🔗
📊 Daily Timeframe
On the daily chart, after bouncing from the 0.647 support area, LDO built a new structure.
Gradually, this move formed into a parabolic curve where every bounce from it triggered sharp upward movements.
For a spot buy entry, a risky strategy would be to buy on this curve reaction with a wide stop-loss (e.g., 0.8667).
However, I personally prefer waiting for the breakout of 1.5450, since that will allow me to set a tighter stop-loss and manage my capital more effectively, enabling me to take on higher risk within my risk management rules.
📝 Final Thoughts
Stay calm, trade wisely, and let's capture the market's best opportunities!
This analysis reflects our opinions and is not financial advice.
Share your thoughts in the comments, and don’t forget to share this analysis with your friends! ❤️
LDOUSDT UPDATE#LDO
UPDATE
LDO Technical Setup
Pattern : Falling Wedge Pattern
Current Price: $1.236
Target Price: $1.99
Target % Gain: 68.22%
Technical Analysis: LDO has broken out of a falling wedge on the 1D chart and is retesting the breakout zone with support from the purple demand area. Volume shows strength, and if price holds above $1.20, continuation toward $1.99 is likely.
Time Frame: 1D
Risk Management Tip: Always use proper risk management.

LDO/USDT – Key Support Retest & Possible Reversal SetupLDO has come back to retest the 1.25–1.27 demand zone, which acted as a strong support level in the past. This zone has historically triggered bullish momentum whenever defended successfully.
Analysis & Structure
Price recently retraced from its highs and is now testing the previous accumulation zone.
Buyers seem to be defending the 1.25–1.27 support (purple rectangle).
If this support holds, LDO could bounce towards higher resistance levels.
A breakdown below 1.25, however, would invalidate this setup and open the path to further downside.
Trade Plan
Entry Zone: 1.25–1.27 (support retest)
Stop Loss: Below 1.25 (invalidates the bullish structure)
Targets: 1.44, 1.60, 1.81, 2.01
Trading Insight
This is a risk-reward favorable setup if the support zone holds. Patience is key here – confirmation on higher timeframes is recommended before entering.
DYOR | Not Financial Advice
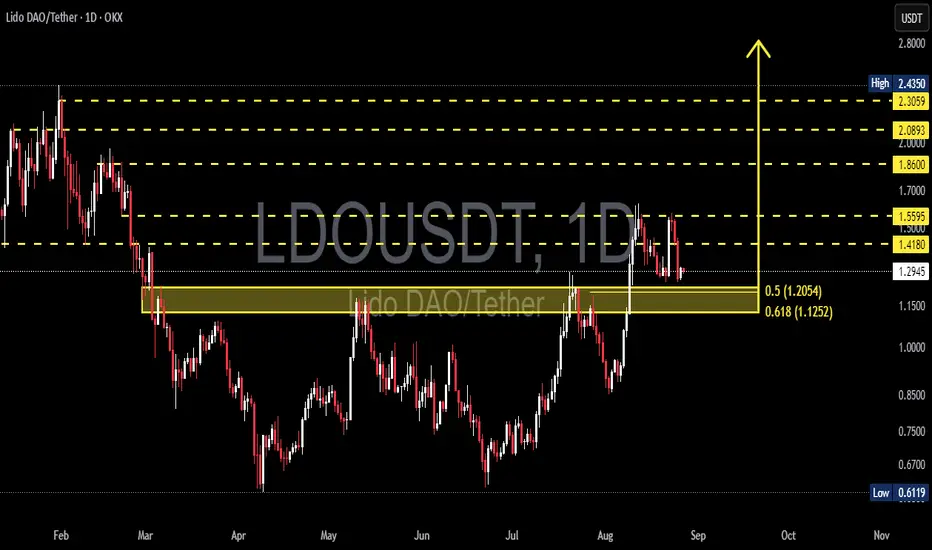
LDO/USDT — Breakout, Retest, and the Critical Demand Zone!🔎 Market Structure
LDO price is currently hovering around 1.29 USDT after breaking out of a long accumulation phase from the 0.61 low. Technically, the market has just made a significant breakout, but is now undergoing a healthy pullback to retest a key demand zone.
The 1.205 – 1.125 zone is the main focus because:
It aligns with the Fibonacci retracement 0.5 & 0.618, also known as the “golden zone.”
Acts as a flip zone (previous resistance → potential support/demand).
If this zone holds, LDO may continue its bullish momentum with higher upside targets.
---
🟢 Bullish Scenario
As long as price holds above 1.205 – 1.125, bullish momentum remains valid.
Long lower wicks at this demand area may indicate buyer absorption/accumulation.
Upside targets if demand holds:
1.418 → 1.5595 → 1.86 → 2.0893 → 2.3059 → 2.4350 (high from the chart).
A confirmed daily close above 1.418 would strengthen the bullish outlook.
📌 Strategy: Accumulate around 1.20–1.12 or wait for breakout confirmation above 1.418. Stop-loss below 1.10. Mid-term targets 1.55–1.86; long-term extension up to 2.30–2.43.
---
🔴 Bearish Scenario
If price closes daily below 1.125, the demand zone fails to hold.
This could trigger a deeper correction towards 0.85, and in extension, back to the 0.61 low.
A breakdown of such a strong demand zone usually accelerates selling pressure.
📌 Strategy: Short entries only valid if daily close confirms below 1.125 with strong volume. Downside targets: 0.85 → 0.61. Stop-loss above 1.25.
---
📈 Pattern & Sentiment
Key pattern: Breakout from accumulation + retest of golden zone.
Sentiment: Neutral–bullish as long as demand zone holds. Watch out for liquidity sweeps below 1.125.
Volume: Bullish confirmation requires increasing buy volume on rebounds.
---
✅ Conclusion
Bullish case: Holding the 1.205–1.125 golden zone → continuation towards 1.418–1.5595 and higher levels.
Bearish case: Daily close below 1.125 → deeper correction to 0.85–0.61.
LDO is at a critical decision point: continuation of the uptrend or rejection into a broader correction.
#LDO #LDOUSDT #Lido #CryptoAnalysis #Altcoin #Fibonacci #Breakout #SwingTrade #CryptoSignals
LDO Market Update📉 MIL:LDO Market Update
Today, MIL:LDO is under selling pressure ❌
Price has broken down the blue support level 🔵, showing sellers are in control.
The potential play:
🔹 Next, watch the green support zone 🟢 — this is where price could potentially bounce back up if buyers step in.
🔹 Always wait for confirmation before entering long — catching a falling price without support validation is risky.

LDO Market Update📈 MIL:LDO Market Update
MIL:LDO has broken out of the red resistance zone, which has now turned into support 🔴➡️🟢
Currently, price is showing signs of retracing.
The potential play:
🔹 If price pulls back to the green zone, this area could provide a potential long entry, since previous strong buyers accumulated there.
🔹 With confirmation, this level may trigger the next bullish push upward 🎯
⚠️ Always wait for confirmation before entering — patience equals profits.

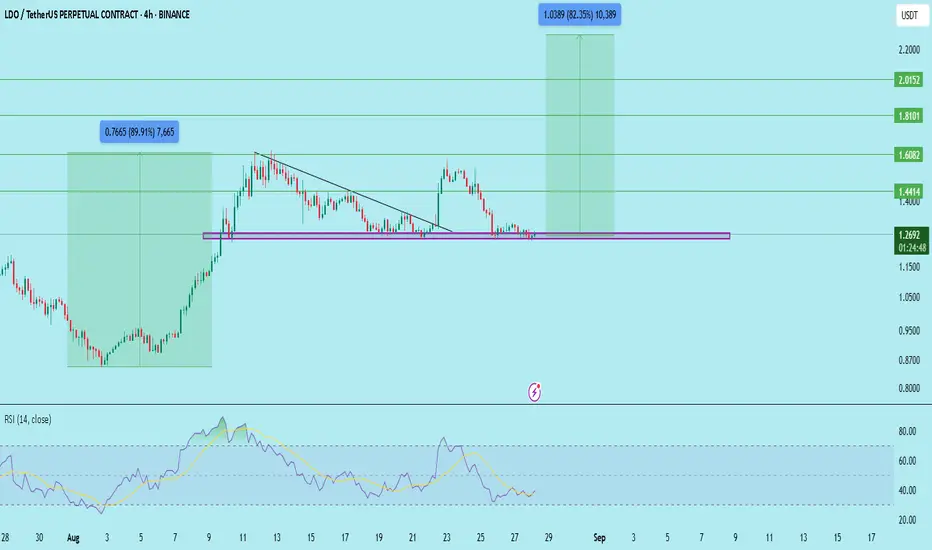
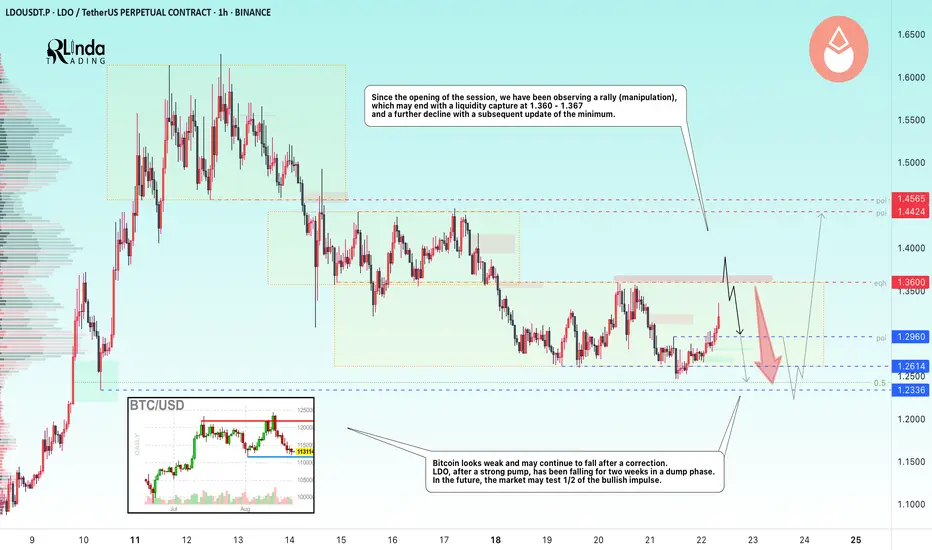
LDOUSDT → Hunting for liquidity ahead of a declineBINANCE:LDOUSDT.P , having failed to reach the zone of interest 1.250 - 1.233, has entered a phase of local rally or manipulation before a possible decline aimed at consolidating potential before long-term growth.
Bitcoin looks weak and, after a correction, may continue to fall to the coveted target of 112 - 110K. After a strong pump, LDO has been falling for two weeks in a dump phase. In the long term, the market may test 1/2 of the bullish momentum and the strong support level of 1.179 before resuming the pump to 1.62 - 1.97.
Since the opening of the session, we have been observing manipulation, the goal of which is most likely the liquidity zone of 1.36 - 1.36. The situation may end with a liquidity grab, a false breakout, and a further decline with a subsequent update of the low.
Resistance levels: 1.36, 1.37, 1.44
Support levels: 1.296, 1.2614, 1.2336
Technically, the price is still consolidating and intrarange trading is likely to continue. A false breakout of resistance could trigger a decline, in which case 1.26 - 1.23 could be considered a target, while a false break of 1.17 - 1.23 could trigger a global rise.
Best regards, R. Linda!
#LDO/USDT | Flipped Longe Term Resistance#LDO
The price is moving within an ascending channel on the 1-hour frame, adhering well to it, and is on its way to breaking strongly upwards and retesting it.
We have support from the lower boundary of the ascending channel, at 1.31.
We have a downtrend on the RSI that is about to be broken and retested, supporting the upside.
There is a major support area in green at 1.28, which represents a strong basis for the upside.
Don't forget a simple thing: ease and capital.
When you reach the first target, save some money and then change your stop-loss order to an entry order.
For inquiries, please leave a comment.
We have a trend to hold above the 100 Moving Average.
Entry price: 1.42.
First target: 1.48.
Second target: 1.55.
Third target: 1.63.
Don't forget a simple thing: ease and capital.
When you reach your first target, save some money and then change your stop-loss order to an entry order.
For inquiries, please leave a comment.
Thank you.

LDOUSDT LongHi everyone, here is a tradeable opportunity , this pair broke through the trendline and is trading above it, should it consolidate above it, look to long it.
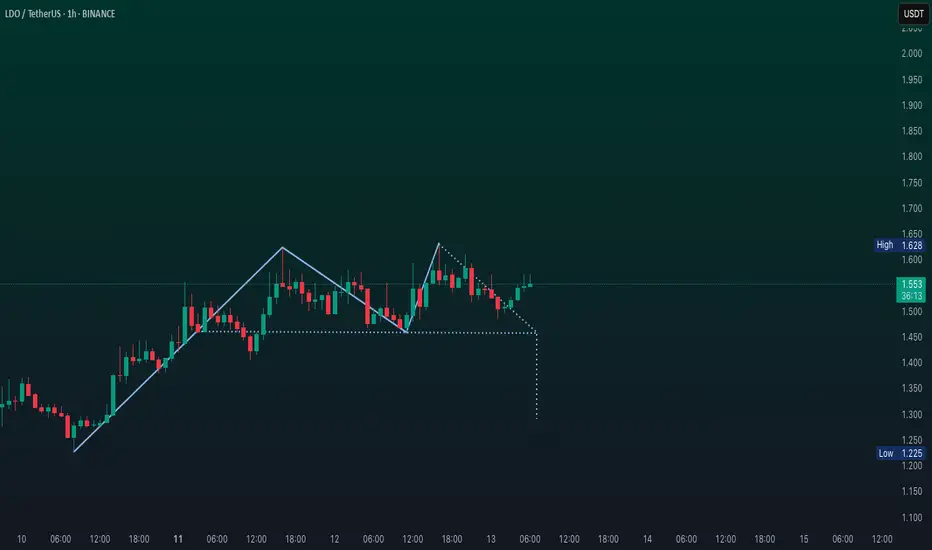
Lido DAO ($LDO) hourly chart shows a TD Sequential sell signal. Lido DAO ( MIL:LDO ) hourly chart shows a TD Sequential sell signal.
Monitor $1.45 support; a drop below could target $1.30 or $1.20.
LDO gained 4.27% in the last 24 hours, surpassing the crypto market’s 2.22% rise, after a 70% weekly jump.
Key factors:
Record TVL & Holding: Lido’s TVL reached $38.17B, with $1.71M net outflows reflecting strong accumulation.
Ethereum’s Surge: CRYPTOCAP:ETH approaching $4,500 boosts MIL:LDO , the top liquid staking protocol. .