LDOUSDT Forming Falling WedgeLDOUSDT is currently shaping a falling wedge pattern, a classic bullish reversal signal in technical trading. This structure reflects consistent price compression with lower highs and lower lows, but the momentum of sellers is steadily weakening. When combined with strong volume, this setup becomes
Related pairs
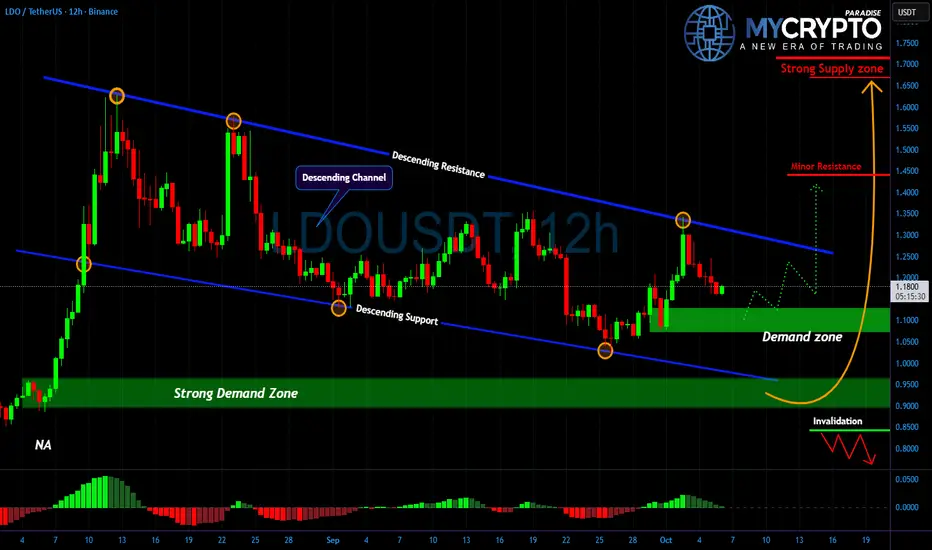
LDO Is Coiling for a Massive Move — But Will It Be Up or Down?
Yello Paradisers, are you ready for what could be one of #LDO’s most explosive reversal plays of Q4? After weeks of tight compression inside a well-defined descending channel, price action is now approaching a make-or-break demand zone and what happens next could define LDO’s direction for the rest
Here is the good long opportunity 👉The price has perfectly bounced from the trend line and has now broken out of the key $0.17 resistance area. From here, I expect a new bullish move and a breakout from the bull flag toward a 1.4$, 1.63$, 1.8$, Here a is the good area to enter this position

#LDO/USDT — Critical Retest at Demand Zone vs Long-Term Downtre#LDO
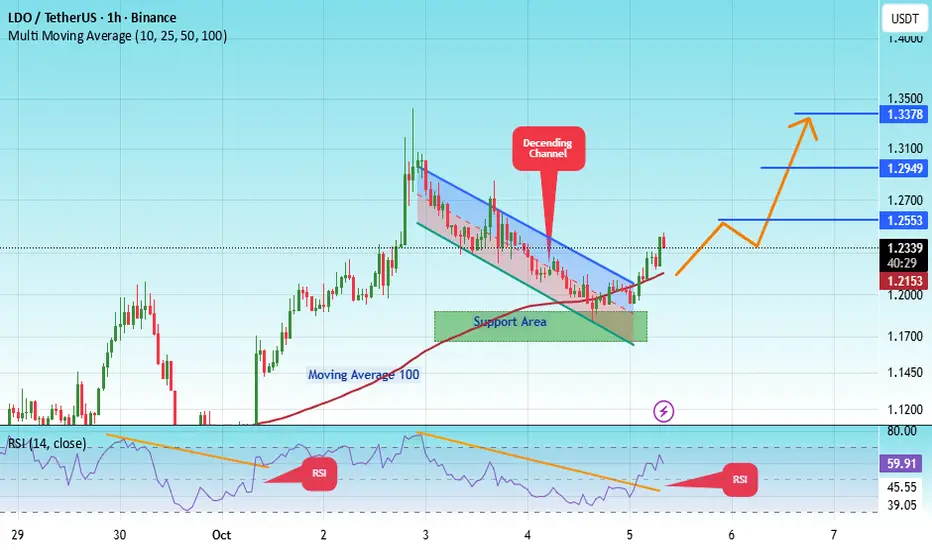
The price is moving within a descending channel on the 1-hour frame, adhering well to it, and is heading for a strong breakout and retest.
We have a bearish trend on the RSI indicator that is about to be broken and retested, which supports the upward breakout.
There is a major support area i

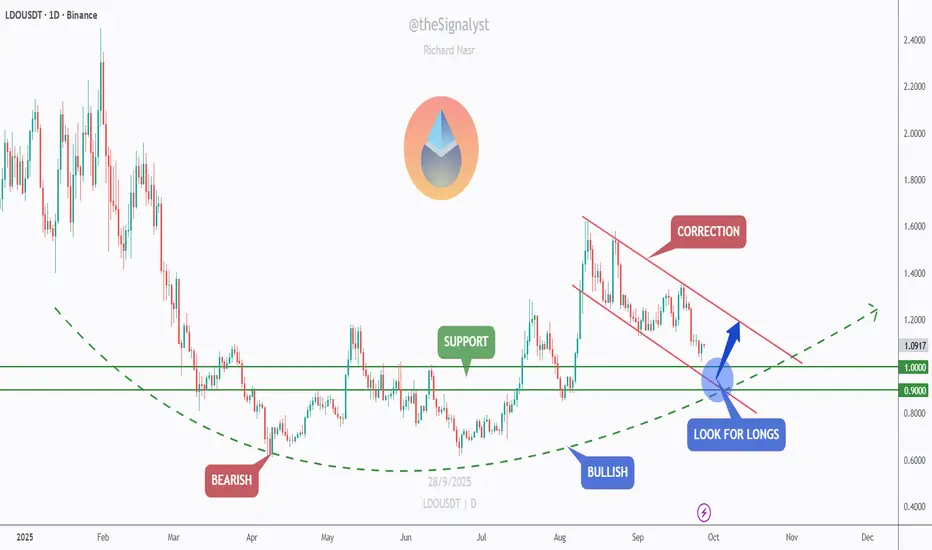
LDO – Waiting at the $1 ConfluenceLDO is overall bullish and currently in a correction phase inside a falling red channel. I’m waiting for price to reach the confluence of the support zone + round number $1.00 + lower red trendline. That intersection is where I’ll look for longs if we get a clear bullish reaction.
If we bounce:
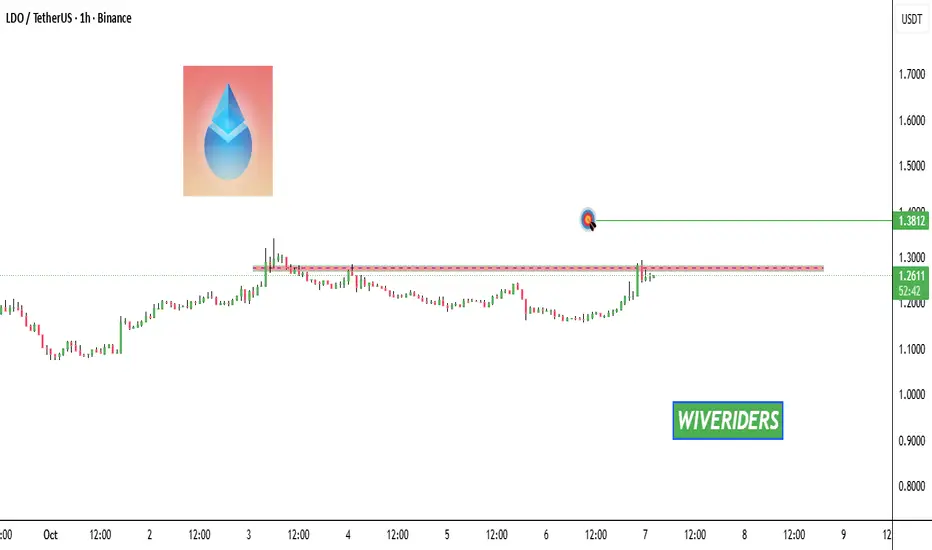
LDO Update📊 LDO Update
LDO is testing the red resistance zone — watch closely 👀
If it breaks out, the first target will be the green line level 🚀
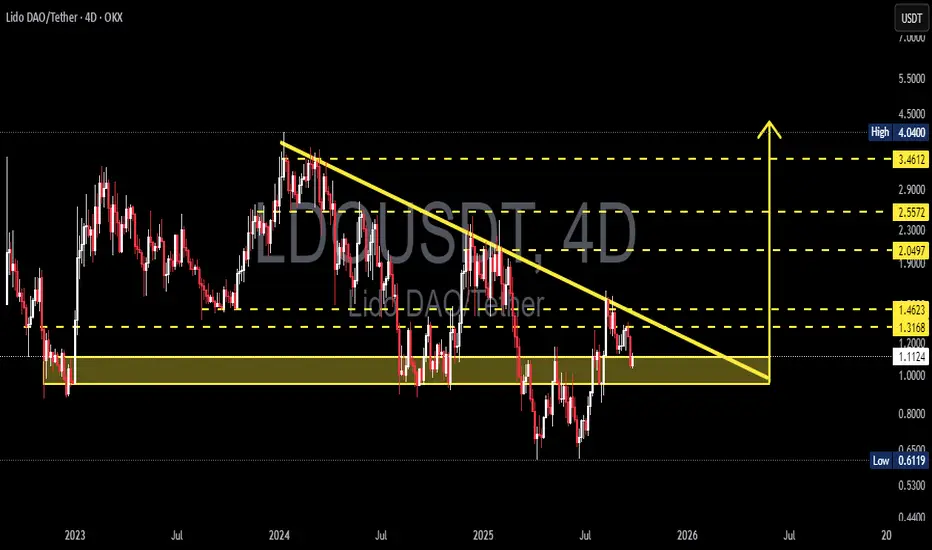
LDOUSDT — Critical Retest at Demand Zone vs Long-Term Downtren!Lido DAO (LDO) is currently sitting at a make-or-break level. The chart shows price being squeezed between a long-term descending trendline from the 2023–2024 highs and a strong demand zone around $1.00–1.12. This setup signals a major decision point: either a bullish reversal is about to begin, or
#LDOUSDT Analysis — Pullback Before Bullish Continuation
#LDO
The price is moving within a descending channel on the 1-hour frame, adhering well to it, and is heading for a strong breakout and retest.
We have a bearish trend on the RSI indicator that is about to be broken and retested, which supports the upward breakout.
There is a major support are
A Bullish Opportunity for Lido DaoThe price of Lido DAO (LDO) is at a critical point right now, according to technical analysis on the weekly timescale. It is testing the Double Bottom pattern's neckline around US$1.1108 and is also making an effort to break through the 8-EMA resistance at US$1.1957. The price has a broad range of

LDOUSDT UPDATE#LDO
UPDATE
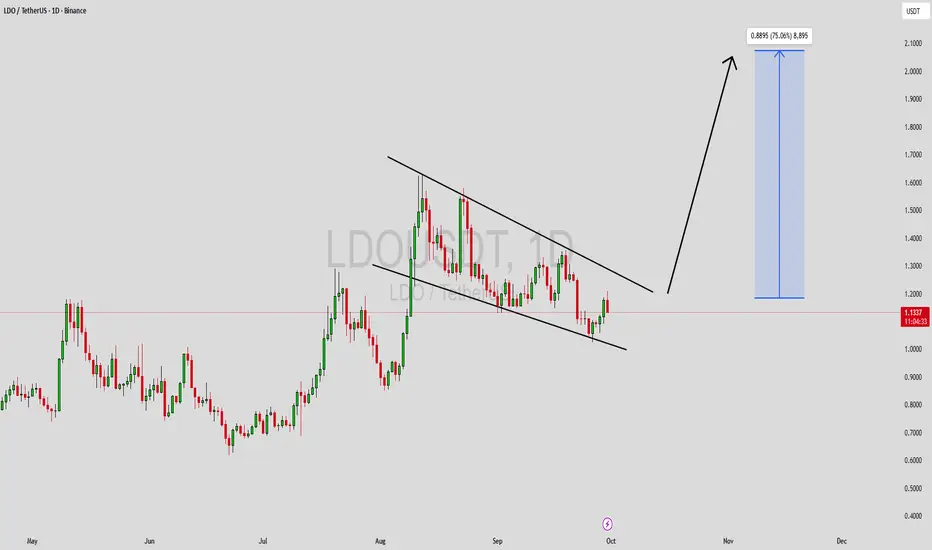
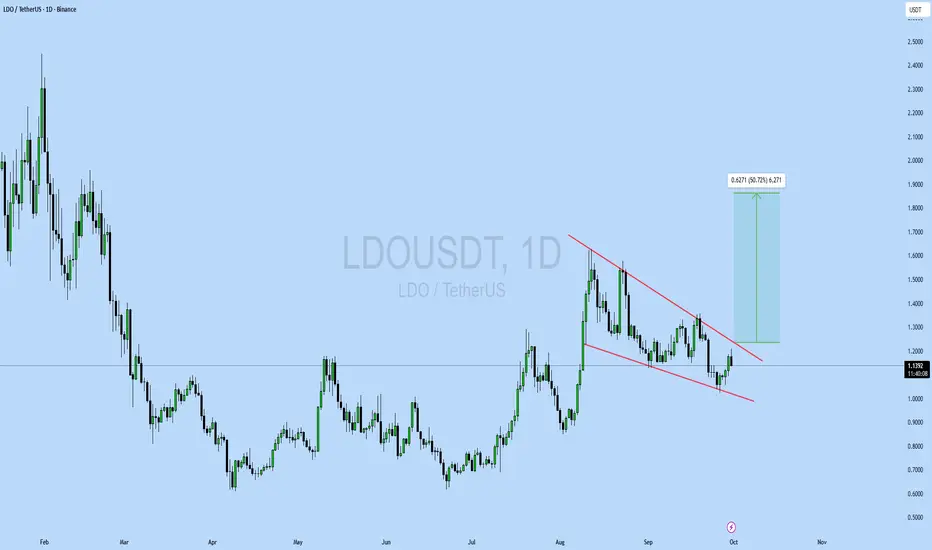
LDO Technical Setup
Pattern: Bullish falling wedge breakout
Current Price: $1.138
Target Price: $1.76
Target % Gain: 50.72%
LDO is breaking out of a falling wedge on the 1D timeframe, signaling a bullish reversal with upside potential toward $1.76. Momentum favors continuation if buy
See all ideas
Summarizing what the indicators are suggesting.
Oscillators
Neutral
SellBuy
Strong sellStrong buy
Strong sellSellNeutralBuyStrong buy
Oscillators
Neutral
SellBuy
Strong sellStrong buy
Strong sellSellNeutralBuyStrong buy
Summary
Neutral
SellBuy
Strong sellStrong buy
Strong sellSellNeutralBuyStrong buy
Summary
Neutral
SellBuy
Strong sellStrong buy
Strong sellSellNeutralBuyStrong buy
Summary
Neutral
SellBuy
Strong sellStrong buy
Strong sellSellNeutralBuyStrong buy
Moving Averages
Neutral
SellBuy
Strong sellStrong buy
Strong sellSellNeutralBuyStrong buy
Moving Averages
Neutral
SellBuy
Strong sellStrong buy
Strong sellSellNeutralBuyStrong buy
Displays a symbol's price movements over previous years to identify recurring trends.
Curated watchlists where LDOUST is featured.

Up-and-coming crypto: New kids on the block
30 No. of Symbols
See all sparks
Frequently Asked Questions
The current price of LDO / UST (LDO) is 1.25370000 USDT — it has risen 7.74% in the past 24 hours. Try placing this info into the context by checking out what coins are also gaining and losing at the moment and seeing LDO price chart.
LDO / UST price has risen by 12.95% over the last week, its month performance shows a 6.42% increase, and as for the last year, LDO / UST has increased by 15.52%. See more dynamics on LDO price chart.
Keep track of coins' changes with our Crypto Coins Heatmap.
Keep track of coins' changes with our Crypto Coins Heatmap.
LDO / UST (LDO) reached its highest price on Jan 9, 2024 — it amounted to 4.39980000 USDT. Find more insights on the LDO price chart.
See the list of crypto gainers and choose what best fits your strategy.
See the list of crypto gainers and choose what best fits your strategy.
LDO / UST (LDO) reached the lowest price of 0.62000000 USDT on Apr 8, 2025. View more LDO / UST dynamics on the price chart.
See the list of crypto losers to find unexpected opportunities.
See the list of crypto losers to find unexpected opportunities.
The safest choice when buying LDO is to go to a well-known crypto exchange. Some of the popular names are Binance, Coinbase, Kraken. But you'll have to find a reliable broker and create an account first. You can trade LDO right from TradingView charts — just choose a broker and connect to your account.
Crypto markets are famous for their volatility, so one should study all the available stats before adding crypto assets to their portfolio. Very often it's technical analysis that comes in handy. We prepared technical ratings for LDO / UST (LDO): today its technical analysis shows the strong buy signal, and according to the 1 week rating LDO shows the buy signal. And you'd better dig deeper and study 1 month rating too — it's neutral. Find inspiration in LDO / UST trading ideas and keep track of what's moving crypto markets with our crypto news feed.
LDO / UST (LDO) is just as reliable as any other crypto asset — this corner of the world market is highly volatile. Today, for instance, LDO / UST is estimated as 0.38% volatile. The only thing it means is that you must prepare and examine all available information before making a decision. And if you're not sure about LDO / UST, you can find more inspiration in our curated watchlists.
You can discuss LDO / UST (LDO) with other users in our public chats, Minds or in the comments to Ideas.