10/8/25 - $fi - biggest POS... i mean position10/8/25 :: VROCKSTAR :: NYSE:FI
biggest POS... i mean position
- pretty leveraged this puppy on jan '28 leaps to the tune of 25% position, it's the largest one on my book (gross) at the moment
- i like the MSD+ fcf yields
- financials have been holding up, well (well... fintech seems to have foun
Key facts today
Next report date
—
Report period
—
EPS estimate
—
Revenue estimate
—
6.0 USD
3.13 B USD
20.46 B USD
539.41 M
About Fiserv, Inc.
Sector
CEO
Michael P. Lyons
Website
Headquarters
Milwaukee
Founded
1984
ISIN
US3377381088
FIGI
BBG00JRY8FX6
Fiserv, Inc. engages in the provision of financial services technology. It operates through the Merchant and Financial segments. The Merchant segment offers commerce-enabling products and services including merchant acquiring and digital commerce and mobile payment services, and security and fraud protection, stored-value, and pay-by-bank solutions to companies of all sizes. The Financial segment provides products and services such as processing of customer loan and deposit accounts, digital payments, and card transactions to financial institutions and corporate and public sector clients. The company was founded by Leslie M. Muma and George D. Dalton on July 31, 1984 and is headquartered in Milwaukee, WI.
Related stocks

FISERV Approaching DEMAND!!!!Expect a lot of buyers to enter this stock at the next significant demand zone with our target set at the all time high.

Fiserv - Undervalued?Looks undervalued. Need to see decent buy volume and a breakout of the downward trend.
Support remains strong at $127.26, but can it hold and start moving up?
Given the risk/reward, I lean cautiously optimistic. It’s not a screaming “buy now,” but I think there is a real case for accumulating grad

FI: Backing the Bag – A Scaled EntryThe bullish (long) case for Fiserv, Inc. (FI) is primarily driven by its significant undervaluation relative to its strong fundamental growth and a favorable analyst outlook, despite recent negative technical price action.
Significant Undervaluation: Multiple analyses suggest the stock is trading a

9/19/25 - $fi - A lil weird, tbh (mkt commentary too)9/19/25 :: VROCKSTAR :: NYSE:FI
A lil weird, tbh
- well let's start by reflecting... "what's not weird".
- okay
- on one hand the market is almost obviously over it's skis on stocks where fundamentals are something of a "we'll see in 3 years"
- and where you have high quality payment names (like

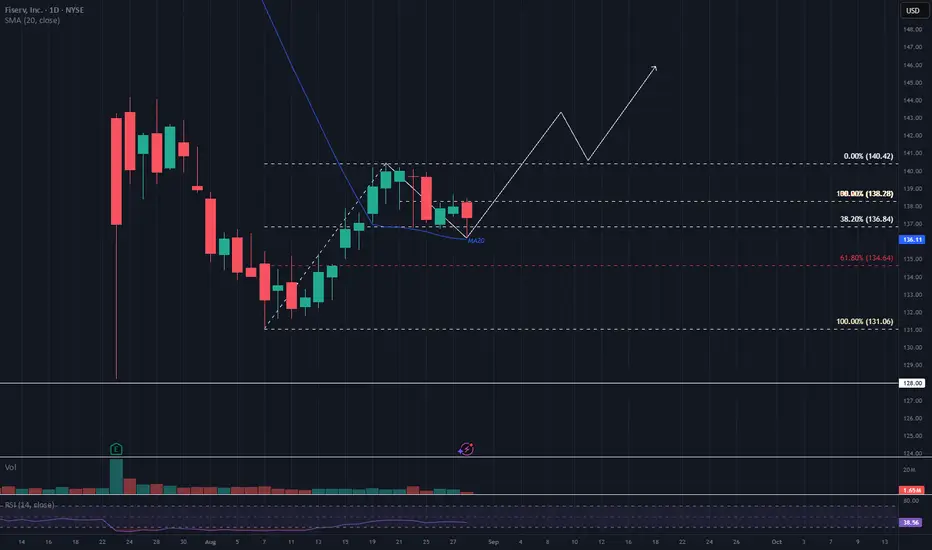
$FI Technical Outlook: Gradual Recovery with Key Support LevelsFI is currently moving slowly after a sharp decline triggered by ER. Technically, the stock appears to be well-supported by the MA20 and the 38.2% Fibonacci retracement level.
Despite the sluggish pace, the chart suggests a potential uptrend. In the first phase, I anticipate a move toward the $140
BUY FINews has given us an opportunity to buy at a good price. Although its below our significant demand level i see this stock turning around.

Stock Of The Day / 07.23.25 / FI07.23.2025 / NYSE:FI
Fundamentals. The earnings report exceeded expectations.
Technical analysis.
Daily chart: Downtrend
Premarket: Gap Down on increased volume. We mark the premarket low of 136.0
Trading session: The price did not continue the downward movement and formed an uptrend

Fiserv Falling Knife TradeLooks like Fiserv is entering an area of interest. I will SLOWLY start an accumulation here between $125 - $136 for my first buy and looking to lower levels to add more aggressively.
A vicious ABC correction and we are currently sitting on on the 0.786 Fib. If this fails to hold, we have a monthly

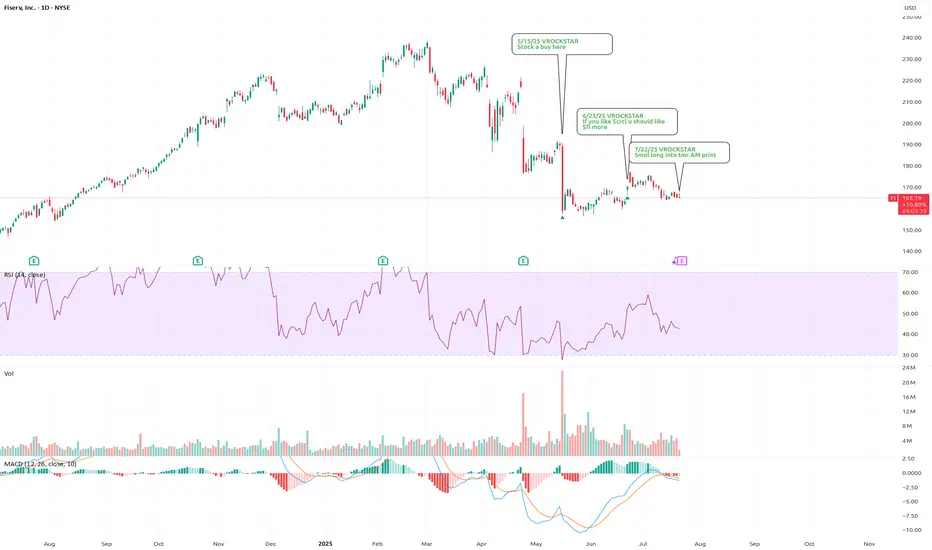
7/22/25 - $fi - Smol long into tmr AM print7/22/25 :: VROCKSTAR :: NYSE:FI
Smol long into tmr AM print
- sub 20x PE and 2x peg (pf adj. for debt) is reasonable for mkt leader
- like the stable coin angle, think they really talk this up... as i've written about previously
- v "consumer" exposed (similar to how i wrote about NYSE:DECK ). i
See all ideas
Summarizing what the indicators are suggesting.
Neutral
SellBuy
Strong sellStrong buy
Strong sellSellNeutralBuyStrong buy
Neutral
SellBuy
Strong sellStrong buy
Strong sellSellNeutralBuyStrong buy
Neutral
SellBuy
Strong sellStrong buy
Strong sellSellNeutralBuyStrong buy
An aggregate view of professional's ratings.
Neutral
SellBuy
Strong sellStrong buy
Strong sellSellNeutralBuyStrong buy
Neutral
SellBuy
Strong sellStrong buy
Strong sellSellNeutralBuyStrong buy
Neutral
SellBuy
Strong sellStrong buy
Strong sellSellNeutralBuyStrong buy
Displays a symbol's price movements over previous years to identify recurring trends.
FISV4845279
Fiserv, Inc. 4.4% 01-JUL-2049Yield to maturity
5.71%
Maturity date
Jul 1, 2049
US337738BQ0
Fiserv, Inc. 5.25% 11-AUG-2035Yield to maturity
5.10%
Maturity date
Aug 11, 2035
FIVG
Fiserv, Inc. 3.0% 01-JUL-2031Yield to maturity
5.00%
Maturity date
Jul 1, 2031
FISV5864177
Fiserv, Inc. 5.15% 12-AUG-2034Yield to maturity
4.93%
Maturity date
Aug 12, 2034
FISV5761679
Fiserv, Inc. 5.45% 15-MAR-2034Yield to maturity
4.92%
Maturity date
Mar 15, 2034
FISV5634796
Fiserv, Inc. 5.625% 21-AUG-2033Yield to maturity
4.84%
Maturity date
Aug 21, 2033
FISV5548631
Fiserv, Inc. 5.6% 02-MAR-2033Yield to maturity
4.79%
Maturity date
Mar 2, 2033
FISV5761678
Fiserv, Inc. 5.35% 15-MAR-2031Yield to maturity
4.47%
Maturity date
Mar 15, 2031
US337738BP2
Fiserv, Inc. 4.55% 15-FEB-2031Yield to maturity
4.45%
Maturity date
Feb 15, 2031
FISV4986756
Fiserv, Inc. 2.65% 01-JUN-2030Yield to maturity
4.39%
Maturity date
Jun 1, 2030
FISV5864320
Fiserv, Inc. 4.75% 15-MAR-2030Yield to maturity
4.36%
Maturity date
Mar 15, 2030
See all 0IP9 bonds
Curated watchlists where 0IP9 is featured.

Frequently Asked Questions
The current price of 0IP9 is 122.5 USD — it has decreased by −0.32% in the past 24 hours. Watch Fiserv, Inc. stock price performance more closely on the chart.
Depending on the exchange, the stock ticker may vary. For instance, on LSE exchange Fiserv, Inc. stocks are traded under the ticker 0IP9.
0IP9 stock has fallen by −4.89% compared to the previous week, the month change is a −9.54% fall, over the last year Fiserv, Inc. has showed a −35.06% decrease.
We've gathered analysts' opinions on Fiserv, Inc. future price: according to them, 0IP9 price has a max estimate of 228.00 USD and a min estimate of 125.00 USD. Watch 0IP9 chart and read a more detailed Fiserv, Inc. stock forecast: see what analysts think of Fiserv, Inc. and suggest that you do with its stocks.
0IP9 reached its all-time high on Feb 21, 2025 with the price of 240.0 USD, and its all-time low was 56.5 USD and was reached on Jan 19, 2018. View more price dynamics on 0IP9 chart.
See other stocks reaching their highest and lowest prices.
See other stocks reaching their highest and lowest prices.
0IP9 stock is 1.79% volatile and has beta coefficient of 0.34. Track Fiserv, Inc. stock price on the chart and check out the list of the most volatile stocks — is Fiserv, Inc. there?
Today Fiserv, Inc. has the market capitalization of 66.66 B, it has decreased by −3.01% over the last week.
Yes, you can track Fiserv, Inc. financials in yearly and quarterly reports right on TradingView.
Fiserv, Inc. is going to release the next earnings report on Oct 29, 2025. Keep track of upcoming events with our Earnings Calendar.
0IP9 earnings for the last quarter are 2.47 USD per share, whereas the estimation was 2.43 USD resulting in a 1.44% surprise. The estimated earnings for the next quarter are 2.65 USD per share. See more details about Fiserv, Inc. earnings.
Fiserv, Inc. revenue for the last quarter amounts to 5.20 B USD, despite the estimated figure of 5.19 B USD. In the next quarter, revenue is expected to reach 5.36 B USD.
0IP9 net income for the last quarter is 1.03 B USD, while the quarter before that showed 851.00 M USD of net income which accounts for 20.56% change. Track more Fiserv, Inc. financial stats to get the full picture.
No, 0IP9 doesn't pay any dividends to its shareholders. But don't worry, we've prepared a list of high-dividend stocks for you.
As of Oct 14, 2025, the company has 38 K employees. See our rating of the largest employees — is Fiserv, Inc. on this list?
EBITDA measures a company's operating performance, its growth signifies an improvement in the efficiency of a company. Fiserv, Inc. EBITDA is 9.56 B USD, and current EBITDA margin is 43.86%. See more stats in Fiserv, Inc. financial statements.
Like other stocks, 0IP9 shares are traded on stock exchanges, e.g. Nasdaq, Nyse, Euronext, and the easiest way to buy them is through an online stock broker. To do this, you need to open an account and follow a broker's procedures, then start trading. You can trade Fiserv, Inc. stock right from TradingView charts — choose your broker and connect to your account.
Investing in stocks requires a comprehensive research: you should carefully study all the available data, e.g. company's financials, related news, and its technical analysis. So Fiserv, Inc. technincal analysis shows the strong sell today, and its 1 week rating is sell. Since market conditions are prone to changes, it's worth looking a bit further into the future — according to the 1 month rating Fiserv, Inc. stock shows the sell signal. See more of Fiserv, Inc. technicals for a more comprehensive analysis.
If you're still not sure, try looking for inspiration in our curated watchlists.
If you're still not sure, try looking for inspiration in our curated watchlists.