CNR: VolanX DSS | Weekly Structure OutlookNYSE:CRK – VolanX DSS | Weekly Structure Outlook 🧠📊
Price just reclaimed the equilibrium zone near $76–78, rejecting deeper liquidity and now forming a bullish reversal pivot.
🔹 Current: $89.41
🔹 Resistance zones: $102.14 → $116.10 → $132.68
🔹 Support: $76.87
🔹 Volume Spike: 6.4M — confirming earl
Next report date
—
Report period
—
EPS estimate
—
Revenue estimate
—
−0.3540 EUR
276.66 M EUR
2.13 B EUR
50.04 M
About Core Natural Resources, Inc.
Sector
Industry
CEO
James A. Brock
Website
Headquarters
Canonsburg
ISIN
US2189371006
Core Natural Resources, Inc. is a producer of metallurgical and high calorific value thermal coals for the global marketplace. The firm operates through the following segments: Metallurgical, High Calorific Value Thermal, and Powder River Basin. The company was founded on January 14, 2025 and is headquartered in Canonsburg, PA.
Related stocks

CNR bullish breakout AGAINCNR again has given us the opportunity to jump back in , the EMA's have been broken and re-tested for multiple days now .
Entry at current price with stop loss 71-74
TP : Long term hold

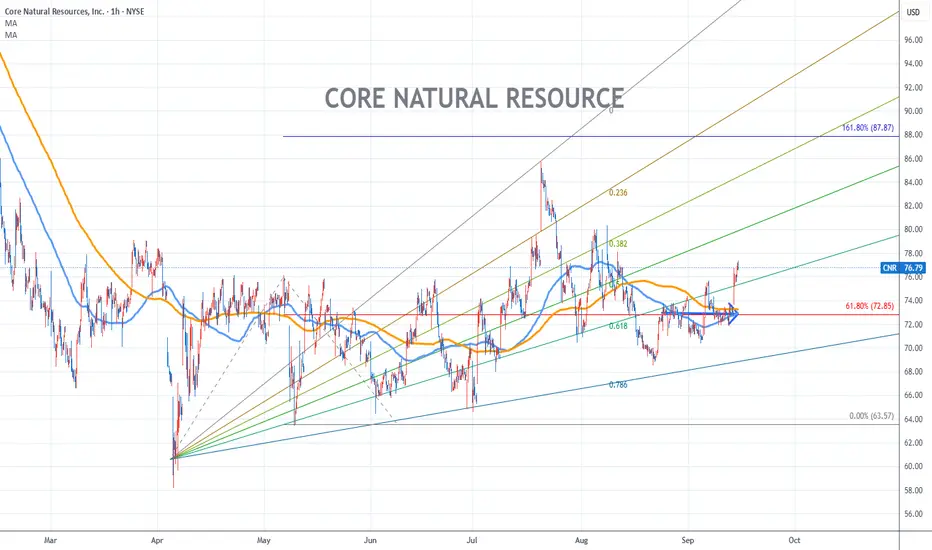
Core Natural Resources Stock Chart Fibonacci Analysis 091525Trading Idea
1) Find a FIBO slingshot
2) Check FIBO 61.80% level
3) Entry Point > 73/61.80%
Chart time frame:B
A) 15 min(1W-3M)
B) 1 hr(3M-6M)
C) 4 hr(6M-1year)
D) 1 day(1-3years)
Stock progress:A
A) Keep rising over 61.80% resistance
B) 61.80% resistance
C) 61.80% support
D) Hit the bottom
E)
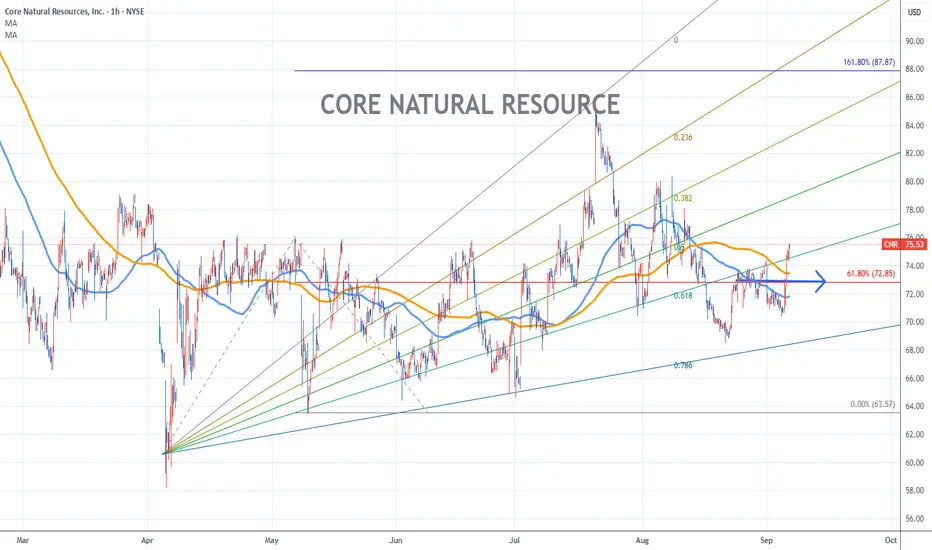
Core Natural Resource Stock Chart Fibonacci Analysis 090625Trading Idea
1) Find a FIBO slingshot
2) Check FIBO 61.80% level
3) Entry Point > 73/61.80%
Chart time frame:C
A) 15 min(1W-3M)
B) 1 hr(3M-6M)
C) 4 hr(6M-1year)
D) 1 day(1-3years)
Stock progress:A
A) Keep rising over 61.80% resistance
B) 61.80% resistance
C) 61.80% support
D) Hit the bottom
E)
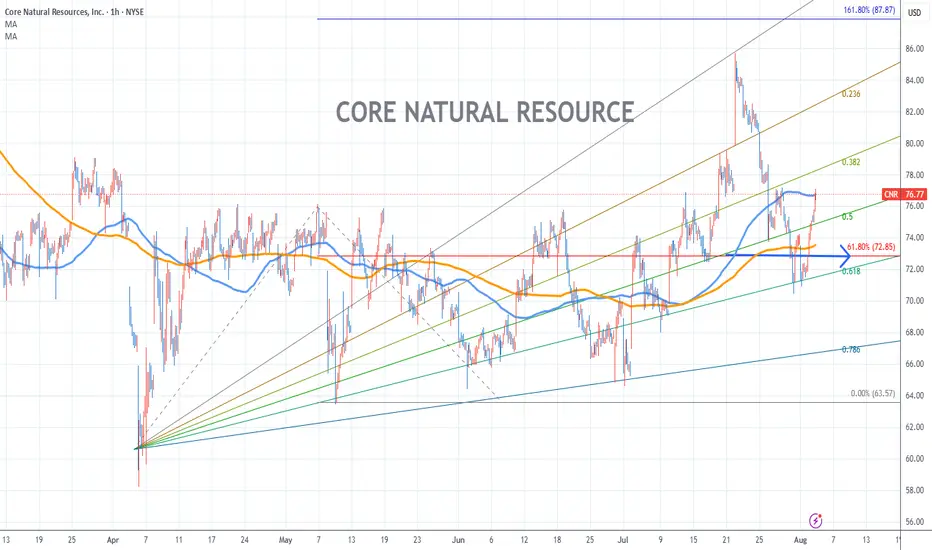
Core Natual Resource Chart Fibonacci Analysis 080425Trading Idea
1) Find a FIBO slingshot
2) Check FIBO 61.80% level
3) Entry Point 73/61.80%
Chart time frame:B
A) 15 min(1W-3M)
B) 1 hr(3M-6M)
C) 4 hr(6M-1year)
D) 1 day(1-3years)
Stock progress:A
A) Keep rising over 61.80% resistance
B) 61.80% resistance
C) 61.80% support
D) Hit the bottom
E) Hi
Swing Long for Core Natural ResourcesCoal manufacturing will likely thrive under the Trump administration. Looking to surge upwards from this major support zone.

CNR - Cup and Handle formation - LONGYou can see a cup and handle formation that is nearing its' end in the chart for CNR - this is therefore a bullish call.
As well as that, CNR operates in the real estate materials space and with real estate expecting to see a supercycle in the states in the next decade, this is a conducive trade wi


Cornerstone Building BrandsStrategy/Chart pattern: Bull flag
Entry: Immediately (Limit 19.50$)
Stop: 17.40$
Target: 23.60$
Risk/Reward-Ratio: > 3:1
Stopmanagement: ATR stops daily chart default settings

See all ideas
Summarizing what the indicators are suggesting.
Neutral
SellBuy
Strong sellStrong buy
Strong sellSellNeutralBuyStrong buy
Neutral
SellBuy
Strong sellStrong buy
Strong sellSellNeutralBuyStrong buy
Neutral
SellBuy
Strong sellStrong buy
Strong sellSellNeutralBuyStrong buy
An aggregate view of professional's ratings.
Neutral
SellBuy
Strong sellStrong buy
Strong sellSellNeutralBuyStrong buy
Neutral
SellBuy
Strong sellStrong buy
Strong sellSellNeutralBuyStrong buy
Neutral
SellBuy
Strong sellStrong buy
Strong sellSellNeutralBuyStrong buy
Frequently Asked Questions
The current price of A40ZGW is 66.7000 EUR — it has increased by 0.15% in the past 24 hours. Watch Core Natural Resources, Inc. stock price performance more closely on the chart.
Depending on the exchange, the stock ticker may vary. For instance, on LSX exchange Core Natural Resources, Inc. stocks are traded under the ticker A40ZGW.
A40ZGW stock has fallen by −4.99% compared to the previous week, the month change is a −10.59% fall, over the last year Core Natural Resources, Inc. has showed a −25.39% decrease.
We've gathered analysts' opinions on Core Natural Resources, Inc. future price: according to them, A40ZGW price has a max estimate of 108.26 EUR and a min estimate of 89.21 EUR. Watch A40ZGW chart and read a more detailed Core Natural Resources, Inc. stock forecast: see what analysts think of Core Natural Resources, Inc. and suggest that you do with its stocks.
A40ZGW reached its all-time high on Jan 30, 2025 with the price of 90.8500 EUR, and its all-time low was 53.9000 EUR and was reached on Apr 4, 2025. View more price dynamics on A40ZGW chart.
See other stocks reaching their highest and lowest prices.
See other stocks reaching their highest and lowest prices.
A40ZGW stock is 0.83% volatile and has beta coefficient of 1.09. Track Core Natural Resources, Inc. stock price on the chart and check out the list of the most volatile stocks — is Core Natural Resources, Inc. there?
Today Core Natural Resources, Inc. has the market capitalization of 3.45 B, it has decreased by −8.16% over the last week.
Yes, you can track Core Natural Resources, Inc. financials in yearly and quarterly reports right on TradingView.
Core Natural Resources, Inc. is going to release the next earnings report on Feb 19, 2026. Keep track of upcoming events with our Earnings Calendar.
A40ZGW earnings for the last quarter are 0.52 EUR per share, whereas the estimation was −0.61 EUR resulting in a 184.94% surprise. The estimated earnings for the next quarter are 0.00 EUR per share. See more details about Core Natural Resources, Inc. earnings.
Core Natural Resources, Inc. revenue for the last quarter amounts to 854.36 M EUR, despite the estimated figure of 875.86 M EUR. In the next quarter, revenue is expected to reach 897.26 M EUR.
A40ZGW net income for the last quarter is 26.93 M EUR, while the quarter before that showed −31.03 M EUR of net income which accounts for 186.77% change. Track more Core Natural Resources, Inc. financial stats to get the full picture.
Yes, A40ZGW dividends are paid quarterly. The last dividend per share was 0.09 EUR. As of today, Dividend Yield (TTM)% is 0.71%. Tracking Core Natural Resources, Inc. dividends might help you take more informed decisions.
Core Natural Resources, Inc. dividend yield was 0.47% in 2024, and payout ratio reached 5.20%. The year before the numbers were 2.19% and 11.12% correspondingly. See high-dividend stocks and find more opportunities for your portfolio.
As of Nov 23, 2025, the company has 2.08 K employees. See our rating of the largest employees — is Core Natural Resources, Inc. on this list?
EBITDA measures a company's operating performance, its growth signifies an improvement in the efficiency of a company. Core Natural Resources, Inc. EBITDA is 421.66 M EUR, and current EBITDA margin is 24.89%. See more stats in Core Natural Resources, Inc. financial statements.
Like other stocks, A40ZGW shares are traded on stock exchanges, e.g. Nasdaq, Nyse, Euronext, and the easiest way to buy them is through an online stock broker. To do this, you need to open an account and follow a broker's procedures, then start trading. You can trade Core Natural Resources, Inc. stock right from TradingView charts — choose your broker and connect to your account.
Investing in stocks requires a comprehensive research: you should carefully study all the available data, e.g. company's financials, related news, and its technical analysis. So Core Natural Resources, Inc. technincal analysis shows the sell today, and its 1 week rating is sell. Since market conditions are prone to changes, it's worth looking a bit further into the future — according to the 1 month rating Core Natural Resources, Inc. stock shows the sell signal. See more of Core Natural Resources, Inc. technicals for a more comprehensive analysis.
If you're still not sure, try looking for inspiration in our curated watchlists.
If you're still not sure, try looking for inspiration in our curated watchlists.