LTCUSD BullishLooks like the market is accumulating to the upside in the weekly time frame. Let's see what will happen this upcoming weeks. As what I can see it's going to push the market to the upside next month, I will continuously watch what will happen on this pair.
Trade ideas

Could LTC hit ATHs in 2026? When you zoom out to the 6 month candles, the short-term noise disappears and Litecoin becomes much easier to read. For the past 18 months, price has repeatedly gravitated toward the $105 level but has never managed to close above it on this timeframe. At the same time, LTC has consistently protected the $84.50 support zone every 6-month candle has closed above it, even during deep wicks down to $63–$72.
This creates a very clean high-timeframe structure:
Key Levels
$105 – Critical resistance. A 6 month close above this would signal a major bullish shift.
$84.50 – Strongest HTF support. A 6 month close below this would confirm deeper downside.
$146.23 – Next key resistance after $105.
$227.17 – Higher HTF resistance.
$420 – Final level before entering full price discovery.
Bias
I lean bullish, mainly because:
LTC keeps returning to $105 like a magnet.
It has refused to close below $84.50 for a year and a half.
Even during the recent washout, LTC held the mid-$90s and bounced quickly.
Upside Potential
If Litecoin finally closes a 6-month candle above $105, the structure opens the path toward:
$146 → $227 → $420
A 6 month close over $420 would be extremely bullish in my opinion similar to what ETH did in 2020–2021 before its explosive move.
Above previous ATHs, price discovery could easily extend much higher:
$1,000+ is realistic
With strong momentum, a full rotation, and LTC’s historic supply dynamics, a move into multiple thousands isn’t impossible.
My personal long-term target:
~$6,000–$7,000 per LTC if the cycle reaches full maturity.

LTC_USDTthis my lorng tearm idea about LTC_USDT
You Can Catch this long trade in my area. this is daily qm entry setup.

LTC LONG ENTRY 🚀 Trade Setup
🟢 Entry Range: $93 – $96
🎯 Targets :
1️⃣ $100
2️⃣ $105
3️⃣ $115
4️⃣ $125
🔴 Stop-Loss: Below $85
📊 Plan the trade, then trade the plan — patience is key!

Litecoin: Bearish Setup Builds Below $101.00FenzoFx—Litecoin is up 1.60% today, trading near $101.00. The price declined after tapping the liquidity void at $112.30, aligned with the upper band of the bearish channel. Immediate support lies at $98.00. A close below this level could resume the downtrend, targeting $93.70.
If selling pressure persists, LTC may fill the bullish fair value gap with support at $89.30. The current momentum remains vulnerable to reversal.

LTC/USD Market Flow Blueprint – Bearish Bias Confirmed!🎯 LTC/USD: The Great Support Heist 🏴☠️ | Bearish Breakdown Blueprint
📊 Market Overview
Asset: LTC/USD (Litecoin vs. U.S. Dollar)
Market: Cryptocurrency
Trade Type: Swing Trade (Bearish Setup)
Strategy Style: "Thief Method" - Multi-Layer Limit Orders
🔍 Technical Analysis
Litecoin has officially broken through its STRONG SUPPORT ZONE, confirming a bearish market structure. This isn't just a casual dip—we're looking at a genuine breakdown that's validated by price action closing below critical support levels. The bears are in control, and the path of least resistance is pointing south. 🐻📉
What's Happening?
✅ Support zone broken with conviction
✅ Market structure showing lower highs forming
✅ Momentum shifting to the downside
✅ Volume confirming the breakdown
🎯 Trade Plan Breakdown
📍 Entry Strategy: "The Thief Layer Method"
Instead of going all-in at one price (rookie move 😅), we're using a multi-layer limit order strategy to build our position as price moves. Think of it as setting multiple traps along the way down.
Suggested Sell Limit Layers:
🎪 Layer 1: $92.00
🎪 Layer 2: $90.00
🎪 Layer 3: $88.00
Pro Tip: You can add more layers based on your risk appetite and position sizing strategy. Scale in, don't gamble in! 🎲
🛑 Stop Loss: $96.00
This stop is placed at the previous market structure's nearest higher high wick. Why? Because if price reclaims this level, it invalidates our bearish thesis and tells us the breakdown was fake news. 🚫
⚠️ IMPORTANT DISCLAIMER: This is MY stop loss based on MY analysis and risk tolerance. You should ALWAYS determine your own stop loss based on YOUR risk management rules. Trade your own plan, not mine! Your money, your rules. 💰
🎁 Target: $75.00
Our profit target sits at a confluence zone where we're expecting:
💎 Strong historical support
💎 Oversold conditions (RSI likely stretched)
💎 Bull trap potential zone
💎 Possible trend reversal area
This is where smart bears become bulls and take profits off the table. Don't be greedy—secure the bag! 💼
⚠️ IMPORTANT DISCLAIMER: This target is based on MY analysis. You should set YOUR OWN take profit levels based on YOUR trading plan and risk management. Lock in profits when YOU feel comfortable. Your capital, your decision! 🎯
🔗 Related Pairs to Watch
Keep an eye on these correlated assets for confluence:
BITSTAMP:BTCUSD - The king leads, alts follow. If Bitcoin dumps, LTC usually amplifies the move 👑
BITSTAMP:ETHUSD - Major alt indicator. Ethereum weakness = altcoin pain 🌊
BINANCE:LTCBTC - Shows LTC's relative strength against Bitcoin. Watch for breakdown here too 📊
TVC:DXY (Dollar Index) - Strong dollar = crypto weakness typically 💵
Correlation Play: Crypto markets move as a herd. When Bitcoin sneezes, Litecoin catches pneumonia. Watch BTC dominance and overall market sentiment. If BTC is showing weakness at key levels, it adds conviction to this LTC short setup. 🧩
📝 Key Takeaways
Confirmation is King - We're not guessing; the support break is confirmed ✅
Layer Your Entries - Don't blow your load at one price. Build the position strategically 🎯
Respect Your Risk - Stop loss is there for a reason. Use it. Love it. Don't delete it. 🛡️
Take Profits - The market doesn't care about your feelings. When you hit target, TAKE THE MONEY 💰
Stay Flexible - Markets change. If the setup invalidates, move on. No ego in trading 🧘
⚡ The Thief Philosophy
This isn't financial advice—it's a treasure map. 🗺️ You still have to dig, avoid the traps, and know when to run. The "Thief Method" is all about stealth entries, calculated risk, and knowing when to escape with the loot before the guards (market reversal) catch you.
We're not gambling; we're executing a heist. Plan the job, execute with discipline, and don't get caught holding bags. 🏴☠️💼
🎬 Final Words
Markets don't reward hope; they reward preparation and execution. This setup offers a solid risk-reward if you manage it properly. Remember: Your trade, your risk, your responsibility. I'm just sharing what I see and how I'm playing it.
Stay sharp, trade safe, and may your stop losses never get hit. 🎯🚀
✨ If you find value in my analysis, a 👍 and 🚀 boost is much appreciated — it helps me share more setups with the community!
#LTCUSD #Litecoin #CryptoTrading #BearishSetup #SwingTrade #TechnicalAnalysis #ThiefMethod #CryptoAnalysis #TradingStrategy #ShortSetup #CryptoTA #LTC #SupportBreakdown #LayeredEntry #RiskManagement

LTCUSD SELL 119.2On the daily chart, LTCUSD has stabilized and rebounded in the short term. At present, attention can be paid to the resistance around 119.2, which is a potential shorting position for a bearish Gartley pattern. At the same time, this position is within the previous supply zone.

Moon time for Litecoin! - $700 ?? - November 2025Wait a minute… doom for Dogecoin, boom for Litecoin?
“ You can’t have a bearish idea for Doge and a bullish one for Litecoin, idiot!”
Yeah, yeah. I’ve had my coffee, I’m ready for the unhinged piffle that’ll inevitably clutter the comments. Bring it on..
For the rest of us: facts are facts. Charts don’t lie... people do.
The Technical Story
Remember the blue line on the Dogecoin idea ? The one that looked like it had just given up on life? Now look at Litecoin.
Stop drooling. You’re not a starving tradesman staring at a bacon sandwich, you’re a paid-up member of the Litecoin faithful. Still holding this thing eight years after promising your friends it was “digital silver.” The stock market’s gone vertical, AI’s rewritten the economy, and you’re here, squinting at a 200-week moving average like it’s the face of God.
But here’s the thing… this chart actually looks good.
A clean Dragonfly DOJI printed on support. That’s not random, that’s exhaustion at the lows.
The RSI has bounced perfectly from the lower trendline of a four-year descending channel.
The Stochastic RSI just printed a bullish cross that looks eerily like the ones preceding major Litecoin rallies.
This is not Dogecoin.
What’s Different This Time?
No hype, no memes, no billionaire tweets. When nobody cares, that’s when charts get interesting.
The 200-week SMA (red) finally flatlining. That’s long-term accumulation, not another dead-cat bounce.
Market structure intact. Unlike most alt tokens, LTC has maintained higher lows since 2022, quietly building a base while everyone’s off chasing whatever AI or frog coin is trending this week.
The Forecast
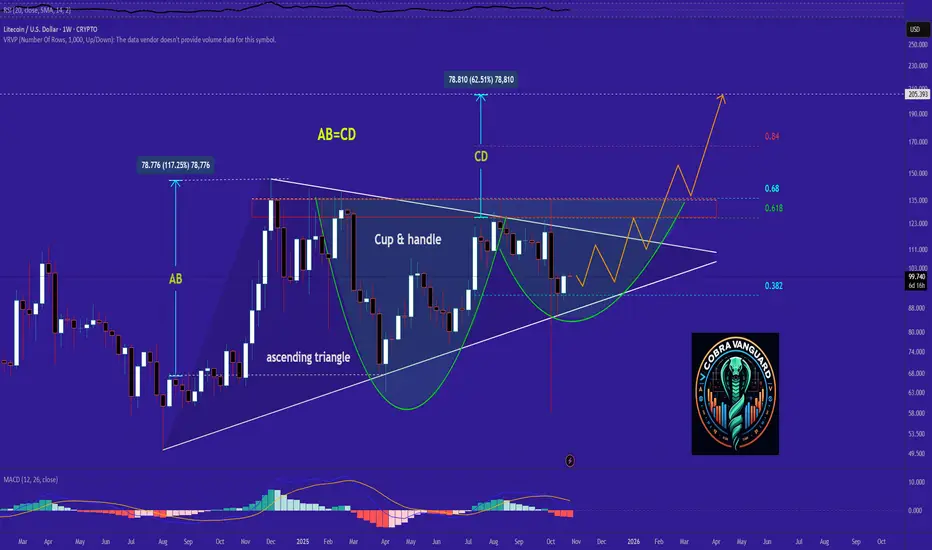
Base case: A push toward $140–$150 (the upper band of RSI resistance).
Bull case: $180+ within the first half of 2026, assuming the RSI breakout holds.
Bear case: You ignore every technical confirmation, and it does nothing for another decade, but at least you can say you hodled.
Big bull case: Price action breaks resistance to complete the ascending triangle to $700
Conclusions
Litecoin, the granddad of crypto might finally be waking up from its retirement nap. While Dogecoin’s out back chasing its tail, Litecoin’s quietly tightening its laces.
If this setup holds, LTC could be one of the few alt tokens left standing when the dust settles.
If not, well… it’s back to the rocking chair and war stories about 2017.
Ww
Disclaimer
=================================================================
This isn’t financial advice. I’m not your portfolio manager, your therapist, or your mum.
If you sell your house to buy Litecoin because of this post, that’s on you.
It’s just a bloke pointing at squiggly lines saying, “That looks interesting.” If it moons, you’ll call yourself a genius. If it dumps, you’ll say the market’s rigged.
Either way, stay safe.

TC and ICP · The Quiet Storm Before the BreakoutMarkets are buzzing again after Trump mentioned a possible “tariff dividend” – a $2,000 payout per person funded by tariffs. It reminds many of 2020’s stimulus wave that pushed Bitcoin from $4K to $69K. If liquidity returns, older assets like Litecoin COINBASE:LTCUSD and Internet Computer BINANCE:ICPUSDT could be the next to move.
LTC: The Silent Giant
Litecoin is showing one of the cleanest technical setups in the market. The monthly chart forms a massive symmetrical triangle that’s been tightening since 2018. LTC just reclaimed the $108–$110 zone, sitting right below resistance. A monthly close above it could confirm a breakout toward $175 or more.
Historically, LTC rallies begin in November – right before broader altcoin seasons. The pattern from 2017 and 2020 looks set to repeat. If it does, the next rally could align perfectly with the 2025 halving cycle.
LTC Trading Plan:
- Breakout: $135
- Resistance: $160–$170
- Cut Loss: $70
- Targets: $240 / $400 / $600 / $1000
ICP: Rising Scarcity, New Narrative
Coinbase reserves of ICP have hit record lows. Only ~284,000 tokens remain on the exchange, while Binance’s reserves grow. This shift hints at growing demand.
Coinbase’s CEO recently talked about taking the exchange onchain, and ICP’s tech is one of the few ready for that move. With 44% of its supply locked, ICP’s real market cap is smaller than it looks, making it ripe for repricing.
ICP Trading Plan:
- Entry: $6.0–$7.0
- Stop: $5.0
- Targets: $11 / $12.5 / $14 / $20
Both LTC and ICP show strong asymmetry. One stands on historical cycles, the other on real scarcity and narrative growth. The setup looks familiar – quiet now, but maybe not for long.
TheCryptoFire

Bearish megaphone confirmThe price failed to break above the $113 resistance and is now expected to move lower.
The bearish megaphone pattern points to a much lower target.
I’m waiting for a catalyst or news event that could push the price through the current lows.
The price was held above $110 to attract new buyers, but selling pressure remained dominant as sellers took control of the market.

NOT CLEAR TRADNBINANCE:LTCUSD.P
h
Higher high make and change to break out
rsi d compleat
let see
adx under 25

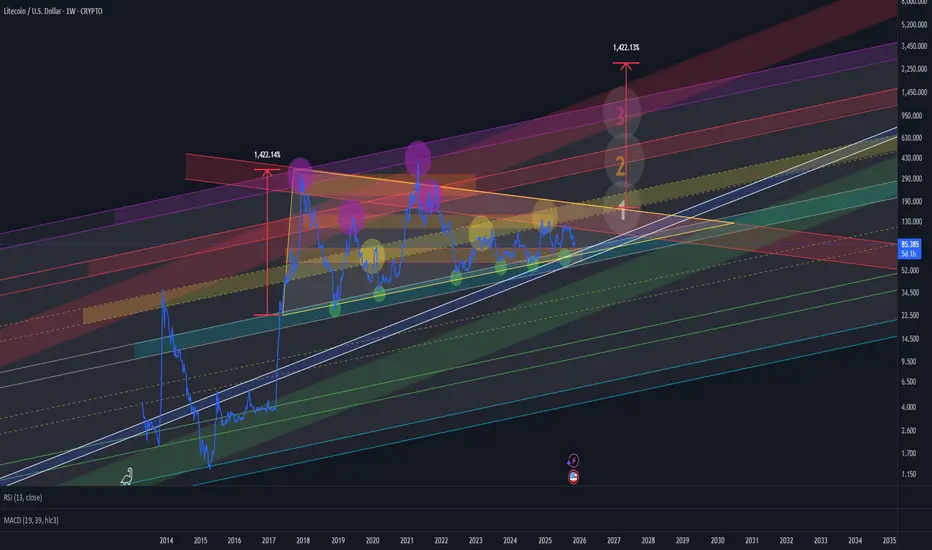
Litecoin Rainbow Chart + Elliott Waves TheoryThis is what I believe will happen to Litecoin in the next years
Litecoin Rainbow Chart indicator (Power Law), combined with the most probable EW counting seems to be simply perfect.
This trade will retire my bloodline
Thank you for your support
Łama

LTC/USD +2000%All you need is not a chart. The market is much simpler than it seems. The last “bull market” on Litecoin was only +400-500% in 2021. In fact, it wasn't a bull market, but a fake pump test after the real bull market in 2017 to drain people who hold this coin. After all, we have 7 years of accumulation, and in this case, +1000% is the minimum I expect. The ETF is not the real reason, it is just a cover for the positions taken during this entire period.

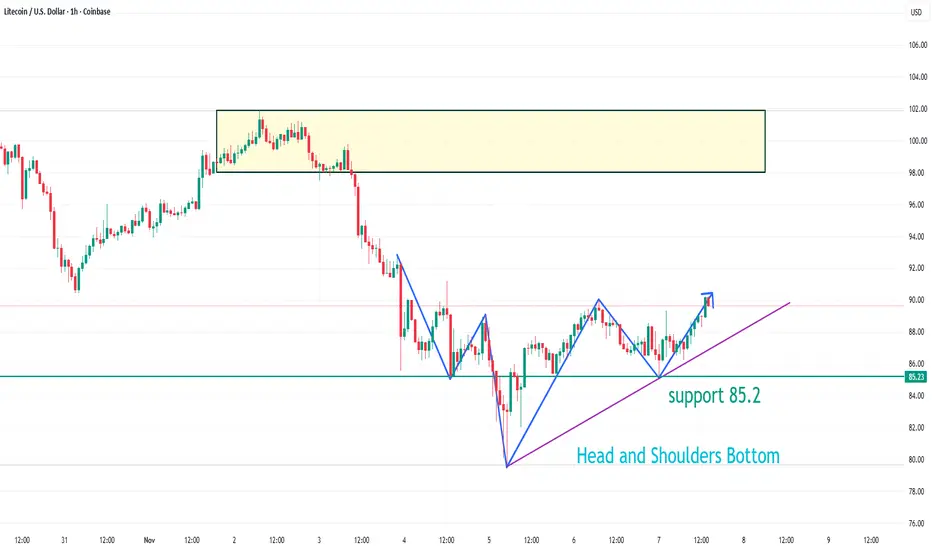
LTCUSD has formed a head and shoulders bottom patternOn the 1-hour chart, LTCUSD has formed a head and shoulders bottom pattern. Currently, watch for support around 85.2; if it retraces but doesn't break below this level, it's likely to continue its upward trend, targeting the 98.0-102.0 area.
Litecoin — Long-Term Accumulation and Breakout Setup (1W Chart)We have a blue horizontal accumulation zone, which has been acting as the cycle bottom area since 2018.
From this zone, long-term positions can be built with partial profit-taking targets at the yellow, red, and violet zones — each representing stages of distribution and de-risking from the accumulated position.
Additionally, we can observe a massive triangle formation.
If this pattern plays out, the breakout target zones are clearly indicated on the chart.
At the bottom, the blue line inside the white frame marks an additional support level, which may serve as a final retest zone before the next upward cycle.
Think Long TermI'm not claiming to be a good trader, or even a decent investor! But those of us who have decided to leave short-term trading and pursue longer-term trading, things start to show that they are better than they appear.
Also, it's wayy less stressful 😂
Keep your head up. We're in a support zone, which means this is the best place to buy. In terms of growth, now that LTC is getting its first ETFs we should be able to see LTC make it back to its all-time high and maybe even higher. This should only take a couple years at most, especially seeing that it took less time for BTC and ETH to return to near all-time highs post-ETF. Might take some time due to the somewhat disappointing initial inflows to the beforementioned LTC ETFs, but what I'm trying to say is that LTC will grow over time. Just gotta give it some time. Buy now, hold for a year or so, and we should make it beyond $300 in no time 🙂
Of course, all of this is just my opinion 😂

LTC - to the moonLitecoin has been in the accumulation zone for quite some time and is just begging to shoot to its ATN. I bought more from the current position, I will fix it as on the chart and leave 10% for new peaks
.........................................................................................
All ideas are published for my personal trading history.
Any copying of trades is done at your own risk.
Always remember — don’t risk money you can’t afford to lose.

LTCUSD H4 | Bullish Bounce Off Pullback SupportLTC/USD has bounced off the buy entry which is a pullback support that aligns with he 50% Fibonacci retracemnt and could rise from this level to the upside.
Buy entry is at 96.09, which is a pullback support that aligns with he 50% Fibonacci retracemnt.
Stop loss is at 84.76, which is a swing low support.
Take profit is at 115.31, whichis a pullback resistance that aligns with the 61.8% Fibonacci retracemnt.
Stratos Markets Limited (tradu.com ):
CFDs are complex instruments and come with a high risk of losing money rapidly due to leverage. 68% of retail investor accounts lose money when trading CFDs with this provider. You should consider whether you understand how CFDs work and whether you can afford to take the high risk of losing your money.
Stratos Europe Ltd (tradu.com ):
CFDs are complex instruments and come with a high risk of losing money rapidly due to leverage. 70% of retail investor accounts lose money when trading CFDs with this provider. You should consider whether you understand how CFDs work and whether you can afford to take the high risk of losing your money.

Bearish Engulfing Signals Downside for LitecoinFenzoFx—Litecoin filled 25% of the bearish fair value gap from Friday’s selloff, tapping into the $106.00 liquidity zone. The last candle is a bearish engulfing, signaling potential downside as both buyside and sell side liquidities were swept.
Resistance sits at $106.00. If this level holds, the downtrend may extend toward $85.50 and $78.60. The bearish outlook remains valid unless LTC/USD closes above $106.00 on the daily chart. A break above this level could trigger a move toward the upper line of the bearish channel.

Can LITECOIN copy ZEC's enormous rally?Zcash (ZECUSD) marginally broke its May 10 2021 Cycle Top (orange trend-line) this week, rising by more than +800% in just 2 months.
Throughout its trading history, it has been tightly correlated with Litecoin (LTCUSD). It's not uncommon to see ZEC lead the way and then LTC (purple) follow. As this chart shows, whenever the two diverged, the one always caught up with the other and converged again.
Does this mean that LTC will eventually catch up to this enormous rally? If it does indeed, the Top of the previous Cycle that it 'has to' fill is at $415.
-------------------------------------------------------------------------------
** Please LIKE 👍, FOLLOW ✅, SHARE 🙌 and COMMENT ✍ if you enjoy this idea! Also share your ideas and charts in the comments section below! This is best way to keep it relevant, support us, keep the content here free and allow the idea to reach as many people as possible. **
-------------------------------------------------------------------------------
💸💸💸💸💸💸
👇 👇 👇 👇 👇 👇

Litecoin is primed for a massive price explosionI’m thinking we’ll see a big pump on Litecoin. I love this multi-year accumulation pattern. A lot of people don’t realize how held back this coin has been—when it starts pumping, it will be insane.
As always, stay profitable.
- Dalin Anderson

Litecoin: Rally Stays on TrackLitecoin (LTC) has continued its steady upward climb. Under our primary scenario, the ongoing magenta wave is expected to sustain this momentum and push price above the resistance level at $147.06. However, if price falls below support at $50.22, our alternative scenario will come into play (probability: 40%), signaling the potential for further selling pressure.

LTC’s Bullish Confluence: Fibonacci + Pattern Break = RallyAs observed, the price is currently moving within two bullish patterns on the weekly timeframe, which is a strong signal for potential upward momentum.
The key now is to monitor how the price reacts to technical levels and Fibonacci zones. If either of these bullish patterns breaks to the upside, we could anticipate a potential $70 price increase in the medium term.