LTC - not sure why everyone is bearish Just zoom out. Should see a nice rally to $100 or more. Short to medium bull. Long term new lows
LTCUSD.P trade ideas

LTC/USDTHello Traders.
welcome back to another premium analysis for you.
Did you listen Movie about BIG SHOT. If Yes then Ok. if No the must see then must see,
this trade could be like big shot if you will handle carefully.
Nowadays everybody fall in low with #LTC & in fomo. but I'm looking for to open short position & will make money.
sentiments are completely bullish right now these all could be fruitful for retailer but not for professional. so if you look deeply LTC everything is bearish & ltc is very close to crash.
you can short it around 90$ to 96# & SL 107$ & keep your position hold around 30$ Minimum.
have a bless trade & make more money for your happiness.
Reward me your best comments.

Possible double bottom? I'm bullish on LTC, trend is positive and a double bottom already happened, but expecting crypto market dump soon so lower prices ahead are to be expected IMO.
This is also confirmed by negative (statistical) skewness trend (pale red line), and negative volume trend yet to breakout.
I see a possible double bottom forming on LTC on an important resistance.
Based on previous volatility, I expect a sigma 3 move (3 standard deviations) to the upside as target for the pattern and next peak, which is about 110, which is also an important price level.

LTC: Strong Support at $65 With High Odds to Continue UpwardHi Everyone! Yes, we do see potential to fall down to or near the Yellow B-Band Basis in the 24-hour at $65.00. Yes, it is possible to over extend below $65.00. However, if we do fall below $65.00, I expect the price action to pop right back up rather quickly to $65 or above $65. We also see increased odds in higher time frames to continue up - AFTER A PULLBACK - to around $94 to $108 price range. Will that move up be an Exponential Rally in Phase B - OR - a Sign of Strength Event in Phase D of Accumulation? That remains to be seen. We really will not know the answer to that question until later. This is explained a bit in the video.
I hope you found this video helpful.
If you don't mind, take a moment to click the like (boost) icon to show your support. It would be greatly appreciated.
Happy Trading and Stay Awesome!
David M Ward Jr
Short Term Group of time frames:
Near Term Group of time frames:
Mid Term Group of Time Frames:
Long Term Group of Time Frames:
Macro Group of Time Frames:
Super Macro Group of Time Frames:

My Long position in LTC !Hello dear traders and my subscribers 👥, please if you like ideas do not forget to support it with your boost 🚀 , thank you so much

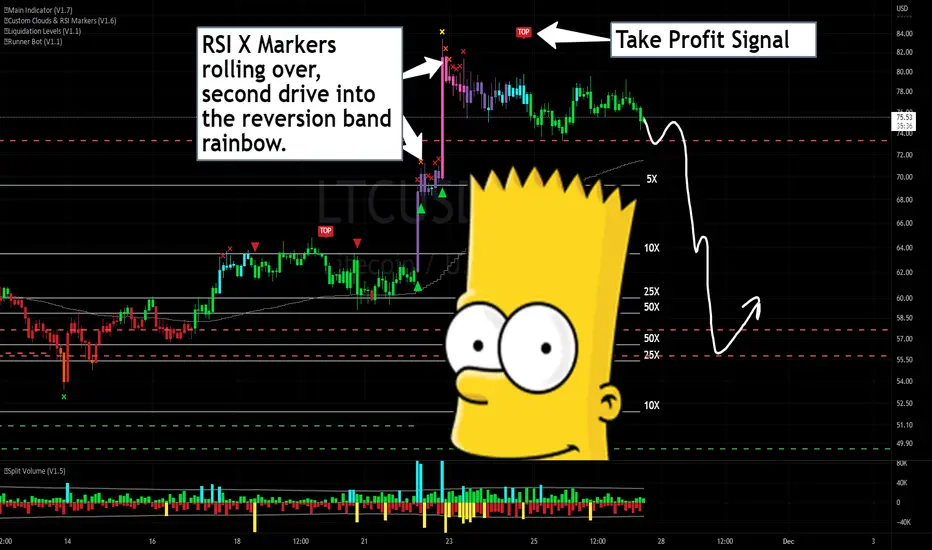
Litecoin Setting Up for A Bart Simpson Reversal - 🌈TheoryUsing Rainbow Theory we are seeing Litecoin setup for a potential Bart Simpson Reversal. We keep setting up and testing the upper pivot(dashed red line), once this is broken it will likely start to free fall down to balance out the trend.
If you have any questions about my TA or the indicators used, please leave a comment below or send me a DM . All of my links are next to my profile pic :)
LTC: Party now or party later?LTC looks to have completed primary degree wave 1 with a contracting leading diagonal structure back in May 2021. Since then, there has been a 3 wave retrace. On log scale it looks pretty shallow of a retrace out of the diagonal top. However, the price has fallen over 90% from the top, which can be justified as enough retracement. The current move up doesn't have a clean five waves move up, which keeps the possibility of the June 2022 low to be a bigger wave A, with current rally as a B wave up followed by a larger C wave down to reach at least .618 - .5 retrace. At the moment, I will watch LTC for at least two or three months to see how the structure shapes up. Regardless, the longterm outlook looks very rich!!!

LTC The LTC is sitting in the key zone.
The breakthrough below the zone in the past decided to sink to the bottom.
With the loss of this zone a possible decrease to support around 50 USD and in the extreme case with the loss of this support a possible repetition of the bull run 2018 pattern.
Not the financial board.
Just for fun.

Litecoin. Is it a leading Indicator?LTC has been pumping and there seems to be no reason for it.
I have been think it maybe a leading indicator to a pump. I know we are all looking for something, anything, that will give us confidences that this market is going UP . I have nothing concrete to point to this idea, my TA tarot cards or crystal ball just a hunch.
Take a look.
So what do you guys think.

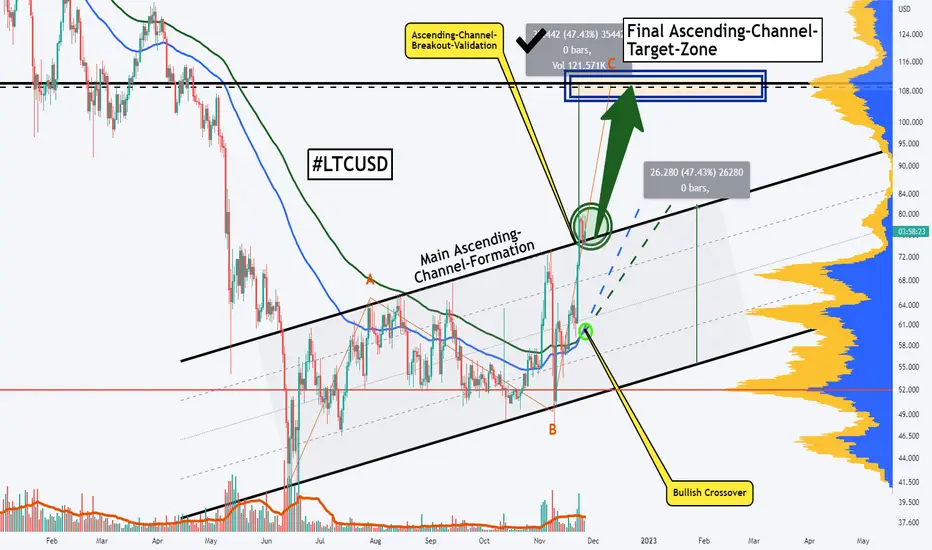
LITECOIN, Huge Channel-Breakout Indicates Further Spikes Ahead!Hello Community,
Welcome to this analysis about Litecoin on the daily timeframe perspective. As I researched the cryptocurrency market recently I found a interesting constellation in Litecoin and the determining factors that add to a scenario with positive implications to emerge. Therefore, as looking on my chart we can watch there Litecoin has emerged with this huge ascending-channel-formation and recently as the 65-EMA in blue crossed above the 100-EMA in green Litecoin manages to build up on this EMA bullish crossover and show up with a final breakout above the upper boundary which means that Litecoin is now about to form a substantial setup from where a continuation is likely. As Litecoin showed up with the final breakout the final targets of this breakout are confirmed as seen in my chart within the 110 USD region, once these are reached it has to be watched out on how Litecoin moves on further after this and if Litecoin has the ability to stay within this area or a pullback follows firstly.
In this manner, thank you everybody for watching, Let's move forward together.
The information provided is only educational and should not be used to take action in the markets.

LTC Elliott Wave count 1W TFI dont think Litecoin ended his correction from the macro view and will turn to the downside soon!
The corrective pattern that I am watching for Litecoin is a wave 2 flat starting from december 2017.
Recently move to the upside may be a 4th wave from an impulse C wave that forms flat pattern.
Also this 4th wave may go to 102 before turns down to end this flat C wave.

Darvas Break-Out: Deceptive SwingsThis High on LTC is difficult to assess. Attempting to validate a Low for a Box with a tool, is necessary; a MacD of the Accumulation/Distribution aided the discovery of a Low. Obviously, the Price Action swung the levels around the new Box.


ltc litecoin 1 week longltc litecoin 1 week long
usdt tether dollar
long here go to the moon
bitcoin crypto

⚖️ Litecoin: Pay attention! (LTC/USD)
An interesting situation.
We've placed the entry points for both scenarios.
Trade safe!

LTC Invalidate and see, Elliott wave. Here is just one of my bearish interpretation. Most would still point down. IF the price crosses $92, I would say the proposed impulse down would be invalidated. I wouldn't be sold on ATH coming soon just yet, though. I think that there is a possibility that this is just a W4 until that line is crossed. Furthermore, I am still looking at longs as well, a bearish chart does not make me a bear. If this move is a motive off of the low, Ideally holding $73 would keep this a W4 on the 1hr. 64.90 is where the impulse up invalidates. If you have found this inspiring/helpful, please consider a boost and follow! Also, check out the links in my signature to get to know me better! Cheers!

Litecoin's Bullish LogicLitecoin Breaks Out of Long-Term Range
opened up the upside
Expected further upside potential
Follow me and take you to achieve wealth freedom

Bottoms ends of ranges and heading into halvening next year LTCHere's an LTC idea with the potential wind at our back with the Aug 2023 halvening event. I tried to post this the other day but something with rules of la casa so wont mention any other websites haha. The bulk of my market participation is using higher time frames and the bigger seasonal or business cycles since I have a full time career and other obligations so this slow and steady approach works for me.
From a TA standpoint we have multiple location criteria, I personally use Fib Retracements but dont discriminate with others to add confluence there. Beyond that I like using volume and macd, and want to see divergence between indicators and price action. A nice Weekly W beyond that is the feather in the cap and essentially what my personal trade plan is looking for to get me to pull the trigger and take my shots.
Conservative WD Gann 50% retracements for targets but once I start to double my investment I start my spoon feeding to take some profits just in case another FTX and ting ting like Sammy Boy show their true colors. In the end its all about risk management and those asymmetric risk windows for me.
Happy Thanksgiving Everyone, especially the moderators ;)
#pmaftw <3

LTCUSD (4H) - Bullish Wave LTFHi Traders
LTCUSD (4H Timeframe)
A High probability, entry signal to go LONG will be given with the upward break of 79.52 after the market found support at 74.95. Only the downward break of 74.95 would cancel the bullish scenario.
Trade details
Entry: 79.52
Stop loss: 74.95
Take profit 1: 88.57
Take profit 2: 96.95
Score: 8
Strategy: Bullish Wave LTF

Litecoin is at an ultimate support zoneLitecoin is at an ultimate support zone. Trading in between its Fibonacci SMA610 and Fibonacci SMA987. Here's levels on the 1-day chart:
52 week high = $413
52 week low = $99
7 day high = $132
7 day low = $113
SMA377 = $181
SMA610 = $141
SMA987 = $111
breakout = $164
R3 = $155
R2 = $146
R1 = $137
pivot = $128
S1 = $119
S2 = $110
S3 = $101
breakdown = $92
Do your own due diligence, your risk is 100% your responsibility. This is for educational and entertainment purposes only. You win some or you learn some. Consider being charitable with some of your profit to help humankind. Good luck and happy trading friends...
*3x lucky 7s of trading*
7pt Trading compass:
Price action, entry/exit
Volume average/direction
Trend, patterns, momentum
Newsworthy current events
Revenue
Earnings
Balance sheet
7 Common mistakes:
+5% portfolio trades, capital risk management
Beware of analyst's motives
Emotions & Opinions
FOMO : bad timing, the market is ruthless, be shrewd
Lack of planning & discipline
Forgetting restraint
Obdurate repetitive errors, no adaptation
7 Important tools:
Trading View app!, Brokerage UI
Accurate indicators & settings
Wide screen monitor/s
Trading log (pencil & graph paper)
Big, organized desk
Reading books, playing chess
Sorted watch-list
Checkout my indicators:
Fibonacci VIP - volume
Fibonacci MA7 - price
pi RSI - trend momentum
TTC - trend channel
AlertiT - notification
tickerTracker - MFI Oscillator
www.tradingview.com

🔥 Litecoin: Predicting The Next Cycle's TopA lot of investors have been looking at LTC over the last couple of days because it's outperforming the market by quite a margin. Furthermore, it's actually holding up quite well whilst BTC has been dropping like a rock as of late.
Below you find my short-term LTC/BTC analysis.
With LTC seeing big gains, I think it's time to take at a long-term perspective. Over the next two years, I think it's a realistic expectation that LTC will move back to the current ATH values of around $400.
LTC is an old token, so it's to be expected that newer more hyped project can see bigger long-term gains. If anything, LTC will survive this bear-market where a lot of alts will struggle and/or die.
On a more positive note, one could argue that LTC is forming a massive 8-12 year bullish triangle pattern, with $400 being the top resistance. A break out from there could easily lead to a big move upwards, but that's still to early to say.

Shan's - Litecoin USD Network Value Model - @masterbtcltcThis chart shows the litecoin price along with network data comparing litecoin to bitcoin such as total address growth ratio, new address growth ratio, transaction ratio, retail ratio, active address ratio along with comparing doge to bitcoin ratio to show that litecoin can level up to these values.
