Litecoin (LTC): Expecting a Good Buy Opportunity Soon | Bullish LTC looks like it's about to break that neckline area so we are waiting for it to happen—as soon as it happens, we are going to get an opportunity for a long!
More in-depth info is in the video—enjoy!
Swallow Academy
Related pairs

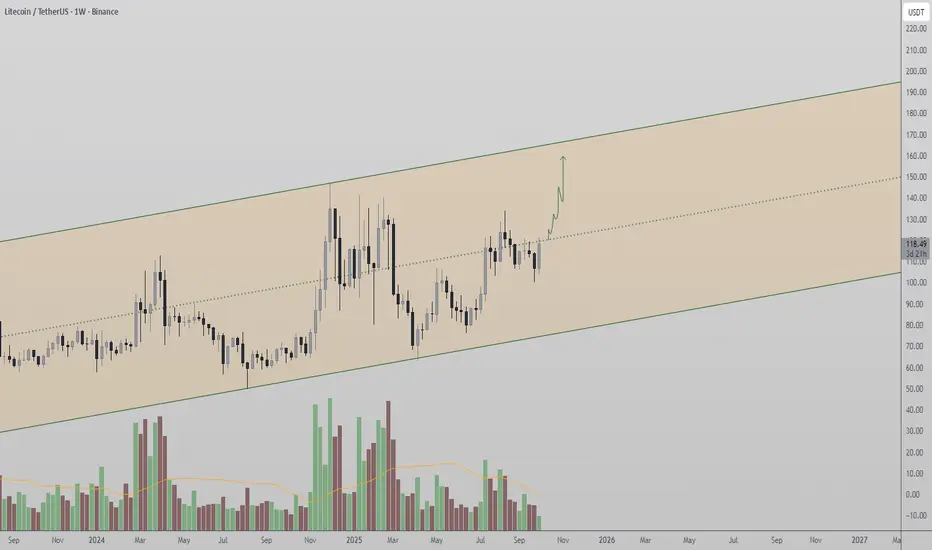
Litecoin Consolidates Within Weekly Channel, Eyes $167 TargetLitecoin remains in a long-term weekly channel and is currently consolidating around its midpoint. Holding above this level increases the probability of an expansion toward $167 resistance.
Litecoin’s price action is developing within a high timeframe channel, with each candle representing a weekly
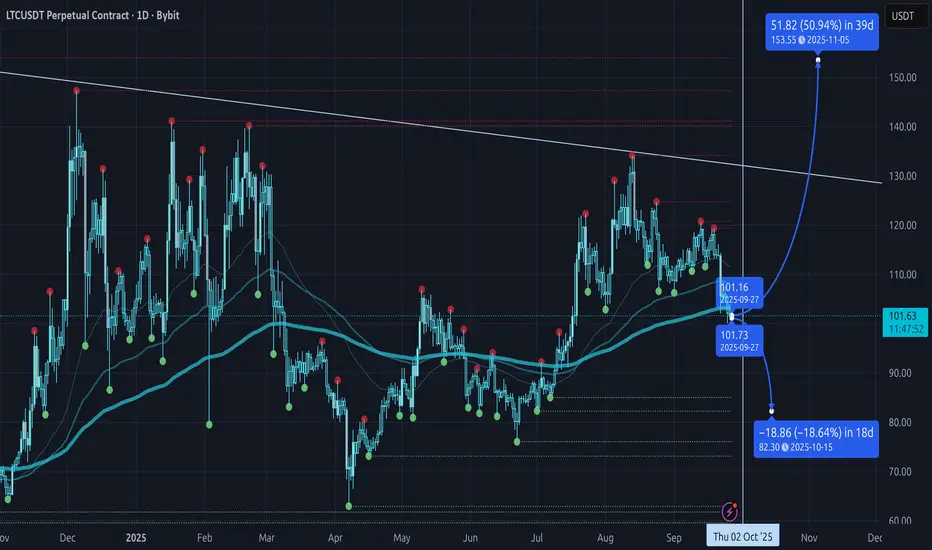
Litecoin Testing Critical Support, 16% Rally Toward $136 Hello✌️
Let’s analyze Litecoin’s price action both technically and fundamentally 📈.
🔍Fundamental analysis:
MEI Pharma became Lite Strategy and put $100M in Litecoin (LTC).
EU rules now make LTC a regulated asset, easing big investors in and cutting sell pressure.
📊Technical analysis:
BI

Litecoin: 200 EMA or Bust — Mean-Reversion vs. ETF HypeLitecoin did what Litecoin always does: ripped on big headlines, went sideways, and then gave most of it back. Around the election/ETF chatter we saw that spike, then the whole move basically round-tripped. CRYPTOCAP:LTC BINANCE:LTCUSDT is a mean-reverting machine—great for quick trades, a pain
LTC/USDT 1h short term 1. The inheritance channel (orange lines) - the course was in the downward trend, but just struck the mountain from the channel. This is a signal of short -term shift Momentum to upward.
2. Horizers of support/resistance (red and green lines):
• Support: 104.64, 103.15, 101.77 - you can see tha

LTC 4H Analysis - Key Triggers Ahead☃️ Welcome to the cryptos winter , I hope you’ve started your day well.
⏰ We’re analyzing LTC on the 4-Hour timeframe .
👀 After the sharp and deep drop that Litecoin experienced in 3 candles, it moved toward its key support in the $102 area and was well supported from this zone. Then it formed a h

Evening market reviewHello traders,
It's been a while since I saw a high-probable set-up shaping up on a top 10 crypto-pair.
Positioned extremely well.
Also a neutral perspective on USD-pairs.
CRYPTO:LTCUSD
FX:USDCHF

#LTC/USDT analysis.Give me some energy !!!#LTC
The price is moving within a descending channel on the 1-hour frame, adhering well to it, and is heading for a strong breakout and retest.
We have a bearish trend on the RSI indicator that is about to be broken and retested, supporting the upside.
There is a major support area (marked in gre

Litecoin (LTC): Really Good Buying Opportunity For July 2025 Litecoin has a really good chance to explode anytime now. We noticed a decent uptrend forming so what we are looking for is a break of that trend and full-scale upward movement!
More in-depth info is in the video—enjoy!
Swallow Academy

LTC/USDT 15 minuteClean BOS followed by heavy displacement down — textbook bearish order flow.
Market’s retracing into stacked FVGs, basically a liquidity magnet.
Sell order sits in a solid zone where inefficient price meets bearish order flow.
The risk: current consolidation could sweep higher into the upper imba

See all ideas
Summarizing what the indicators are suggesting.
Oscillators
Neutral
SellBuy
Strong sellStrong buy
Strong sellSellNeutralBuyStrong buy
Oscillators
Neutral
SellBuy
Strong sellStrong buy
Strong sellSellNeutralBuyStrong buy
Summary
Neutral
SellBuy
Strong sellStrong buy
Strong sellSellNeutralBuyStrong buy
Summary
Neutral
SellBuy
Strong sellStrong buy
Strong sellSellNeutralBuyStrong buy
Summary
Neutral
SellBuy
Strong sellStrong buy
Strong sellSellNeutralBuyStrong buy
Moving Averages
Neutral
SellBuy
Strong sellStrong buy
Strong sellSellNeutralBuyStrong buy
Moving Averages
Neutral
SellBuy
Strong sellStrong buy
Strong sellSellNeutralBuyStrong buy
Displays a symbol's price movements over previous years to identify recurring trends.
Frequently Asked Questions
The current price of LTC3xShort/Tether (LTC) is 0.65594 USDT — it has fallen −2.47% in the past 24 hours. Try placing this info into the context by checking out what coins are also gaining and losing at the moment and seeing LTC price chart.
LTC3xShort/Tether price has fallen by −40.37% over the last week, its month performance shows a −34.10% decrease, and as for the last year, LTC3xShort/Tether has increased by 631.86%. See more dynamics on LTC price chart.
Keep track of coins' changes with our Crypto Coins Heatmap.
Keep track of coins' changes with our Crypto Coins Heatmap.
LTC3xShort/Tether (LTC) reached its highest price on Aug 24, 2025 — it amounted to 197.18391 USDT. Find more insights on the LTC price chart.
See the list of crypto gainers and choose what best fits your strategy.
See the list of crypto gainers and choose what best fits your strategy.
LTC3xShort/Tether (LTC) reached the lowest price of 0.00061 USDT on Jan 19, 2021. View more LTC3xShort/Tether dynamics on the price chart.
See the list of crypto losers to find unexpected opportunities.
See the list of crypto losers to find unexpected opportunities.
The safest choice when buying LTC is to go to a well-known crypto exchange. Some of the popular names are Binance, Coinbase, Kraken. But you'll have to find a reliable broker and create an account first. You can trade LTC right from TradingView charts — just choose a broker and connect to your account.
Crypto markets are famous for their volatility, so one should study all the available stats before adding crypto assets to their portfolio. Very often it's technical analysis that comes in handy. We prepared technical ratings for LTC3xShort/Tether (LTC): today its technical analysis shows the sell signal, and according to the 1 week rating LTC shows the buy signal. And you'd better dig deeper and study 1 month rating too — it's buy. Find inspiration in LTC3xShort/Tether trading ideas and keep track of what's moving crypto markets with our crypto news feed.
LTC3xShort/Tether (LTC) is just as reliable as any other crypto asset — this corner of the world market is highly volatile. Today, for instance, LTC3xShort/Tether is estimated as 4.89% volatile. The only thing it means is that you must prepare and examine all available information before making a decision. And if you're not sure about LTC3xShort/Tether, you can find more inspiration in our curated watchlists.
You can discuss LTC3xShort/Tether (LTC) with other users in our public chats, Minds or in the comments to Ideas.