LINKUSDTPrice has reached the bottom of the wedge, and now it’s time for it to move toward the top of the wedge. This move could take several months to complete.
Related pairs

#LINK Just Broke Down – And This Move Can Get Ugly FastYello Paradisers! Are you really watching #LINKUSDT closely right now, or are you still pretending nothing serious has happened, even though the market has already made its decision? Let's view #ChainLink setup:
💎#LINK has already confirmed a bearish breakdown from the symmetrical triangle structur

LINK can touch upper targets 20% gain toward 10$HI
after huge correction to the downside now some green candlesticks for continuing the process or reverse is logical i can see at least 120% gain toward 10$ for LINK

Link Roadmap (3D)Link is about to make a copy-paste move.
Examine the left part and the picture becomes way more clear.
Currently, all the market is signaling down. Link is not amongs the exeptions.
Weekly demand zone will hold for a while but in the mean time it's also a target.
Yes, all the news for Chainlink i

$LINK on Radar Buy on Gray Box Reclaim! BIST:LINK is on my radar. I’ll buy on Gray Box Reclaim, InshaAllah.
Set alerts and remind me when it happens.

LINK – Retracement into Key Support | Long Spot SetupChainlink has retraced into a major support zone, offering a potential opportunity for a long spot position. This area ($8.50–$9.50) has held well in the past and could act as a base for the next leg up, especially if broader market sentiment improves.
🛠 Strategy Setup:
Entry (Ladder In): $8.50 –

#LINK Crash Incoming? Why strong support always Weak...
Yello Paradisers! Did you catch the early signs of this breakdown, or are you still stuck in the trap? As we warned in our previous market commentaries, #LINKUSDT was setting up for a deeper move — and now the chart is confirming that view.
💎After a clean rejection from the trendline resistance, #

Chain link short to $11.36 todayJust opened a new short on #chainlink
🛑Sl: $12.1
🎯tp: $11.36
💰2RR trade
#link

Chainlink (LINK): Too Many Sell-side Liquidity Sweeps | Longing?Sellers have been taking a lot of liquidity on LINK where price is still moving inside these “liquidity sweep” zones.
What we are looking for here is an exit from this zone, which most likely will happen (just like it has the last few times). So what we expect is a simple bounce toward the upper re

#LINK/USDT#LINK
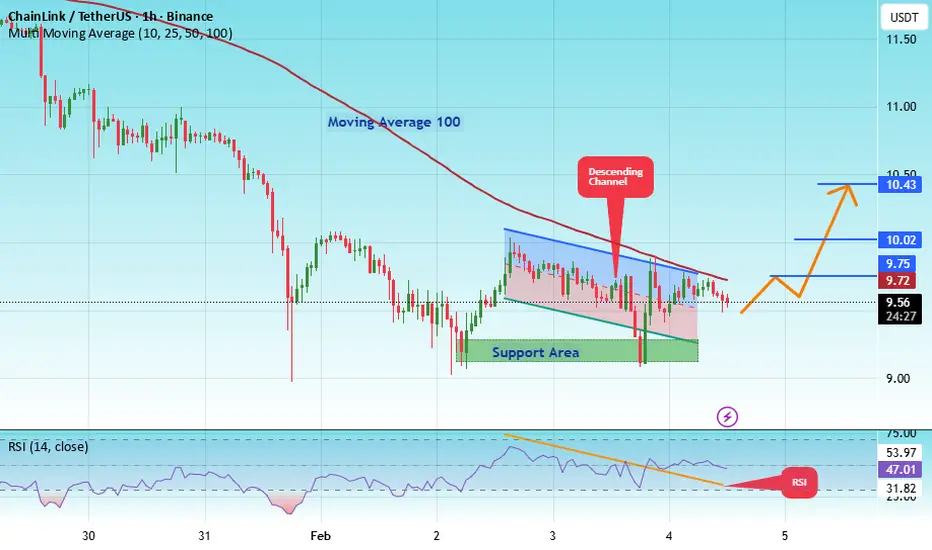
The price is moving within a descending channel on the hourly timeframe. It has reached the lower boundary and is heading towards a breakout, with a retest of the upper boundary expected.
The Relative Strength Index (RSI) is showing a downward trend, approaching the lower boundary, and an up
See all ideas
Summarizing what the indicators are suggesting.
Oscillators
Neutral
SellBuy
Strong sellStrong buy
Strong sellSellNeutralBuyStrong buy
Oscillators
Neutral
SellBuy
Strong sellStrong buy
Strong sellSellNeutralBuyStrong buy
Summary
Neutral
SellBuy
Strong sellStrong buy
Strong sellSellNeutralBuyStrong buy
Summary
Neutral
SellBuy
Strong sellStrong buy
Strong sellSellNeutralBuyStrong buy
Summary
Neutral
SellBuy
Strong sellStrong buy
Strong sellSellNeutralBuyStrong buy
Moving Averages
Neutral
SellBuy
Strong sellStrong buy
Strong sellSellNeutralBuyStrong buy
Moving Averages
Neutral
SellBuy
Strong sellStrong buy
Strong sellSellNeutralBuyStrong buy
Displays a symbol's price movements over previous years to identify recurring trends.
Frequently Asked Questions
The current price of ChainLink / TetherUS (LINK) is 8.43 USDT — it has risen 1.08% in the past 24 hours. Try placing this info into the context by checking out what coins are also gaining and losing at the moment and seeing LINK price chart.
ChainLink / TetherUS price has fallen by −9.18% over the last week, its month performance shows a −35.70% decrease, and as for the last year, ChainLink / TetherUS has decreased by −54.80%. See more dynamics on LINK price chart.
Keep track of coins' changes with our Crypto Coins Heatmap.
Keep track of coins' changes with our Crypto Coins Heatmap.
ChainLink / TetherUS (LINK) reached its highest price on May 10, 2021 — it amounted to 53.00 USDT. Find more insights on the LINK price chart.
See the list of crypto gainers and choose what best fits your strategy.
See the list of crypto gainers and choose what best fits your strategy.
ChainLink / TetherUS (LINK) reached the lowest price of 0.35 USDT on Jan 28, 2019. View more ChainLink / TetherUS dynamics on the price chart.
See the list of crypto losers to find unexpected opportunities.
See the list of crypto losers to find unexpected opportunities.
The safest choice when buying LINK is to go to a well-known crypto exchange. Some of the popular names are Binance, Coinbase, Kraken. But you'll have to find a reliable broker and create an account first. You can trade LINK right from TradingView charts — just choose a broker and connect to your account.
Crypto markets are famous for their volatility, so one should study all the available stats before adding crypto assets to their portfolio. Very often it's technical analysis that comes in handy. We prepared technical ratings for ChainLink / TetherUS (LINK): today its technical analysis shows the sell signal, and according to the 1 week rating LINK shows the sell signal. And you'd better dig deeper and study 1 month rating too — it's strong sell. Find inspiration in ChainLink / TetherUS trading ideas and keep track of what's moving crypto markets with our crypto news feed.
ChainLink / TetherUS (LINK) is just as reliable as any other crypto asset — this corner of the world market is highly volatile. Today, for instance, ChainLink / TetherUS is estimated as 2.40% volatile. The only thing it means is that you must prepare and examine all available information before making a decision. And if you're not sure about ChainLink / TetherUS, you can find more inspiration in our curated watchlists.
You can discuss ChainLink / TetherUS (LINK) with other users in our public chats, Minds or in the comments to Ideas.