
Decentraland (mana) Decentraland token
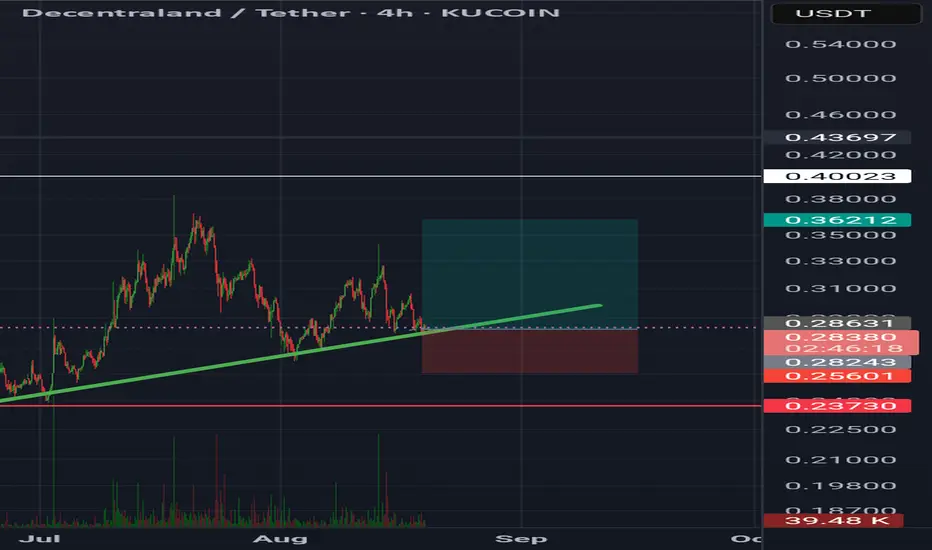
Mana usdt daily analysis
Time frame 4hours
Risk rewards ratio >3 👈👌
Target
Mana has unacceptable behaviour in crypto market and couldn't break it's resistance line for months.
I don't like this token but I guess here is a good place to open a position and take a good benefit
MANAUSDT Forming Bullish MomentumMANAUSDT is currently displaying a strong bullish momentum pattern, indicating that buyers are gradually taking control of the market. This shift in sentiment suggests that the coin may be entering a new uptrend phase, with steady accumulation happening around key support levels. The presence of goo

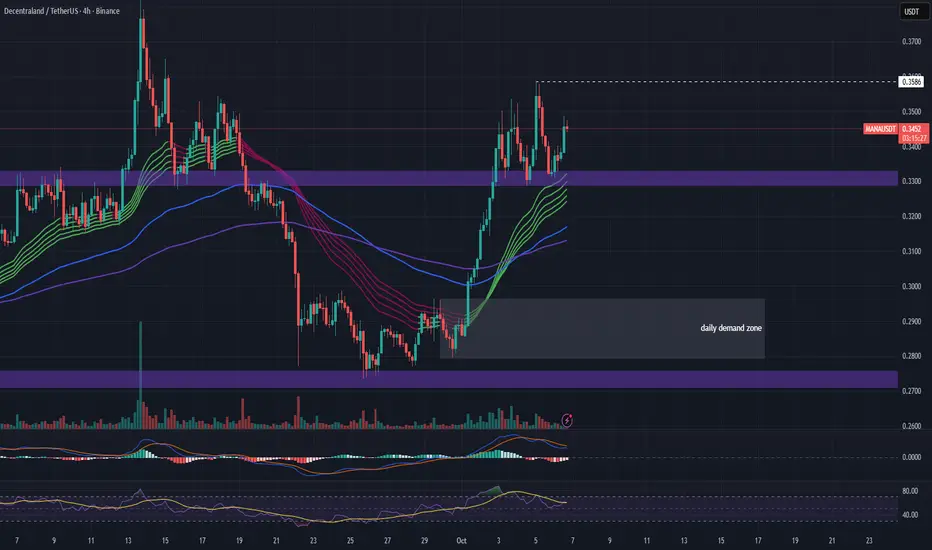
#MANAUSDT 4H ChartPrice retested the support at $0.33 where it bounced from. MACD is showing bearish weakness, RSI is bought and EMAs are bullish. Price is expected to keep pushing up aiming to liquidate the high at $0.3586 as a short-term target.
MANACurrent Market Reality Check
MANAUSDT is currently trading at $0.2896 (September 22, 2025), showing a 7.66% recovery from recent lows of $0.2690. The token has demonstrated resilience with recent trading volume of approximately $37-51 million, indicating active institutional interest.
Institutional

MANA is Ready for 120 % Up Move MANA is making a Triangle pattern at Support zone and It is Ready for Breakout from that pattern . and at the same time Altcoin Season Index is at 74 , when it is >75 it is sign of very bullish in altcoins and Breakouts will have very high potential to give a big move .
and at the same time Bitcoin

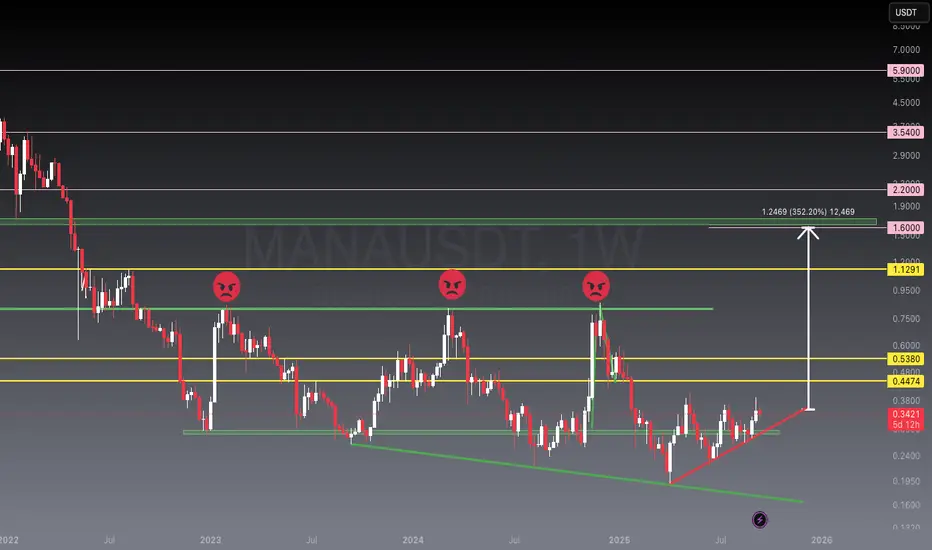
MANAUSDT – 352% Potential Upside ScenarioMANA has entered an uptrend after bouncing from strong support. The 0.80 resistance zone, which rejected price 3 times before, now shows potential to be broken with a strong candle. Key targets ahead are 0.4474 – 0.5380 – 1.1291, while the mid-to-long term range sits at 1.60 – 2.20. This indicates a
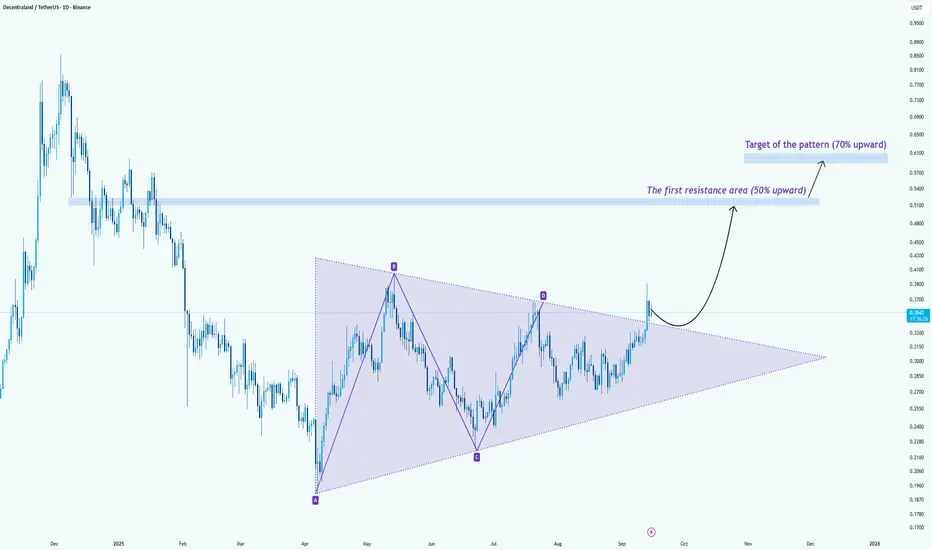
#MANA/USDT –> Symmetrical Triangle Breakout#MANA
The price is moving within a descending channel on the 1-hour frame, adhering well to it, and is heading for a strong breakout and retest.
We have a bearish trend on the RSI indicator that is about to be broken and retested, which supports the upward breakout.
There is a major support area

MANA/USDT –> Symmetrical Triangle BreakoutHello guys!
MANA has been consolidating inside a large symmetrical triangle for months, and now it looks like the price is finally breaking out to the upside. This could be the beginning of a strong bullish leg.
Key Points:
The breakout happened with solid momentum, confirming bulls are st
ManausdEvery time the price is above the red line it goes up to the 0.80 resistance I think mana will go up as soon as this resistance is broken Macd looks bullish I think next week rate cuts will send the crypto market to new highs

See all ideas
Summarizing what the indicators are suggesting.
Oscillators
Neutral
SellBuy
Strong sellStrong buy
Strong sellSellNeutralBuyStrong buy
Oscillators
Neutral
SellBuy
Strong sellStrong buy
Strong sellSellNeutralBuyStrong buy
Summary
Neutral
SellBuy
Strong sellStrong buy
Strong sellSellNeutralBuyStrong buy
Summary
Neutral
SellBuy
Strong sellStrong buy
Strong sellSellNeutralBuyStrong buy
Summary
Neutral
SellBuy
Strong sellStrong buy
Strong sellSellNeutralBuyStrong buy
Moving Averages
Neutral
SellBuy
Strong sellStrong buy
Strong sellSellNeutralBuyStrong buy
Moving Averages
Neutral
SellBuy
Strong sellStrong buy
Strong sellSellNeutralBuyStrong buy
Displays a symbol's price movements over previous years to identify recurring trends.