Trade ideas

Decentraland (mana) Decentraland token
Mana usdt daily analysis
Time frame 4hours
Risk rewards ratio >3 👈👌
Target
Mana has unacceptable behaviour in crypto market and couldn't break it's resistance line for months.
I don't like this token but I guess here is a good place to open a position and take a good benefit
#MANAUSDT 4H ChartPrice retested the support at $0.33 where it bounced from. MACD is showing bearish weakness, RSI is bought and EMAs are bullish. Price is expected to keep pushing up aiming to liquidate the high at $0.3586 as a short-term target.
MANAUSDT Forming Bullish MomentumMANAUSDT is currently displaying a strong bullish momentum pattern, indicating that buyers are gradually taking control of the market. This shift in sentiment suggests that the coin may be entering a new uptrend phase, with steady accumulation happening around key support levels. The presence of good trading volume further confirms that this momentum is backed by active participation from investors, making the current move more reliable.
Technical indicators point toward a continuation of this bullish phase, where MANA could potentially deliver a gain of around 40% to 50% in the short to medium term. Such momentum patterns often act as early signals of extended rallies, especially when supported by healthy volume. Traders are closely watching breakout zones, as once price clears resistance levels, a strong surge could follow.
Investor confidence in MANA is also growing, adding to the bullish sentiment. With the metaverse narrative still holding long-term potential, many market participants see MANA as a project with strong upside prospects. If current momentum continues, the pair could quickly test higher resistance levels and attract even more buying pressure.
✅ Show your support by hitting the like button and
✅ Leaving a comment below! (What is You opinion about this Coin)
Your feedback and engagement keep me inspired to share more insightful market analysis with you!

MANACurrent Market Reality Check
MANAUSDT is currently trading at $0.2896 (September 22, 2025), showing a 7.66% recovery from recent lows of $0.2690. The token has demonstrated resilience with recent trading volume of approximately $37-51 million, indicating active institutional interest.
Institutional Buy Wall Analysis
Analysis of current order book data reveals significant institutional accumulation zones:
Primary Buy Wall Clusters:
$0.2750-$0.2850: Very strong institutional buying with high volume confirmation
$0.2600-$0.2700: Strong whale accumulation zone based on recent transactions
$0.2400-$0.2500: Moderate institutional interest for deeper entries
Stop: $0.2600
Take profit
0.2950
0.30
0.3200
0.3500
0.4

MANA is Ready for 120 % Up Move MANA is making a Triangle pattern at Support zone and It is Ready for Breakout from that pattern . and at the same time Altcoin Season Index is at 74 , when it is >75 it is sign of very bullish in altcoins and Breakouts will have very high potential to give a big move .
and at the same time Bitcoin dominance is decreasing and altcoins dominance is started increasing , so look on all the altcoins
and follow proper risk management , it has very good chances to move UP side but first we have to protect the down side , where risk management comes into game .
Follow for more Ideas and potential coins/ Stocks .

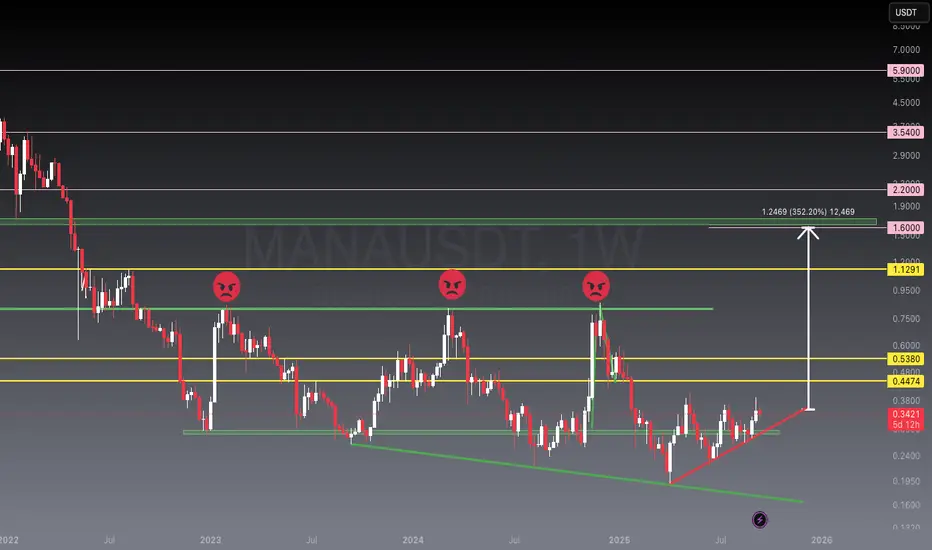
MANAUSDT – 352% Potential Upside ScenarioMANA has entered an uptrend after bouncing from strong support. The 0.80 resistance zone, which rejected price 3 times before, now shows potential to be broken with a strong candle. Key targets ahead are 0.4474 – 0.5380 – 1.1291, while the mid-to-long term range sits at 1.60 – 2.20. This indicates a possible 352% upside potential.
Target 1.60$
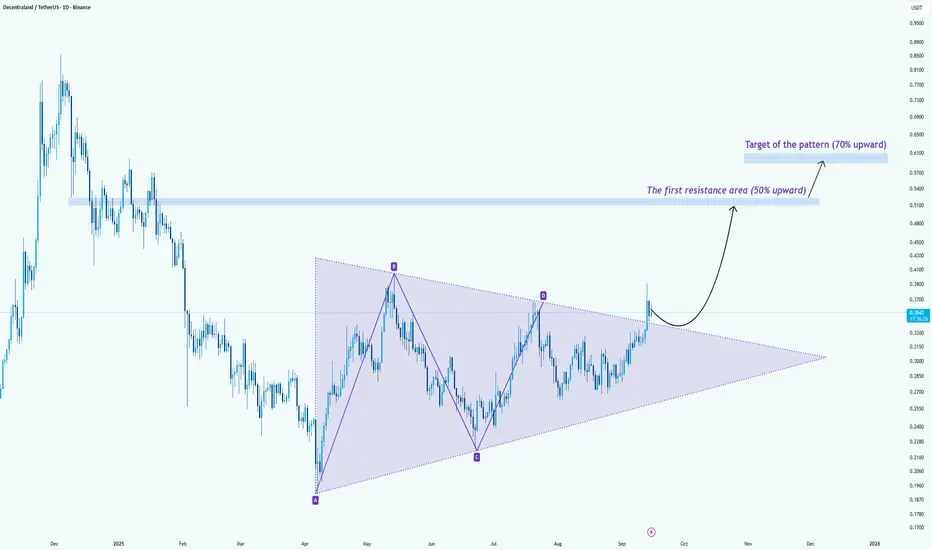
#MANA/USDT –> Symmetrical Triangle Breakout#MANA
The price is moving within a descending channel on the 1-hour frame, adhering well to it, and is heading for a strong breakout and retest.
We have a bearish trend on the RSI indicator that is about to be broken and retested, which supports the upward breakout.
There is a major support area in green at 0.3250, representing a strong support point.
We are heading for consolidation above the 100 moving average.
Entry price: 0.3391
First target: 0.3458
Second target: 0.3560
Third target: 0.3668
Don't forget a simple matter: capital management.
When you reach the first target, save some money and then change your stop-loss order to an entry order.
For inquiries, please leave a comment.
Thank you.

MANA/USDT –> Symmetrical Triangle BreakoutHello guys!
MANA has been consolidating inside a large symmetrical triangle for months, and now it looks like the price is finally breaking out to the upside. This could be the beginning of a strong bullish leg.
Key Points:
The breakout happened with solid momentum, confirming bulls are stepping back in.
The first resistance level is expected to be around $0.50–$0.52, which represents a roughly 50% increase from current levels.
If the price clears that zone, the measured move of the pattern points toward $0.60–$0.62, approximately 70% higher than the breakout.
Bullish Scenario:
As long as the price stays above the breakout level (~$0.26–$0.24), the bias remains bullish. Buyers could look for continuation toward the targets mentioned.
💥 Invalidation:
A drop back inside the triangle below $0.24 would invalidate the breakout and put the bullish setup at risk.
Conclusion:
MANA has finally broken out of its long consolidation. If momentum holds, there’s room for a 50–70% rally in the coming weeks.
ManausdEvery time the price is above the red line it goes up to the 0.80 resistance I think mana will go up as soon as this resistance is broken Macd looks bullish I think next week rate cuts will send the crypto market to new highs

MANA Faces Resistance at 38 Cents With Key Break PendingMana’s recent rally has paused at an important daily resistance. The level’s historical rejection highlights the need for conviction before upside can resume.
Key Technical Points:
- Daily resistance at $0.38 tested again.
- Breakout requires influx of strong bullish volume.
- Next resistance aligns with value area high and 0.618 Fibonacci.
Price action has met resistance at $0.38, the same zone that rejected a prior rally. The retest is significant — if broken with momentum, it would flip a major barrier into support and open the path toward higher levels.
The next target lies at the value area high, which also aligns with the 0.618 Fibonacci retracement. This confluence makes it a high-probability zone for sellers to defend, reinforcing the importance of strong volume to drive through.
Currently, momentum is building, but confirmation will come only from a sustained breakout above $0.38. Without that, MANA risks further consolidation below resistance.
What to Expect in the Coming Price Action:
Traders should watch for a decisive breakout above $0.38. If backed by volume, the path opens toward higher-timeframe resistance. Failure here would keep MANA consolidating beneath resistance until more demand emerges.

MANA Eyes 0.75 After Strong Bounce$MANA/USDT is bouncing from a strong confluence zone, where the support area lines up with the rising trendline. This reaction shows buyers are stepping in to defend the structure.
If momentum continues, price has room to push higher toward the 0.75 level and possibly beyond, as long as it holds above support.
In simple terms: the confluence bounce is a bullish signal, and upside targets remain in play if momentum stays intact.
DYOR, NFA
#PEACE
Stay tuned for more update - follow us on Trading View

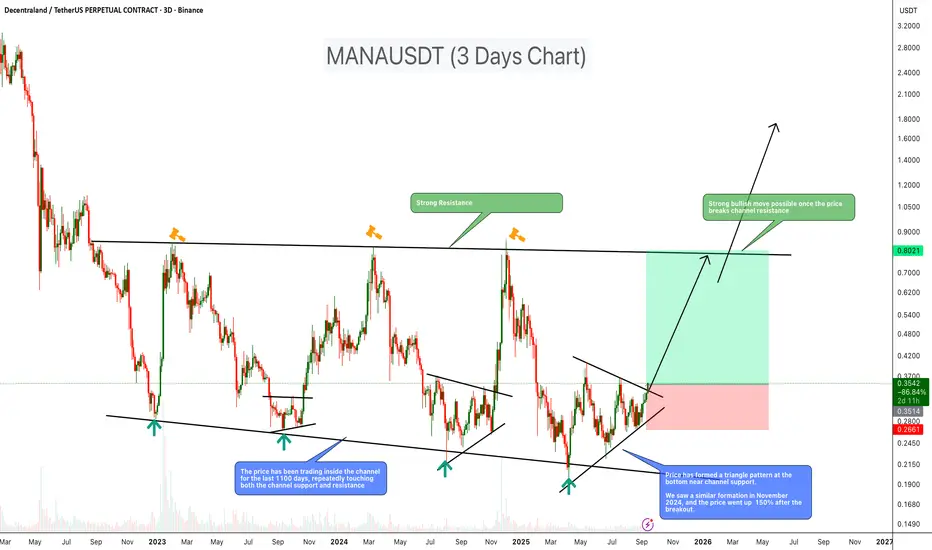
MANA About to Explode? 3-Year Channel Breakout Ahead!MANA has been consolidating inside a large descending channel for over 1100 days, consistently respecting both support and resistance levels. Recently, price formed a triangle pattern near channel support, a setup similar to Nov 2024, when MANA rallied over 150% after a breakout. This suggests a potential strong bullish move if resistance breaks.
Key Points
- Price has traded inside the channel for ~3 years
- Strong resistance around $0.80
- Triangle pattern formed near the channel bottom support
- A previous similar setup led to a sharp rally
- Breakout could open doors for a mid-term bullish trend
Trade Setup
Entry: $0.35
Stop-loss: Below $0.26
Targets:
First target: $0.75
Second target: $1.60
Cheers
Hexa
#MANA/USDT Situation, A Comprehensive Analysis !!!#MANA
The price is moving within a descending channel on the 1-hour frame, adhering well to it, and is heading for a strong breakout and retest.
We have a bearish trend on the RSI indicator that is about to be broken and retested, supporting the upside.
There is a major support area (in green) at 0.2617, which represents a strong basis for the upside.
For inquiries, please leave a comment.
We are in a consolidation trend above the 100 moving average.
Entry price: 0.2823
First target: 0.3000
Second target: 0.3133
Third target: 0.3331
Don't forget a simple matter: capital management.
When you reach the first target, save some money and then change your stop-loss order to an entry order.
For inquiries, please leave a comment.
Thank you.

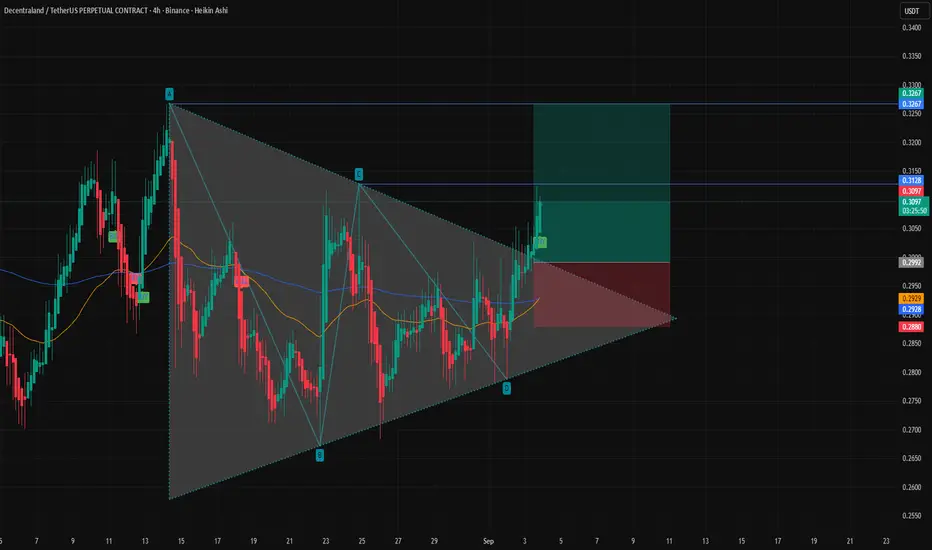
Technical Analysis Of Manausdt 4H🔎 Technical Analysis
1. Chart Pattern
Price has been trading inside a symmetrical triangle (A–B–C–D formation).
Recently, it broke out to the upside, signaling a possible bullish continuation.
Breakout candles are supported by green Heikin Ashi momentum, confirming buying pressure.
2. Key Levels
Immediate Support: 0.2950 – 0.2920 (200 EMA + triangle base support).
Current Price Zone: 0.3090 – 0.3100 (post-breakout).
Resistance Levels:
0.3128 → First hurdle (just tested).
0.3267 → Next upside target.
0.3400+ → Extended bullish target if momentum continues.
3. Indicators
EMA Trend:
50 EMA (yellow) crossing above 200 EMA (blue) → Golden Cross setup, bullish bias.
Volume (not shown but inferred): Breakouts from triangles usually need volume; if confirmed, breakout has strength.
4. Potential Scenarios
Bullish Case (High Probability):
Price sustains above 0.3128, pushes toward 0.3267, and possibly 0.3400.
Bearish Case (Low Probability):
If price fails to hold 0.3000–0.2950, it could fall back into the triangle and retest 0.2920.
5. Trading Plan
Entry (Aggressive): Current levels (0.3090–0.3100) on pullbacks.
Entry (Conservative): Wait for 4H candle close above 0.3128.
Stop Loss: Below 0.2950 (triangle support + 200 EMA).
Targets:
TP1 → 0.3128
TP2 → 0.3267
TP3 → 0.3400
✅ Summary:
MANA/USDT has broken out of a symmetrical triangle on the 4H chart with bullish EMA structure. As long as price stays above 0.2950, bias remains bullish with targets at 0.3128 → 0.3267 → 0.3400. Failure to hold above 0.2950 would invalidate the breakout.
MANAUSDT — Balancing Above 0.30, Testing the CeilingMANA price has been pressing the 0.32–0.33 ceiling like a gamer grinding a laggy joystick — stubborn, but it just might break through.
High Timeframes (Weekly → 2D → 12H)
– Weekly: Supply 0.34–0.38, demand 0.28–0.30. Lose it → 0.24–0.26.
– 2D: HLs since April, capped under 0.34–0.35. Resistance 0.33–0.34, 0.35–0.36. Support 0.31–0.312 → 0.30 → 0.285–0.29.
– 12H: Range 0.30–0.33. Close >0.334 = 0.345–0.353. Close <0.312 = 0.30 → 0.29.
Orderflow / Profile
– POC ~0.30.
– VAL ~0.295–0.298; VAH ~0.325–0.327.
– Price above POC but capped under VAH. Clean acceptance above 0.327 opens 0.34–0.35.
Derivatives
– OI grinding higher.
– Funding flat.
– CVD down on month but ticking up in recent sessions.
– Liquidations light.
Conclusion
MANA is balanced-to-bid, sitting above POC with improving short-term flow. Above 0.334 = 0.345–0.353. Lose 0.312 = mean reversion to 0.30, extension 0.29.
💡 Pro Tip: When price sits inside value but leans upward, range-trading bots can clip steady profits on swings while waiting for the breakout.
Candle Craft | Signal. Structure. Execution.

MANA (SPOT)BINANCE:MANAUSDT
#MANA / USDT
Entry range (0.2770- 0.3200)
SL 1D close below 0.2670
T1 0.42
T2 0.55
T1 0.72
T2 1.00
Extra Target is optional 1.30
_______________________________________________________
Golden Advices.
********************
* collect the coin slowly in the entry range.
* Please calculate your losses before the entry.
* Do not enter any trade you find it not suitable for you.
* No FOMO - No Rush , it is a long journey.

MANAUSDT 1D#MANA is moving within a symmetrical triangle on the daily chart. A retest of the daily SMA50 is expected before the next leg up. If it breaks out above the triangle resistance, the targets are:
🎯 $0.3759
🎯 $0.4197
🎯 $0.4820
🎯 $0.5614
⚠️ Always remember to use a tight stop-loss and follow proper risk management.

MANAUSDT UPDATE#MANA
UPDATE
MANA Technical Setup
Pattern : Bullish Falling Wedge Pattern
Current Price: $0.3139
Target Price: $0.63
Target % Gain: 105.71%
Technical Analysis: MANA has broken out of a long-term falling wedge on the 1D chart, signaling strong bullish reversal potential. Price action shows breakout confirmation, and momentum suggests buyers stepping in for a move toward $0.63.
Time Frame: 1D
Risk Management Tip: Always use proper risk management.

MANA/USDT – Calm Before the StormMANA/USDT is showing bullish price action, with structure suggesting that current consolidation may be the calm before the storm. The market appears to be preparing for a large rally, with momentum quietly building beneath the surface.
The most strategic approach here is to DCA within the green box if necessary , securing the best possible entries before the breakout acceleration.

MANA 1D Analysis | Key Triggers Ahead💀 Hey , how's it going ? Come over here — Satoshi got something for you !
⏰ We’re analyzing MKR on the 1-Day timeframe timeframe .
👀 On the daily timeframe of MANA, we can see that the coin is inside a compression with a triangle pattern. With the daily candle open, it is moving upward, and the reason for this is the clearing of sellers’ orders. MANA currently has a very important resistance at the $0.2995 area, which is considered a major resistance in the multi-timeframe view.
⚙️ Looking at MANA’s volatility, on the daily timeframe it is positioned above the 50 level and has a key resistance at the 54.25 area. If the oscillator crosses this level, MANA can build a higher low compared to its previous lows.
🕯 The number and size of red candles inside this triangle are much greater than the green ones, and to break out of this pattern and compression, we need more green candles in the multi-timeframe, especially on the 4-hour chart. If you zoom in on the chart, the 4-hour candles and patterns will display more clearly.
💰 On the daily timeframe of MANABTC, we can see that in the past 3 days, its trading volume and volatility have increased. A Fibonacci has been drawn from the breakout area to the corrective bottom, and with a breakout of the 0.38 Fib level, it can once again move upward.
🔔 The alert zones we have considered are the $0.274 area and the $0.3015 area. Based on price action in these zones, we can make the best trading decisions. Note that MANA has an important chart compared to Bitcoin, so be sure to check that chart as well.
❤️ Disclaimer : This analysis is purely based on my personal opinion and I only trade if the stated triggers are activated .

#MANAUSDT We are seeing similar movement patterns.
Previous times, there have been beautiful growths by breaking the strong black resistance line and forming a blue compression pattern.
Crossing the golden arrow was a golden opportunity.
We are waiting for another golden opportunity by crossing the last golden arrow

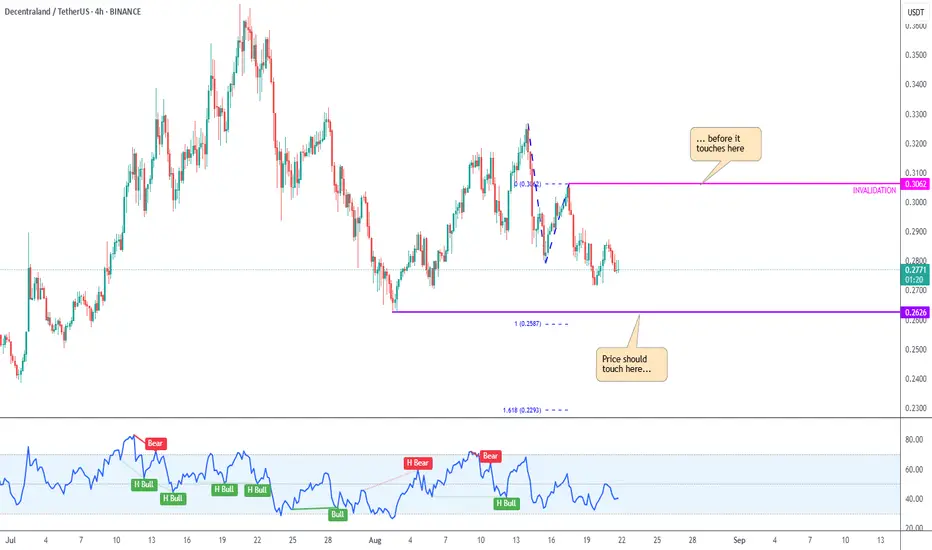
MANA/USDT: Expecting a retest of supportMANA remains in a downtrend, with no clear signs of reversal yet.
Further downside is expected, targeting a retest of 0.2626 before a possible higher high above 0.3062.
No bullish RSI divergence appeared on the August low, reducing the chances of an immediate recovery.
Bearish RSI divergence was present on the August high, reinforcing the bearish outlook.
A potential 100% extension points to 0.2587 as a strong downside projection level.