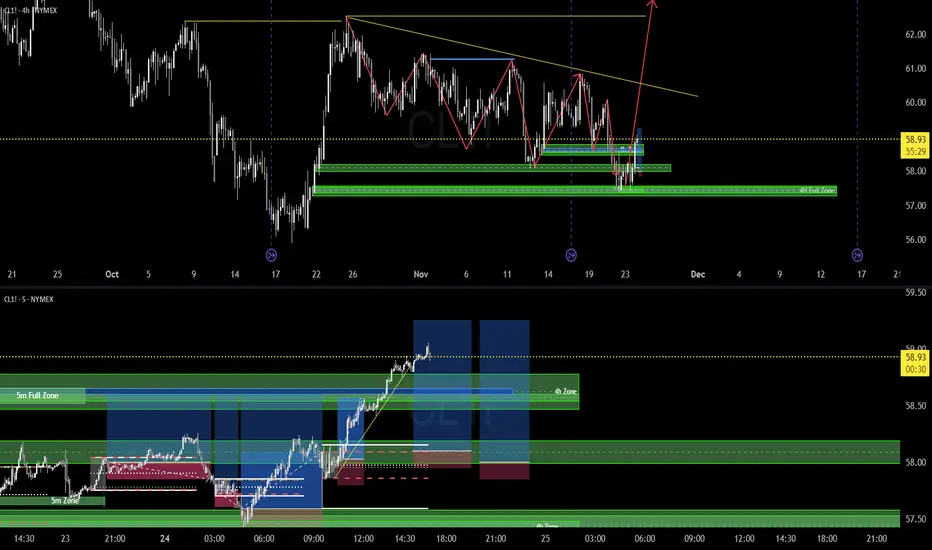
5m & 4H Supply and Demand Short - CLLooks like Price (CL!) is getting to a support area based on the 4H chart (zoom out).
So, I've mapped a daily gap, 4H zone, for a quick short.
There are double bottoms way down around 58.27, so keep an eye out as this 4H trend has got to get swiped.
Crude Oil Futures
Market insights

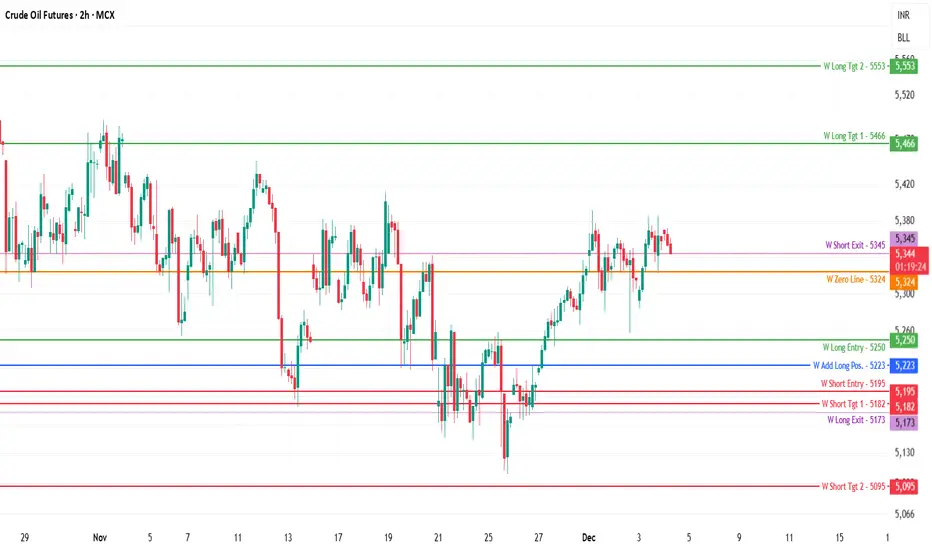
Crude Oil MCX Future - Weekly Technical Analysis - 01 -05 Dec.MCX:CRUDEOIL1!
Crude Oil MCX Futures — Chart Pathik Weekly Levels for 01–05 Dec. 2025
(If these levels add value to your trades, a quick boost or comment goes a long way in supporting this free content and keeping our trading community thriving!)
Crude Oil Futures are trading around 5,345, consolidating just above the Weekly Zero Line at 5,324 and near the W Short Exit band at 5,345, reflecting a pause after a strong recovery from sub‑5,150 levels. Price is holding higher lows on the 2h framework, keeping the broader weekly bias mildly bullish while testing an important supply zone.
Weekly Bullish Structure
Weekly long bias remains active above the W Long Entry level at 5,250 and the W Add Long Position zone at 5,223, where prior demand and breakout structure align.
Upside reference targets stand at 5,466 (W Long Target 1) and 5,553 (W Long Target 2), marking positional booking areas if crude sustains above the Zero Line and builds higher highs.
Control: Positional longs can trail or define risk below the W Long Exit at 5,173 and more structurally below 5,223, where the weekly bullish structure begins to weaken.
Weekly Bearish Structure
If price slips back below 5,223 and fails to reclaim 5,250, focus shifts to the W Short Entry zone near 5,195, where breakdown retests can invite fresh selling pressure.
Downside weekly targets lie at 5,182 (W Short Target 1) and 5,095 (W Short Target 2), providing zones for swing short profit booking if weakness extends.
Control: Bears must stay cautious on any strong reclaim above 5,324–5,345, where failed breakdowns can flip into a squeeze towards the weekly long targets.
Neutral & Trading Plan Context
5,324 is the Weekly Zero Line pivot—while crude trades between roughly 5,250 and 5,345, expect choppy mean‑reversion swings rather than a clean directional trend, favouring tactical buys near support and profit booking near resistance.
Use these weekly levels to frame intraday entries, exits, and trailing logic—let the chart define structure and risk, not emotions.
Boost or comment if these weekly levels support your preparation—help Chart Pathik keep delivering structured, high-quality analysis to more MCX traders!
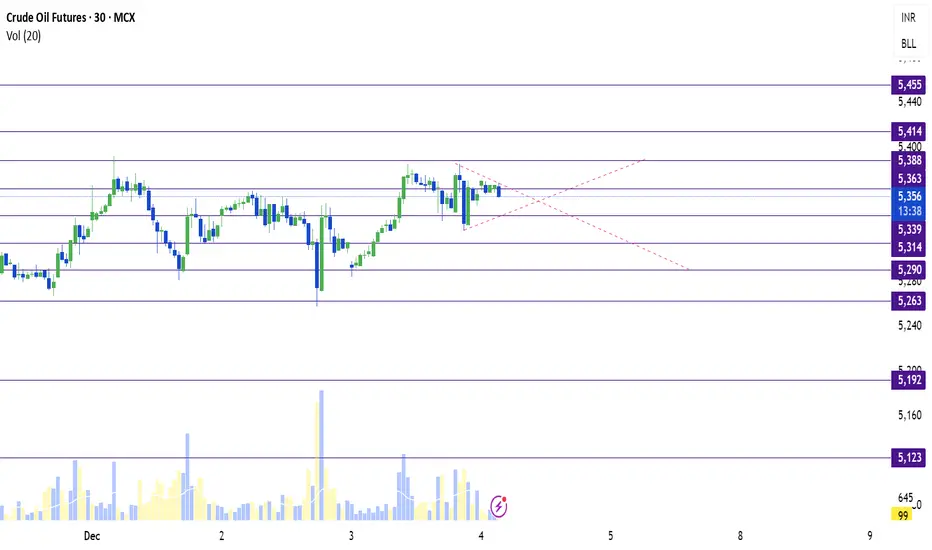
USOIL SUPPORT, RESISTANCE & TRENDLINE ANALYSISGood Morning guyzzz!!
Go "LONG" if it stays above 5363 with 5388 as the first target and if it stays above that then go for 5414.
Go "SHORT" if it breaks 5363 and sustains below with 5339 as the first target and staying below that might lead to 5315 and below that might lead to 5290 and for the extremes but caution it might lead to 5263, 5291 & 5123.
Note: Keep a track of the trendline as well.
CRUDE OILDO YOU KNOW WHATS BEHIND THIS OR OTHER IDEAS?? in bio..
Preferably suitable for scalping and accurate as long as you watch carefully the price action with the drawn areas.
With your likes and comments, you give me enough energy to provide the best analysis on an ongoing basis.
And if you needed any analysis that was not on the page, you can ask me with a comment or a personal message.
Enjoy Trading ;)

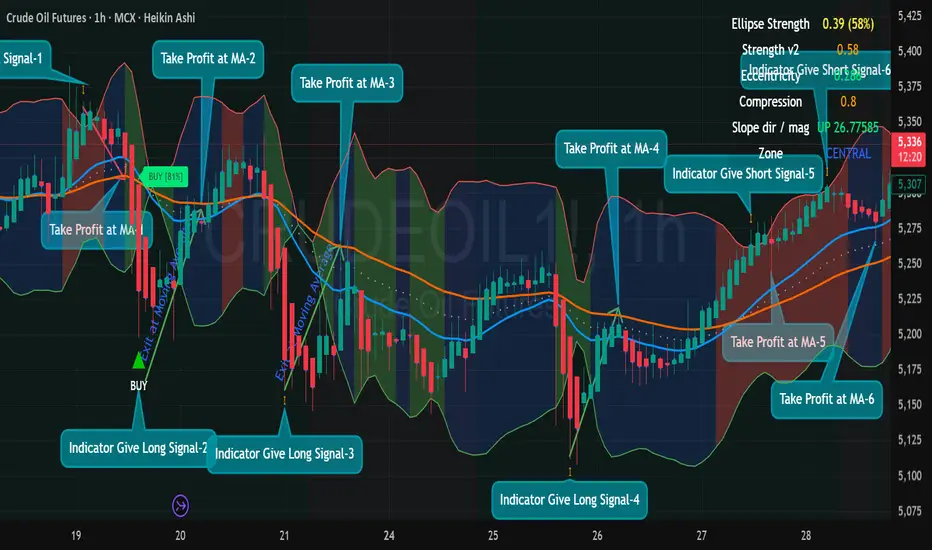
6 Back-to-Back Winning Trades Using Ellipse Price Action.6 Back-to-Back Winning Trades Using Ellipse Price Action Indicator (Crude Oil · 1H)
Ellipse Price Action Indicator captured 6 clean winning entries on MCX Crude Oil (1-Hour).
The system is simple:
✔ Indicator gives Buy/Sell Signal (Green/Red Triangle or Orange Arrow)
✔ Take entry only when price is outside the Ellipse boundary
✔ Exit strictly at the Moving Average (MA)
✔ Never trade in the middle zone or when price is sitting on the MA
✔ Follow stop loss at opposite side of the ellipse
Trade-by-Trade Breakdown
1.🔻 Signal-1 → Short Entry → WIN
Indicator gave Short Signal-1 at ellipse top
Price dropped smoothly
Take Profit at MA for Trade-1
✔ Clean reversal trade
2.🟢 Signal-2 → Long Entry → WIN
Oversold conditions + indicator gave Long Signal-2
Strong bounce from lower ellipse
Exit at Moving Average for trade-2
✔ System worked beautifully — TP hit immediately
3.🟢 Signal-3 → Long Entry → WIN
Price again touched lower ellipse
Indicator gave Long Signal-3
Clean breakout candle
Take Profit at MA for trade-3
✔ Another textbook reversal
4.🟢 Signal-4 → Long Entry → WIN
Third buying zone from ellipse bottom
Long Signal-4 triggered
Strong continuation move
Take Profit at MA for trade-4
✔ Perfect bounce-to-MA setup
5. 🔻 Signal-5 → Short Entry → WIN
Price rejected exactly at upper ellipse boundary
Indicator gave Short Signal-5
Trend followed down toward MA
Take Profit at MA for trade -5
✔ High-probability entry in sell zone
6. 🔻 Signal-6 → Short Entry → WIN
Compression high + overbought zone
Short Signal-6 activated
Smooth drop
Take Profit at MA for trade-6
✔ Final clean short as per system rules
4️⃣ BEST ENTRY ZONES
Long at Lower Ellipse Boundary
Short at Upper Ellipse Boundary
Avoid central zone completely
2️⃣ EXIT RULE (VERY IMPORTANT)
✔ Exit 100% of the trade at the Moving Average
This rule alone protects profits and avoids reversals.
5️⃣ RISK MANAGEMENT
0.5–1% risk per trade
Never add positions in the middle zone
Trade only clear signals with confirmed direction
🔥 Why This Indicator Works So Well
Your screenshot demonstrates:
✔ Automatic reversal detection
✔ Early trend shifts
✔ Compression + expansion zones
✔ Perfect MA exits
✔ No repainting structure
✔ High-probability entries at ellipse extremes
📌 FINAL POST CAPTION (Copy–Paste for TradingView)
"6 Winning Trades in a Row — Ellipse Price Action Indicator (Crude Oil 1H).
Buy/Sell Signals only at boundaries. Strict exit at MA.
Zero trades in middle zone → Zero noise → Maximum accuracy."
(Follow and Boost Script and Idea) MCX:CRUDEOILM1!
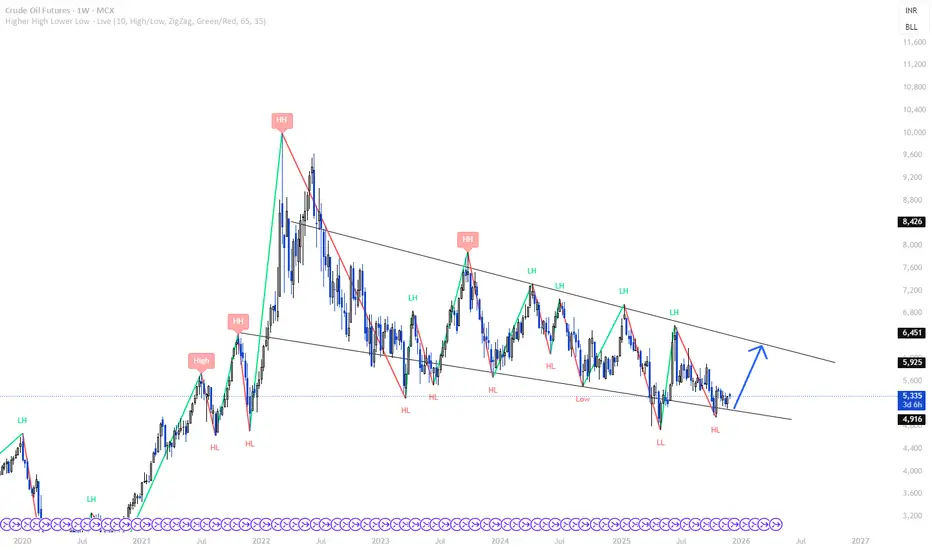
OIL looking at buy zone in weekly levels oil at yearly low and looking at very good buy opportunity as a swing trade
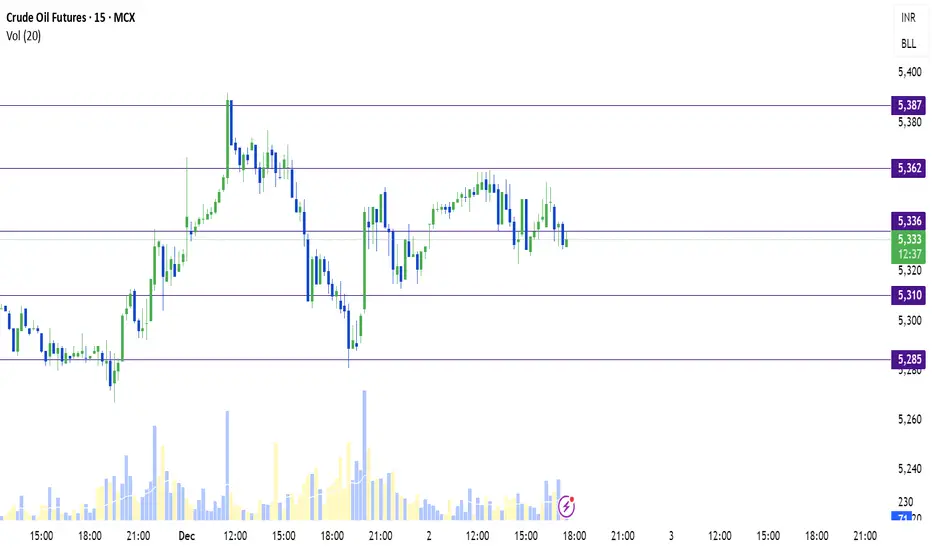
CRUDEOIL SUPPORT, RESISTANCE & TRENDLINE ANALYISISCurrently looks Bearish
Breaking the 5336 level might lead to 5310 and sustaining below that might further lead to 5285
"SHORT"
Breaking and sustaining above 5362 might lead to 5387 "LONG"
CL going for GAP closedue yesterday movement that weren't able to close above 59.64 , we will go lower today closing the gap.
a good 70p from here.

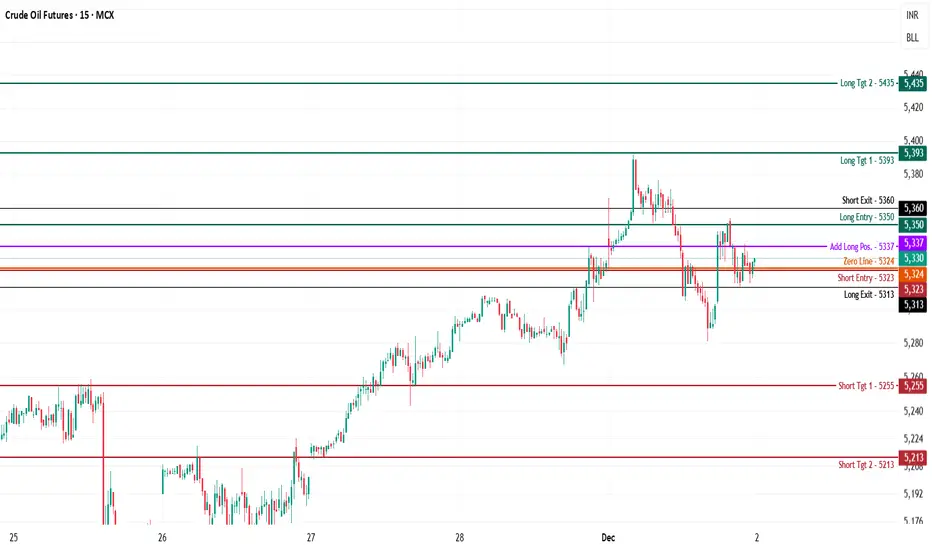
Crude Oil MCX Future - Intraday Technical Analysis - 2nd Dec. 25MCX:CRUDEOIL1!
Crude Oil MCX Futures — Chart Pathik Intraday Levels for 02-Dec-2025 - 02:42 AM
(If these levels add value to your trades, a quick boost or comment goes a long way in supporting this free content and keeping our trading community thriving!)
Crude Oil Futures are trading near 5,330, consolidating just above the zero line at 5,324 after a prior intraday selloff from the 5,390–5,400 zone, reflecting an active tug-of-war between bulls attempting a recovery and bears defending higher levels. Each comment or share builds the momentum for disciplined, structured analysis across our trading community!
Bullish Structure
Longs activate above the Long Entry level at 5,350, with stronger confirmation if price sustains above the Add Long Position level at 5,337 while holding above the zero line at 5,324.
Targets: 5,393 (Long Target 1 / primary booking zone) and 5,435 (Long Target 2 / extended move if momentum expands).
Control: Place stop or trail near 5,324–5,313 (zero line and Long Exit) to manage risk while bullish structure remains valid.
Bearish Structure
Shorts open below the Short Entry level at 5,323 or on sharp rejection in the 5,337–5,350 supply zone after failed upside attempts.
Targets: 5,255 (Short Target 1 / partial or scalp zone) and 5,213 (Short Target 2 / extended move on sustained breakdown).
Control: Fast short covers are required back above 5,337–5,350 where bearish structure weakens and short risk increases.
Neutral Zone
5,324 is today’s inflection and zero line—expect sideways, noisy price action while crude oscillates between 5,324 and 5,350 without decisive closes beyond either band.
Every setup is designed for structure, plan, and logic—let the chart work for you, not your emotions.
Boost or comment if these levels help your preparation—help Chart Pathik keep delivering quality analysis to more intraday traders!
CL1! — Bullish Above 58 with Target at 62.22Crude oil maintains a constructive bullish structure as long as price holds above the 58.00 key support zone. This level remains the foundation of the current upward bias.
The next meaningful obstacle for buyers sits at the 60.69 resistance, which aligns with a major Fibonacci cluster and has shown strong rejection in previous attempts. A clean breakout and sustained close above 60.69 would confirm renewed bullish momentum.
Above that resistance, the path opens toward 61.71 followed by the main upside target at 62.22, which represents the completion of the current Fibonacci expansion.
As long as price trades above 58, the bullish scenario remains valid. A failure at 60.69 may trigger a temporary pullback, but the broader structure favors continuation toward 62.22 once the level is cleared.

MCL | week 49 | 1hr chart.
T.A explained -
BackSide (BS)
FrontSide (FS)
Inverse BS (Inv.BS)
Inverse FS (Inv.FS)
BS & FS levels are expected support when dashed lines, tested when dotted and resistance when solid lines.
The inverse is true for the Inv. BS Inv. FS levels, they are resistance as dashed lines, tested as dotted and support as solid lines.
Monthly timeframe is color pink
weekly grey
daily is red
4hr is orange
1hr is yellow
15min is blue
5min is green if they are shown.
strength favors the higher timeframe.
2x dotted levels are origin levels where trends have or will originate. When trends break, price will target the origin of the trend. its math, when the trend breaks, the vertex breaks too so the higher timeframe level/trend that breaks, the more volatility there could be as strength in the orders flow in to fuel the move.

CRUDE OILDO YOU KNOW WHATS BEHIND THIS OR OTHER IDEAS?? in bio..
Preferably suitable for scalping and accurate as long as you watch carefully the price action with the drawn areas.
With your likes and comments, you give me enough energy to provide the best analysis on an ongoing basis.
And if you needed any analysis that was not on the page, you can ask me with a comment or a personal message.
Enjoy Trading ;)

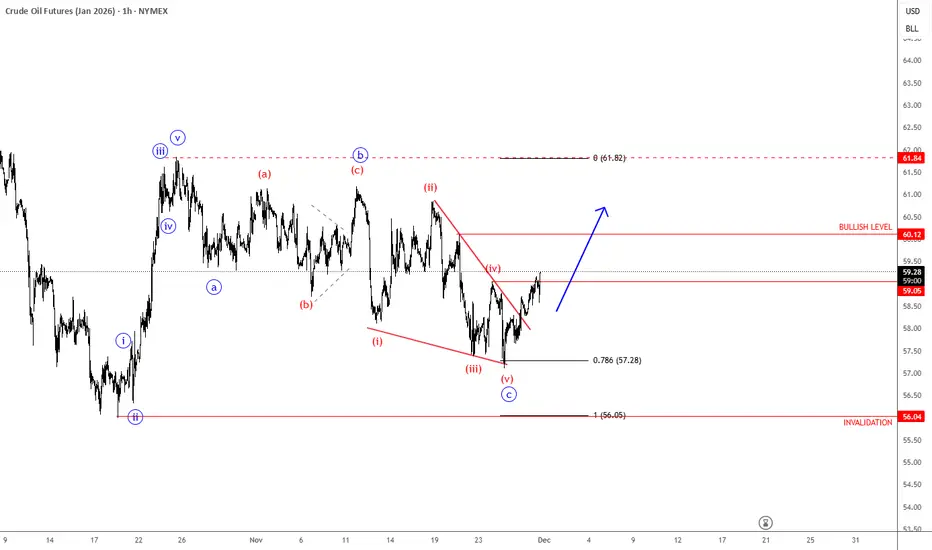
Crude Oil Has Finally Finished An Intraday Corrective SetbackCrude oil made a very strong rebound back in mid-October with an impulsive move of more than 11%, while the current retracement from 62 is very slow, which still suggests a counter-trend movement despite the weakness now retesting the 78.6% support levels. We can still see three waves down, and ideally subwave c is coming into a potential support zone, so a rebound can still happen while the market trades above 55.96 invalidation.
Looks like Crude oil is finally on the way back to October highs, as we see a sharp and impulsive rebound from the 78,6% Fibonacci retracement after a completed wedge pattern. So be aware of more intraday gians, especially if breaks back above 60 level, just watch out for pullbacks.
4H Supply & Demand | Going Long, BabyHere we have a diamond reversal pattern on the 4H.
Now that it broke out, I'm looking for a liquidity zone to retrace to and then go long for just 60 ticks on the 5m chart. Follow for more value.
- Mr. Trader-CL

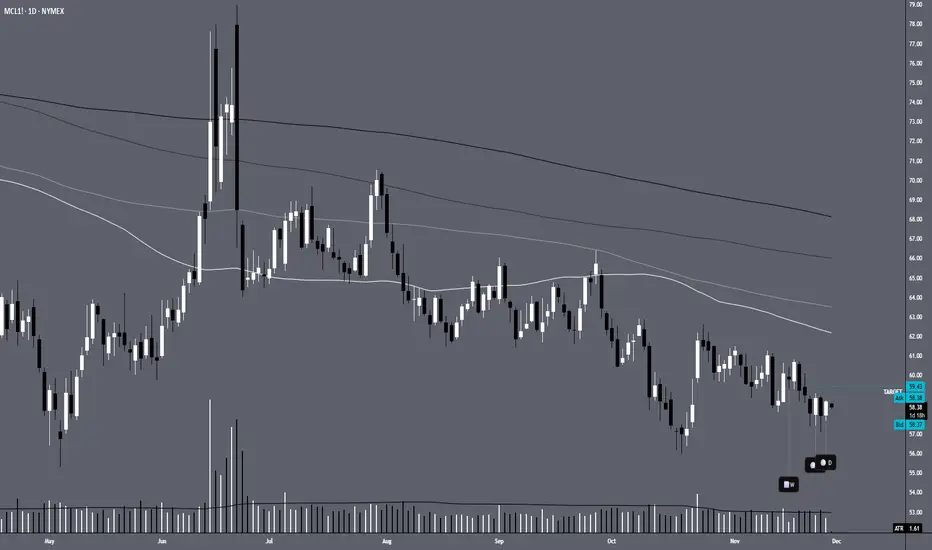
MCL1!Price is currently underneath the quarter's mark. Testing a support zone. Price could retest the November resistance zone.
CRUDE OILDO YOU KNOW WHATS BEHIND THIS OR OTHER IDEAS?? in bio.
Preferably suitable for scalping and accurate as long as you watch carefully the price action with the drawn areas.
With your likes and comments, you give me enough energy to provide the best analysis on an ongoing basis.
And if you needed any analysis that was not on the page, you can ask me with a comment or a personal message.
Enjoy Trading ;)

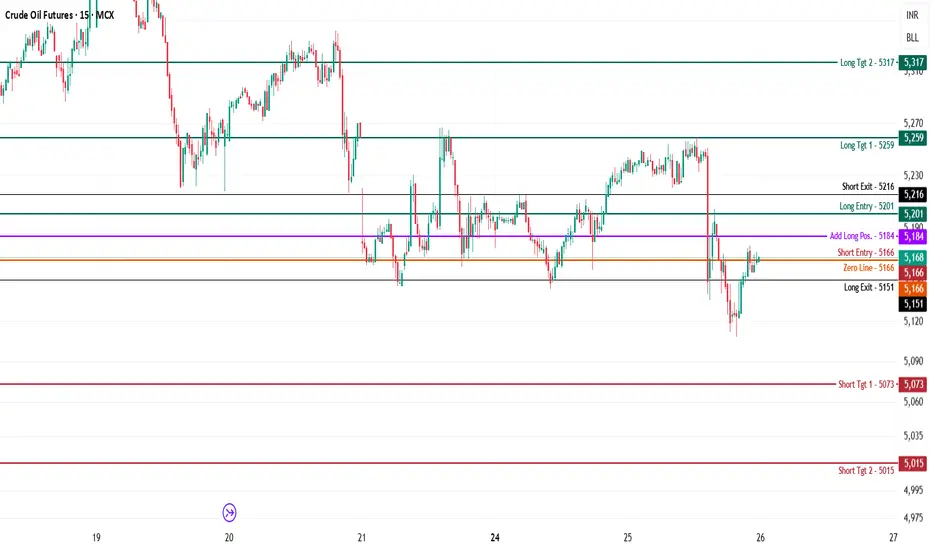
Crude Oil MCX Futures — Intraday Technical Analysis - 26 Nov. 25MCX:CRUDEOIL1!
Crude Oil MCX Futures — Intraday Levels and Technical Analysis for 26th November 2025
By Chart Pathik 26 November 2025
Market Overview
Crude Oil Futures are trading around ₹5,168, showing indecision after testing both bullish and bearish pivots. Price is consolidating near the zero line (₹5,166), with traders awaiting a decisive breakout. Momentum remains fragile, and intraday bias will depend on how price reacts around key control levels.
Key Intraday Levels and Scenarios
Bearish Structure:
- Short entry below ₹5,166 (zero line breakdown).
- Downside momentum may accelerate toward:
- ₹5,073 (Short Target 1)
- ₹5,015 (Short Target 2)
- Control: Keep stops above ₹5,216 or be ready to reverse if a sharp bounce occurs.
Bullish Structure:
- Long entry above ₹5,201 (confirmation of strength).
- Upside targets:
- ₹5,259 (Long Target 1)
- ₹5,317 (Long Target 2)
- Control: Trail stops aggressively and reduce exposure near resistance zones.
Neutral Zone:
- Between ₹5,166 and ₹5,201 — avoid heavy exposure until a clean breakout or fake‑out confirms direction.
Bias and Outlook
- Day Bias: Sell below ₹5,166; structure remains bearish as long as price trades beneath this pivot.
- Rallies are expected to face resistance and attract selling pressure unless price sustains above ₹5,201.
- Caution: A strong reclaim of the zero line could trigger volatility and short covering.
Chart Pathik View
Crude Oil is at a tactical inflection point. The bias leans negative heading into the session, but conviction is key — wait for confirmation signals before initiating fresh positions. Maintain strict risk management, as intraday reversals can be sharp. Remember, structure should guide decision‑making, not emotion.
Boost, comment, or share if these setups help you stay organized and attentive.
Crude Ready For New Strong Leg UpCrude oil is recovering for the last few weeks, after new sanctions against Russia, with price rebounding from 56 sharply and impulsively. This suggests an important new swing low is in place, and we should now be aware of more upside ahead, with a minimum three-wave recovery that could take us toward 66.60 or even higher, after that wave b/ii setback which is now coming to an end at 58-59 support area.
Even HS bullish pattern is calling for more upside.
GH

Confidence & Power | Supply & Demand Trading 4H/5m TimeframeOk, here it is for a 2nd chance.
Trendline is gonna get utterly swiped before we make a new high.
Based on 4H zones, I enter on the 5 minute chart.
- Mr. Trader-CL
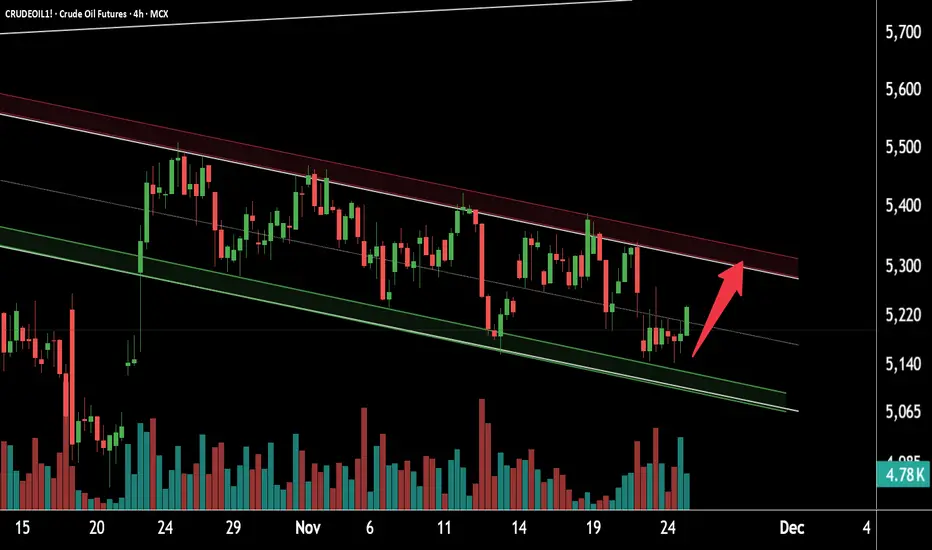
Crude Oil Showing Strong Upside SetupThis is the 4-hour timeframe support zone of Crude Oil.
The price is moving within a falling channel and is currently trading near the support zone at 5050–5100.
Crude Oil is respecting this support and has started taking a reversal.
If the momentum continues, the bullish move may extend towards the resistance zone at 5350–5400.
Thank you.
Crude oil probable price projection1. if price closes above the level then it moves up
2. if price breaks below may test lower levls

There are some setups for trades todayThis is Monday the 24th and I went through a number of markets including oil which I think is going higher and they went to some many contracts for traders who need less risk even though there's a little bit less reward.

CRUDE OIlDO YOU KNOW WHATS BEHIND THIS OR OTHER IDEAS?? in bio..
Preferably suitable for scalping and accurate as long as you watch carefully the price action with the drawn areas.
With your likes and comments, you give me enough energy to provide the best analysis on an ongoing basis.
And if you needed any analysis that was not on the page, you can ask me with a comment or a personal message.
Enjoy Trading ;)
