Crude Oil MCX Future - Intraday Technical Analysis - 24 Oct., 25$MCX:CRUDEOIL — Chart Pathik Insights | 24-Oct-25
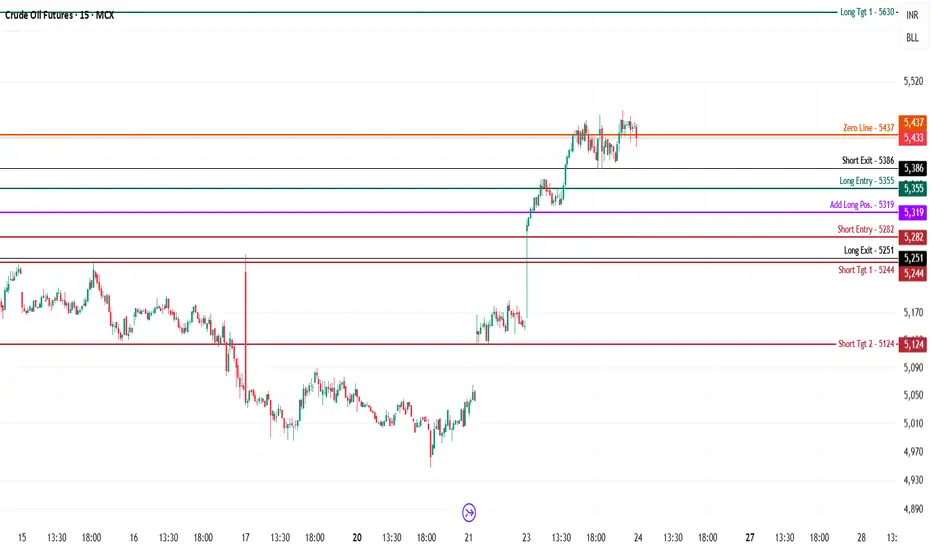
Crude Oil remains active in a tight trading band, currently oscillating near 5,433 with price action revolving just below the key zero line at 5,437. The recent upward spike has given way to a phase of measured consolidation, with traders watching closely for a decisive breakout or breakdown.
Bearish Outlook
Short setups are actionable below 5,282, especially if sellers press the market past the recent base.
Downside Levels:
5,244: Primary level for short covering or scaling out partials.
5,124: Major extension if accelerated selling takes hold.
Risk Control: Shorts should be managed tightly above 5,319, with a preference to cover if the market springs upward and reclaims lost territory.
Bullish Outlook
Longs may be considered above 5,355, with further confidence if Crude Oil sustains a push through the 5,386 exit and aims for the upside objectives.
Upside Levels:
5,630: The first resistance/target for trend traders.
5,750: Ambitious extension if the rally broadens.
Risk Control: Guard long trades near 5,319 or 5,282, according to your risk profile and entry pace.
Neutral/Choppy Bias
The 5,437 zero line is the day’s median—if price continues to hover here, expect range-bound trading until the market picks its next strong direction.
Use these levels for tactical entries, disciplined holds, and methodical exits across both swing and intraday timeframes.
If Chart Pathik levels assist your analysis, show some love—boost, comment, and share! Your engagement supports this continuous community effort.
Follow Chart Pathik for seamless trading structure, independent analysis, and a learning-first trading mindset.
Crude Oil Mini Futures
Trade ideas
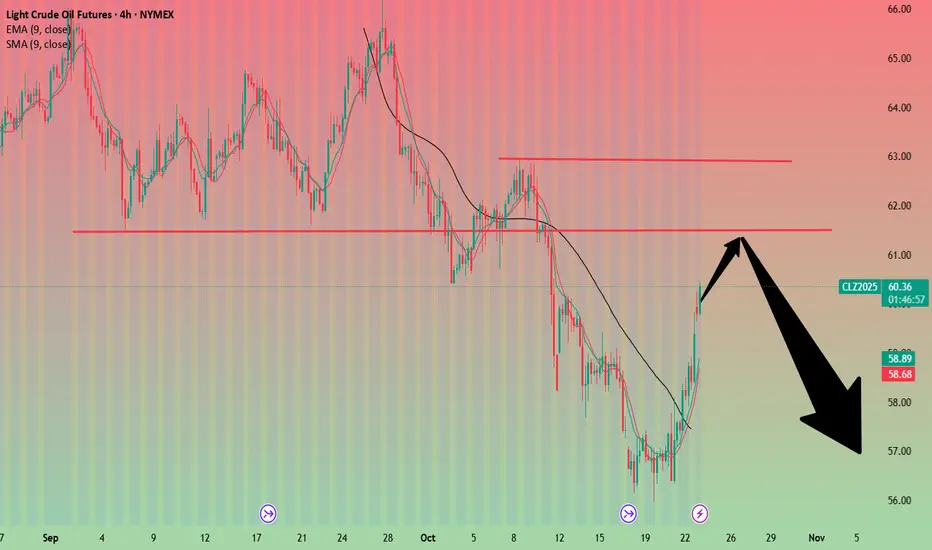
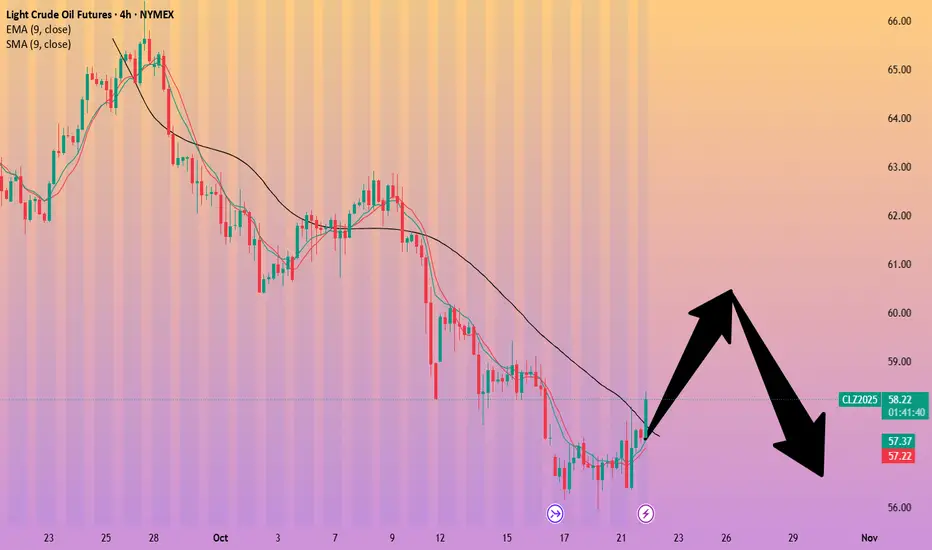
Crude oil - Sell around 61.00, target 58.00-56.00Crude Oil Market Analysis:
Crude oil previously started to decline on the daily chart. Yesterday's daily chart rebounded due to the EIA crude oil inventory data. Today's crude oil strategy remains bearish. Continue selling on rebounds. There's no chance of a reversal in crude oil sales, and the data-induced rebound is only temporary. Focus on sell opportunities at 61.00 today.
Fundamental Analysis:
The alarming crude oil inventory data is supporting crude oil buying prices. Furthermore, whether Federal Reserve officials have signaled further interest rate cuts will support gold buying.
Trading Recommendations:
Crude oil - Sell around 61.00, target 58.00-56.00
Crude oil waiting for longsCrude oil weekly chart.
After taking lower high weekly candle, price run $+61 for that dealing range I was looking for price retrace to fibo 50% level, we are almost there, I will look for lower t market structure break for confirmation, after that will long oil

Sell crude oil around 61.50, with a target of 60.00-58.00Crude Oil Market Analysis:
Maintain a sell stance on crude oil. Every rebound is a selling opportunity. Crude oil has seen relatively small fluctuations in recent months, with minimal market reaction and constant buying and selling. Consider selling if it rebounds to 61.50 today. Previous inventory data releases also had a temporary impact, leading to selling pressure.
Fundamental Analysis:
Today, focus on the ADP employment data, a leading indicator for non-farm payrolls. Also, pay attention to the new crude oil inventory data.
Trading Recommendation:
Sell crude oil around 61.50, with a target of 60.00-58.00.

CL SELLSELL CL at 71.0000 or 68.000, riding it down to 55.5000 to 51.0000 as Profit Targets, Stop Loss is at 73.0000!
Warning: This is only for entertainment and opinion purpose. Trading is a risky business, so do your own due diligence, and trade at your own risk. You can loose all of your money and much more.

Crude Oil Tests Key Support Zone: Is a Long Position Justified?
Current Price: $61.24
Direction: LONG
Targets:
- T1 = $63.50
- T2 = $66.00
Stop Levels:
- S1 = $59.75
- S2 = $58.50
**Wisdom of Professional Traders:**
This analysis synthesizes insights from thousands of professional traders and market experts, leveraging collective intelligence to identify high-probability trade setups. The rise in demand from industrial sectors and seasonal trends heading into winter has positioned crude oil as a focus of strategic trading decisions in the commodities market. Professional traders often analyze macroeconomic correlations, geopolitical risks, and technical indicators to derive consensus opportunities, where collective judgment provides robust insights into market direction.
**Key Insights:**
Crude oil markets are heavily influenced by geopolitics. Heading into late 2025, ongoing supply chain concerns are exacerbated by potential disruptions in exports from OPEC+ members due to regional conflicts. Additionally, demand from Europe and Asia has shown an upward trajectory as countries replenish their strategic petroleum reserves, contributing to near-term bullish sentiment. Seasonal energy consumption trends associated with the colder months of late Q4 and early Q1 2026 have historically driven crude oil prices higher, compounding demand-side acceleration.
On the technical front, crude oil has rebounded strongly from the $60.00 region, which represents a significant historical support area. Technical oscillators reflect oversold conditions, with the RSI approaching 40, suggesting an imminent recovery. The correlation between decreasing inventories reported by the U.S. Energy Information Administration (EIA) and international demand momentum could further tighten supply, triggering upside volatility.
**Recent Performance:**
Crude oil has witnessed sharp fluctuations in 2025, with prices retreating from highs of $92 earlier this year to the current $61.24 levels. The decline was largely attributed to cautious sentiment surrounding global growth and renewed concerns about inflation management. However, October closed on a bullish pivot as technical support zones held firmly, and demand surged amidst shrinking inventories. The rebound from $60.00 to $61.24 in early November reflects improving sentiment and potential for upward continuation based on current market dynamics.
**Expert Analysis:**
Market strategists highlight robust potential for crude oil to recover from recent declines as several key drivers converge. Goldman Sachs recently revised its 2025 crude oil price forecast upward to $70 per barrel, citing improved outlooks for global growth and OPEC+ production strategies. Technical analysts emphasize that the $60.00-$61.00 zone represents a critical support level, historically acting as a springboard for strong bullish recoveries. Furthermore, a recent MACD crossover has signaled higher momentum on the daily chart, aligning technical signals with broader macro positivity.
**News Impact:**
Recent developments in the Middle East, including disruptions in export flows from major oil producers, have injected short-term volatility into crude oil prices. Additionally, the ongoing shift in U.S. Federal Reserve monetary policy—potentially signaling an end to rate hikes—has bolstered anticipations of higher industrial demand globally. Meanwhile, improving post-pandemic recovery in Asian economies such as China has fueled supply-demand imbalances, lifting crude oil’s outlook. Traders are closely monitoring these developments as they can create accelerated bullish moves in the oil market.
**Trading Recommendation:**
Crude oil's rebound from the $60.00 psychological level, coupled with bullish seasonality and macroeconomic signals, suggests an attractive long trading setup. Both fundamental and technical outlooks point to a sustained push higher, offering a promising risk-reward ratio for traders. The recommended strategy is to initiate a long position at the current price of $61.24, targeting $63.50 as the first level (T1) and $66.00 at the second level (T2). Protective stops should be placed at $59.75 (S1) and $58.50 (S2) to mitigate downside risk if the macro environment shifts unexpectedly.
Do you want to save hours every week? register for the free weekly update in your language!

Crude OIL - trigger 63$Break of 63 $ area can give right push to the price to arrive untile 71/72 $ area
In this moment we have a H&S pattern but volume is above the price.
If price jump up to POC volume of the last period we can have a rally until next dinamic resistence area.

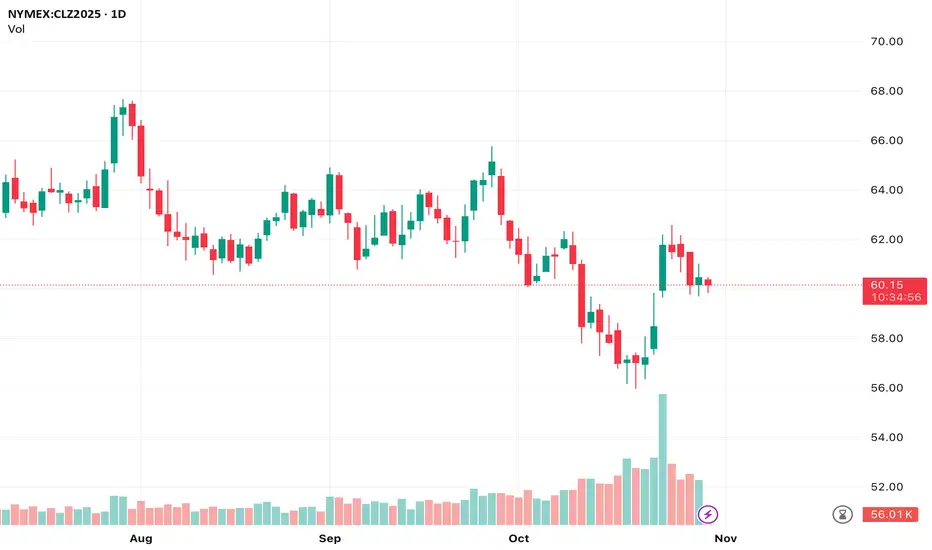
Crude Oil Futures (Dec 2025) Daily Chart Analysis
Crude Oil Futures (Dec 2025) Daily Chart Analysis
Price is trading around 60.15 after a bounce from the 56 area. The recent move up has slowed, shown by smaller candles and reduced volume. Structure shows a lower-high pattern overall, but the market is currently holding above a short-term higher low. This suggests consolidation, not a confirmed trend continuation yet.
Key Levels:
Resistance at 62. Price has rejected this zone twice.
Support at 60. Market is sitting just above this level.
Major support at 56. Strong reaction level where price last bounced.
What I See:
Volume increased on the push up, then faded.
Recent candles show hesitation, indicating indecision.
Price is ranging between 60 support and 62 resistance.
Bullish Scenario:
A break and daily close above 62 would signal upside momentum.
Targets: 64 then 67.
Bearish Scenario:
A break and close below 60 sets up a move toward 58 and potentially a retest of 56.
Current Bias:
Neutral. Price is consolidating. Waiting for a clear breakout or breakdown is prudent.
Range trades are possible between 60 and 62 with tight risk management.
Catalysts to Watch:
Crude reacts strongly to fundamentals including geopolitical events, US inventory data, and OPEC communication. Manage risk accordingly.
Follow for more. Happy Trading.
The Professor
CL1! Outlook I’m anticipating potential buy and sell opportunities on this setup. A confirmed break and retest to the upside will signal a buy continuation, while a confirmed break and retest to the downside will indicate a sell continuation.
Be cautious 😲 with your entries
Crude oil MCX towards 5000With the stop loss of 5490 crude heading for 5050 entry at CMP 5380
Risk Reward 2.8:1

Crude oil: Sell around 62.50, target 60.00-58.00Crude Oil Market Analysis:
Crude oil fell again, in line with our expectations. Today's crude oil price remains bearish. Sell on any rebound. The strategy for crude oil remains to follow the market. Consider selling if crude oil rebounds to 62.50 today. This level has been successfully suppressed. The impact of crude oil inventory data is only temporary. There are no recent data that will have a significant impact on crude oil prices. Focus on the impact of the Federal Reserve's monetary policy.
Fundamental Analysis:
The previous smooth Sino-US trade negotiations were positive for the US dollar, leading to a sharp drop in gold's safe-haven sentiment. Another major data point this week is the Federal Reserve's monetary policy.
Trading Recommendations:
Crude oil: Sell around 62.50, target 60.00-58.00.
WTI Crude (NYMEX): Reading Regime Shifts & Trims with CCIThis post shows how we use CCI to read regime changes, turn‑backs (hedge/cover), and trim zones on WTI Crude Futures (NYMEX).
Our CCI is free in the TradingView community scripts—search “CCI ” and add.
Why CCI on WTI?
WTI rotates between strong expansions and mean‑reversion. A momentum oscillator that measures deviation from a moving average is a simple way to read those cycles. We use CCI for three things:
Regime Change (bias) — zero‑line cross with rising momentum/velocity.
Risk/Trim — readings that push past ±100 (adaptive bands) then lose momentum.
Turn‑backs (hedge/cover) — a curl against the trend that doesn’t reclaim the zero line.
How to read the chart (1H shown)
Bullish regime: CCI flips green and closes above 0 → bias long until the zero line is lost.
Trim longs: when price runs and CCI spends time > +100, momentum fades (hook down) — take partials.
Bearish regime: CCI flips red below 0 → bias short until zero is reclaimed.
Turn‑back = hedge/cover: in a bearish regime, a yellow “curl up” from red (still below 0) is treated as a countertrend pop — reduce size/cover partials, not a full flip.
Extremes are a risk gauge, not a signal: WTI can stay > +100 or < −100 while the trend persists; wait for momentum to shift.
Playbook (quick checklist)
Long setup
✅ CCI crosses above 0 with slope up
🎯 Add on pullbacks that hold > 0
✂️ Trim when CCI spends time > +100 and hooks down
⛔ Exit/scale out on loss of 0
Short setup
✅ CCI crosses below 0 with slope down
🎯 Add on rallies that fail < 0
✂️ Trim when < −100 and hooks up
⛔ Exit/scale out on reclaim of 0
Settings used (defaults)
Period 14, Smoothing 5, Source HLC3, Sensitivity 6.
Optional: glow on; purely visual.
What’s different in CCI
Double‑EMA smoothing → cleaner waves
Volatility‑adjusted bands around ±100
Momentum/velocity context
Built‑in Buy/Sell + Strong alerts
Add it on TradingView: Indicators → Community Scripts → search “CCI ”.
Note: Educational only; not financial advice.

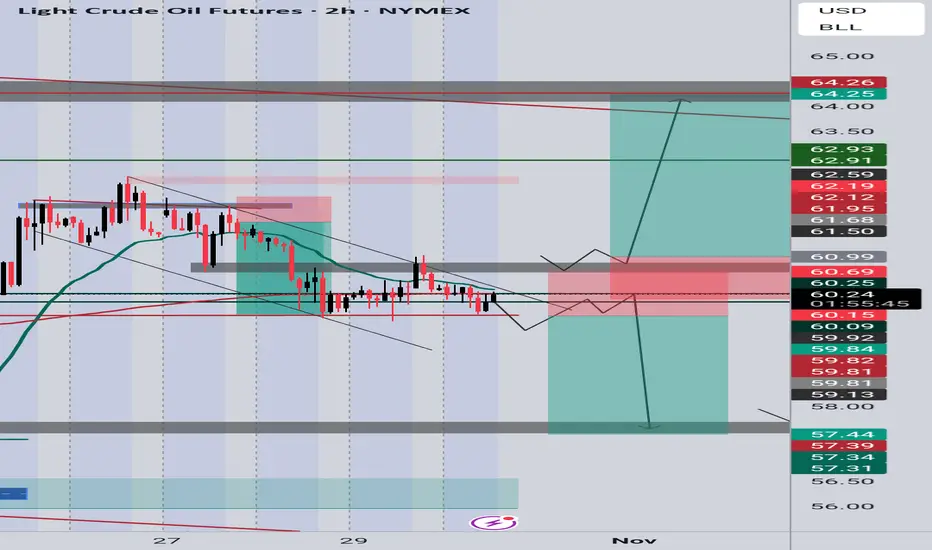
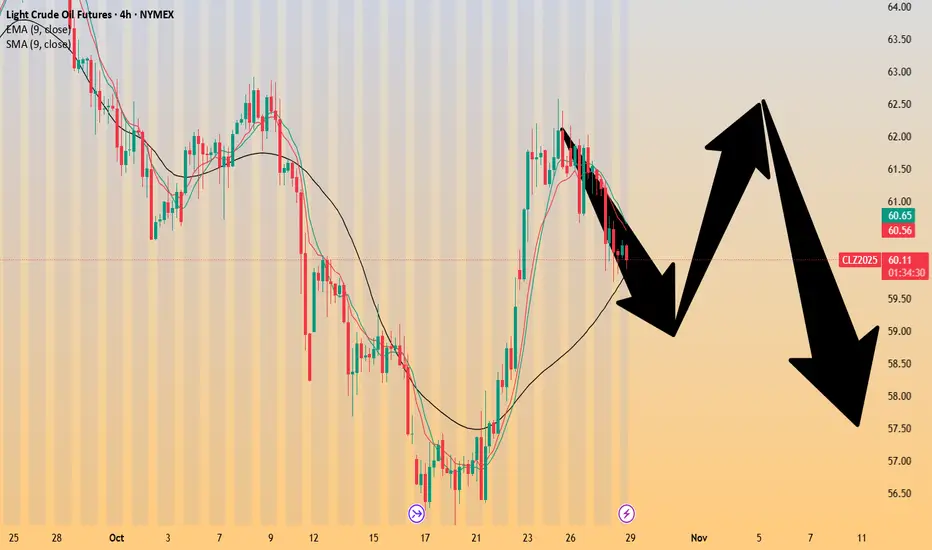
Crude Oil 📊 Crude Oil — 4H Chart | CLZ2025
📉 Current Price: $60.47 (−1.37%)
WTI has broken below the $61.00 support zone, showing short-term selling pressure. However, this move could be part of a technical accumulation phase before a stronger bullish impulse.
🧭 Key Levels:
• Immediate support: $59.50 – $60.00
• Resistance zone: $61.50 – $63.00
• Short-term trend: bearish
• Mid-term outlook: potential reversal
🚀 Projection:
After this short-term downside pressure, I expect a strong recovery move toward the $75–$80 area in the upcoming pre-bullish phase. A confirmed close above $63.00 would likely trigger renewed buying momentum.
⚠️ Watch this zone closely — accumulation here could be the fuel for the next big move.
#WTI #CrudeOil #Futures #CL1 #Commodities #Trading #TechnicalAnalysis #Energy #Oil #4H

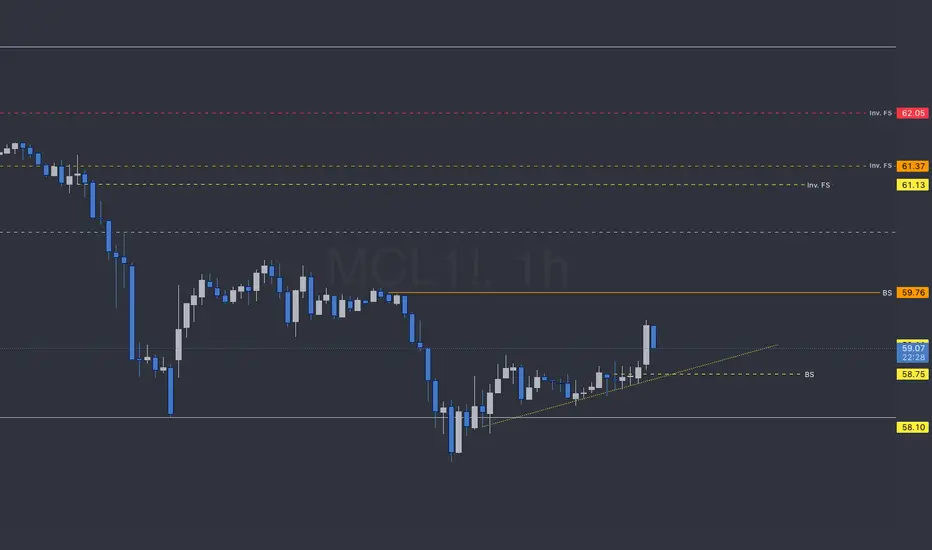
MCLJust an hourly chart with levels from above this timeframe.
year = black
pink = month
red= day
4hr = orange
1hr = yellow
Crude Oil Approaches Key Resistance While Demand Dynamics Shift Current Price: $61.72
Direction: LONG
Targets:
- T1 = $66.50
- T2 = $69.00
Stop Levels:
- S1 = $59.50
- S2 = $58.00
**Wisdom of Professional Traders:**
This analysis incorporates insights from thousands of experienced market participants, combining technical expertise and macroeconomic understanding to identify high-probability opportunities in Crude Oil trading. Many professional traders emphasize the importance of tracking supply-demand balances, geopolitical risks, and seasonal consumption patterns, particularly in the energy market. Market sentiments continue to show consensus on the role of current economic recovery alongside global energy demand dynamics.
**Key Insights:**
Crude Oil is currently trading at $61.72, presenting a strong long-term opportunity as global consumption and demand patterns trend upward amid easing recession fears in major economies. Recent market inventory data highlights declining stockpiles, which could support upward price movement. Additionally, OPEC+ discussions regarding production cuts are anticipated to play a pivotal role in maintaining the supply-demand equilibrium, creating potential bullish pressure for the asset.
The weakening U.S. dollar, observed amid dovish signals from the Federal Reserve in 2025, is another key driver enabling higher crude oil prices. Historically, energy commodities such as Crude Oil tend to perform well in weak dollar environments since they are priced in USD on global markets. Furthermore, China’s recent economic stimulus measures have contributed to projections of increased industrial activity, enhancing demand for crude oil.
**Recent Performance:**
Over the past few months, Crude Oil has experienced a pullback from its highs near $75 earlier this year. Concerns around global monetary tightening slowed momentum, dropping prices to the recent low of $57 in September. However, Crude Oil has rebounded significantly in October following strong U.S. GDP growth reports and confirmation of declining inventory levels. Currently trading at $61.72, crude appears poised for continued upside as market conditions stabilize.
**Expert Analysis:**
Technically, Crude Oil’s price action exhibits bullish momentum. The asset recently broke above its 50-day moving average, suggesting renewed buying interest. Additionally, positive RSI divergence signals strengthening internal price structure, while MACD indicators show upward crossover signals, reinforcing the bullish narrative. Experts emphasize that if Crude Oil sustains a rally above $62, the next resistance at $66.50 could be tested quickly, given the historical strength of demand at this price level.
On the macroeconomic front, geopolitical tensions in oil-producing nations remain a concern, which could tilt the balance further toward supply-side constraints. Moreover, the International Energy Agency (IEA) recently updated its forecast, projecting higher oil demand in Q4 2025, primarily driven by travel seasonality and improved economic activity in emerging markets.
**News Impact:**
Recent developments in OPEC+ negotiations regarding oil output curbs have reignited bullish sentiment among traders and market analysts. The organization’s ongoing efforts to stabilize prices while avoiding oversupply have supported projections for sustainable growth. Additionally, signs of global economic stabilization coupled with continued global travel and industrial demand have heightened optimism for higher prices in the coming months.
**Trading Recommendation:**
Crude Oil’s strategic significance in the global economy, paired with improving fundamental trends, makes it an attractive long trade at current levels. The $61.72 price point offers a compelling entry opportunity with nearby technical support at $59.50. Traders should target the $66.50 level as a short-term upside, potentially reaching $69 by the end of Q4 2025 if demand forecasts remain robust. Maintaining stops at $59.50 and $58.00 will help manage potential downside risks against macro uncertainty.
Do you want to save hours every week? Register for the free weekly update in your language!

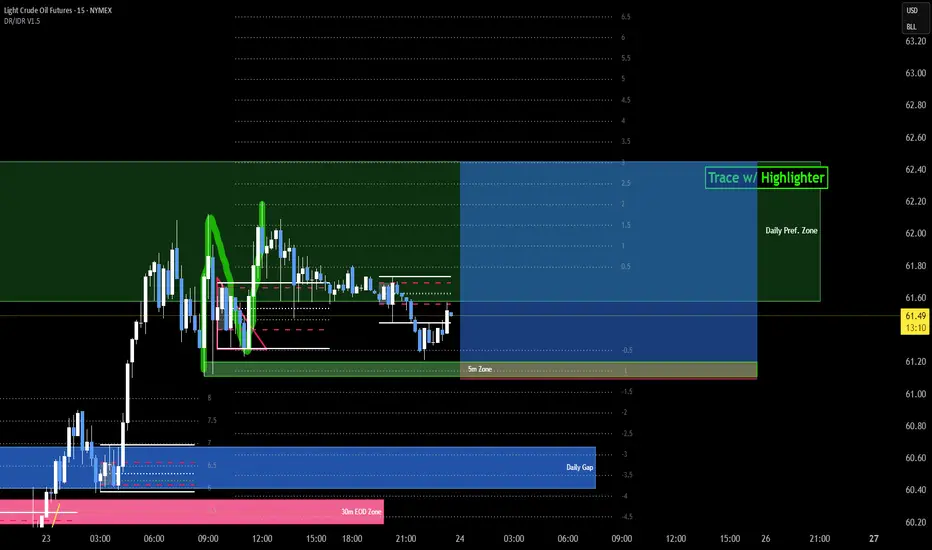
5 Minute Zone: LongImportant to Highlight the price action to show where exactly the new high is (tp), where is the liquidity that should be just above the zone, and the source of the move (the zone using the 5 minute chart).
I look for the last "doji" before the move that closed in the opposite direction.
So, in this idea, the zone is based on the last down doji candle before the up move.
And for longs, I mark the zone starting at the Open of the doji candle and down to the lowest point of that doji wick.
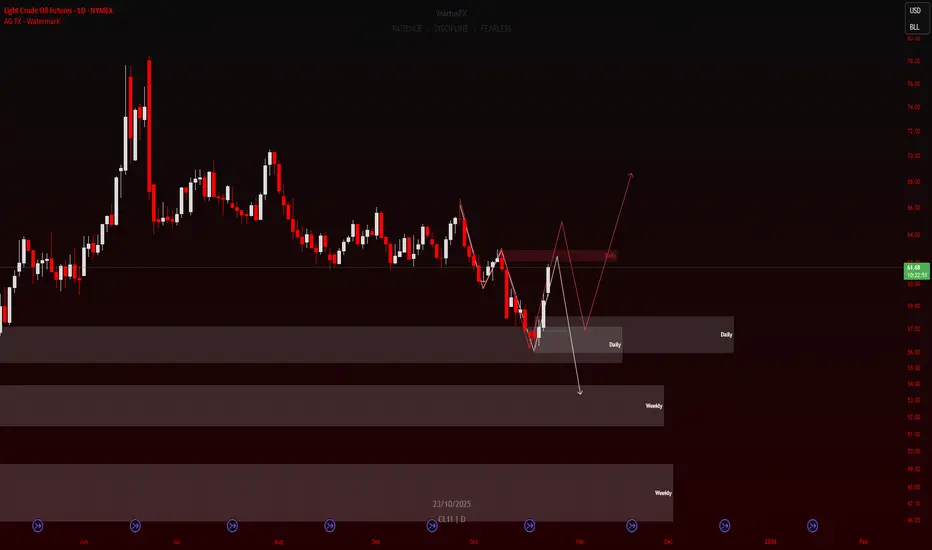
CL1! waiting roomThis days price of CL1! is moving towards daily Supply, after reaction from Daily Demand zone.
Based on longterm trend of CL I'am thinking about rejection from daily supply and moving towards Weekly Demand zone (as you can see White Path).
But of course, there is a chance of Changing Character (Invalidation of daily Supply), retrace towards new created Daily Demand zone, and claiming liquidity higher.
CRUDE OILPreferably suitable for scalping and accurate as long as you watch carefully the price action with the drawn areas.
With your likes and comments, you give me enough energy to provide the best analysis on an ongoing basis.
And if you needed any analysis that was not on the page, you can ask me with a comment or a personal message.
Enjoy Trading ;)

Crude oil - Sell around 59.60, target 58.00-56.00Crude Oil Market Analysis:
Gold's significant moves haven't impacted crude oil, which is still recovering. Consider selling after today's rebound to 59.50. The overall trend is bearish, and the short-term outlook is bearish as well. However, the short-term volatility is quite strong, so don't sell. Crude oil needs to wait for opportunities. If there's a position, buy; if not, wait. Recent crude oil inventory data is also disappointing, which is likely to suppress crude oil prices.
Fundamental Analysis:
Watch the EIA crude oil inventory data today.
Trading Recommendations:
Crude oil - Sell around 59.60, target 58.00-56.00
CRUDE OIL "3 Heads Monster"Could this 3 Heads & Shoulders come to live ?
Built in "Close Price Line Chart" (Candle = Same formation)
Small (black) H&S Target @ 59.34
Medium (orange) H&S Target @ 44.32
Large (blue) H&S Target @ 10.29

CRUDE OILPreferably suitable for scalping and accurate as long as you watch carefully the price action with the drawn areas.
With your likes and comments, you give me enough energy to provide the best analysis on an ongoing basis.
And if you needed any analysis that was not on the page, you can ask me with a comment or a personal message.
Enjoy Trading ;)


Crude OilUS Oil
- RSI - Divergence
- Impulse correction
- Consolidation Phase in Long Time Frame
- Completed " 123 " Impulsive Waves
- Break of Structure
