2025/10/19 - Light Oil - Premarket AnalysisDid some Technical and Fundamental analysis. Bearish. => Short the market.
Ran through ChatGPT, same analysis. Bearish for the next day or two.
Crude Oil Mini Futures
Trade ideas

Using tools to find reversal patterns for Sunday afternoonThis is Friday and we went through a number of markets that look like they have some good reversal patterns setting up there are at least 2 or 3 good opportunities based on the patterns there are some nice reversal patterns

nice outlook, big upside on its wayChart is showing some serious movements going fwd. As global demand is looking for Russia movements and most of the EU states are facing cool winter. Gas and petrol as game changers.
CRUDE OILPreferably suitable for scalping and accurate as long as you watch carefully the price action with the drawn areas.
With your likes and comments, you give me enough energy to provide the best analysis on an ongoing basis.
And if you needed any analysis that was not on the page, you can ask me with a comment or a personal message.
Enjoy Trading ;)

CRUDE OIL BEARISH MOVEMENT - WYCKOFF METHOD🧠 Wyckoff Distribution in Action (Phase B–D Transition)
Instrument: Light Crude Oil Futures (3-Minute)
Concept: Wyckoff Distribution × Smart Money Logic
🔍 Market Narrative
PSY → BC → AR → ST → SOW → UT (B) — structure clearly shows the composite operator distributing above 59.00.
The Upthrust (UT) confirms liquidity grab above the FVG (59.00–59.10) zone — a classic false breakout trapping breakout buyers.
High-volume rejection at UT → shift in market structure confirms Phase C → D transition.
⚙️ Key Confluences
FVG + Order Block Alignment: UT formed right inside a 3-min OB nested in higher FVG zone — supply stacked on HTF.
SOW (B): Weak demand reaction showing reduced effort to rally.
LPSY Formation: Lower-high retest entries aligning with bearish OB (smart money selling the retest).
Volume Confirmation: Climax volume during UT, fading on pullbacks — textbook distribution.
🎯 Trade Bias
Bias: Short
Entry Zone: LPSY retest near 58.80–58.85
Target: 58.20 (previous demand zone / Phase D markdown objective)
Invalidation: Close above UT high (~59.10)

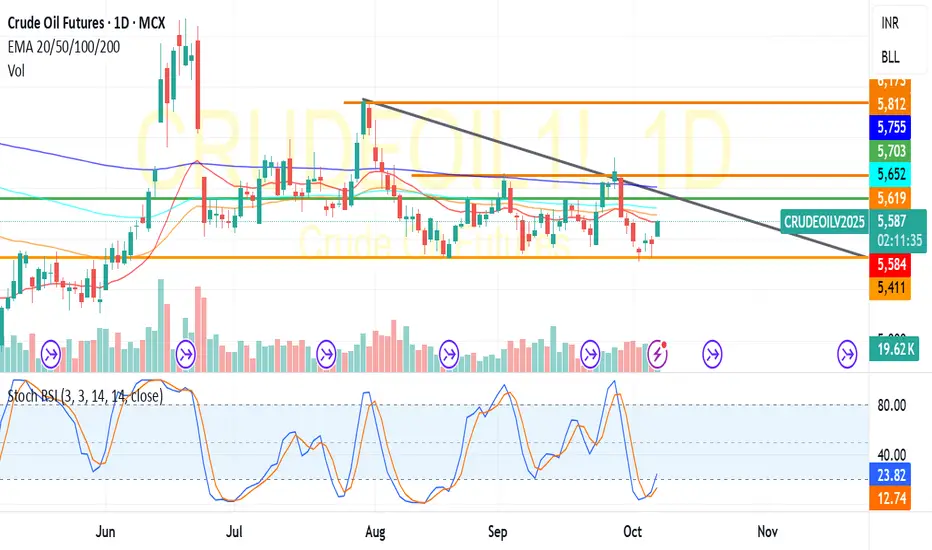
In daily time frame formed head shoulder pattern it seems to be In daily time frame formed H&S pattern confirmed. It seems to be downtrend
Target of head to neck line measurement

CRUDE OIL (WTI) BUY SETUPCrude oil has pulled back to a strong support zone, aligning perfectly with the bottom of its ascending structure. Price action is showing signs of buyers stepping in, which could lead to a natural continuation of the uptrend.
🛢 Additional bullish factors:
🟢 Price reacted strongly from support, indicating accumulation.
🟢 Supply-side tensions and global demand outlook continue to support higher prices.
🟢 Technical structure favors a push toward higher highs if support holds.
📈 TP Levels:
TP1: 65.88
TP2: 66.65
TP3: 67.39
TP4: 68.13
SL below support 🚫

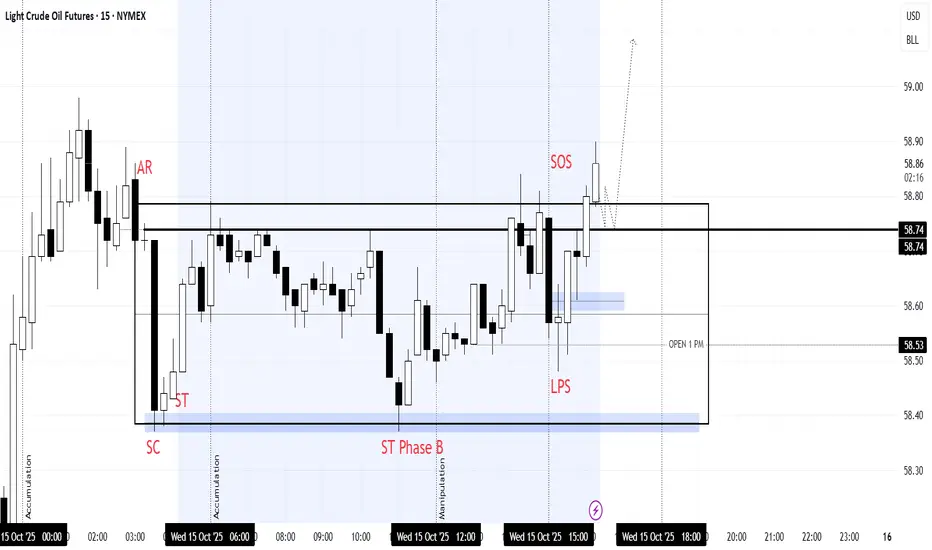
OIL WYCKOFF PHASEPhase A – Stopping the Downtrend
SC (Selling Climax): Heavy selling pressure absorbed by strong hands.
AR (Automatic Rally): First sign of demand entering the market.
ST (Secondary Test): Price revisits the lower range to confirm support.
Phase B – Building a Cause
Market continues ranging within support and resistance.
ST Phase B represents testing and liquidity grabs within the range.
Purpose: to absorb remaining supply and trap impatient sellers.
Phase C – Spring (Manipulation)
Price dips into the lower accumulation zone to trap breakout sellers.
Strong rejection signals institutional buying and start of accumulation completion.
Phase D – Markup Initiation
LPS (Last Point of Support): Higher low formed after the spring.
SOS (Sign of Strength): Price breaks above resistance with increased momentum.
Market structure shifts to bullish, confirming accumulation completion.
Phase E – Trend Continuation (Projection)
Expecting price to retest the breakout level before continuation toward higher liquidity pools.
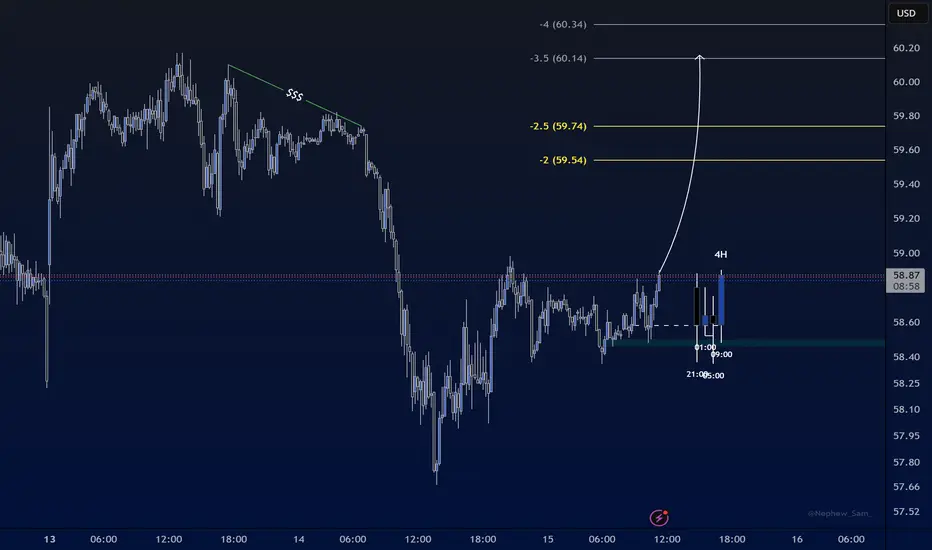
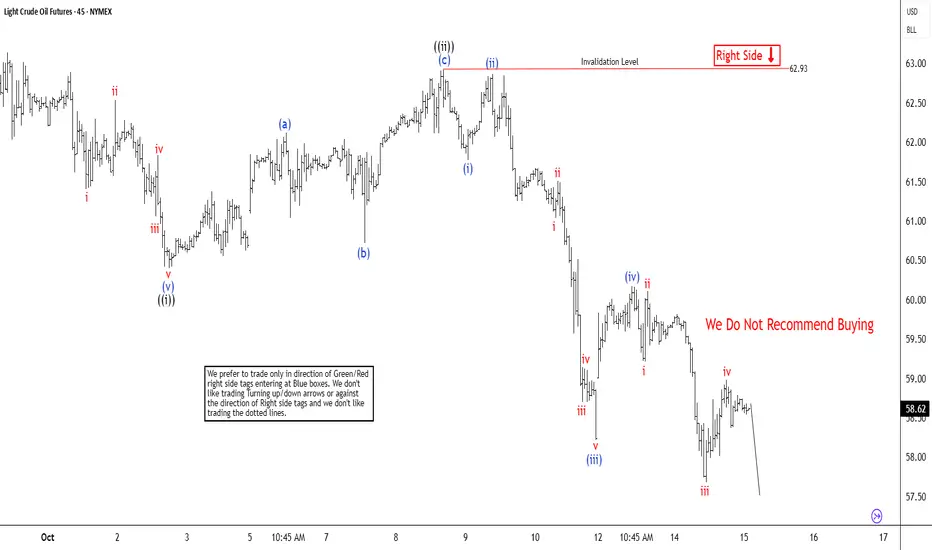
Light Crude Oil (CL) Weakness Expected to PersistThe short-term Elliott Wave analysis for oil indicates that a decline from the September 26, 2025, high is unfolding as a five-wave impulse. Starting from that peak, wave ((i)) concluded at $60.40, as depicted on the 45-minute chart. Subsequently, wave ((ii)) rallied in a zigzag Elliott Wave pattern. From the low of wave ((i)), wave (a) reached $62.12, followed by a pullback in wave (b) to $60.72. The upward move in wave (c) peaked at $62.93, completing wave ((ii)) at a higher degree.
Oil then continued its descent in wave ((iii)), structured as an impulsive sequence. From the wave ((ii)) high, wave (i) dropped to $61.78, and wave (ii) corrected to $62.87. Wave (iii) extended lower to $58.22, with a bounce in wave (iv) reaching $60.17. In the near term, as long as the pivot at $62.93 holds, any rally is expected to falter in a 3, 7, or 11-swing pattern, leading to further declines. The potential downside target lies between $53.2 and $56.9, based on the 100% to 161.8% Fibonacci extension of wave ((i)). This analysis suggests continued bearish momentum, with limited upside potential unless the key pivot is breached.
CRUDE OILPreferably suitable for scalping and accurate as long as you watch carefully the price action with the drawn areas.
With your likes and comments, you give me enough energy to provide the best analysis on an ongoing basis.
And if you needed any analysis that was not on the page, you can ask me with a comment or a personal message.
Enjoy Trading ;)
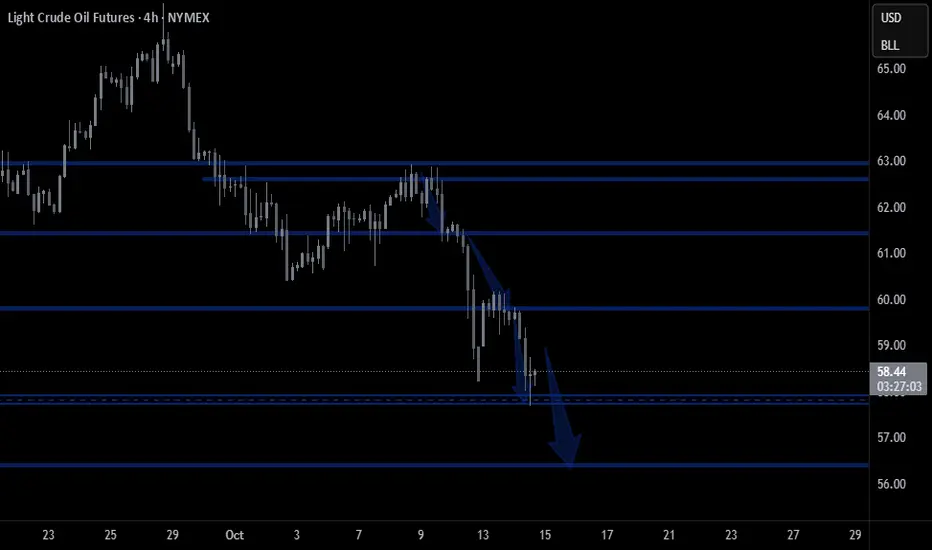
Oil Finally Breaks the Range — Downside Momentum EmergingAfter weeks of sideways, messy price action where most traders got chopped up, CL has finally chosen a direction. During that entire range-bound phase, we stayed on the sidelines and focused on cleaner markets instead — waiting patiently for this exact moment of clarity.
Now price has broken below the range lows with the 5/10/20 EMAs stacked cleanly beneath the 50 EMA, confirming downside momentum and the start of a new expansion phase. For the first time in weeks, structure is aligned and directional — no more fakeouts, no more noise.
This is the kind of clean context where money is made, not lost. The plan now is simple: wait for a lower-high pullback into the EMA stack and look for continuation setups if structure holds.
Questions for discussion:
– Did you avoid trading this chop or get caught inside it?
– Are you seeing similar clean shifts forming in other markets right now?
– Do you prefer to sit out until context like this forms, or trade through the noise?

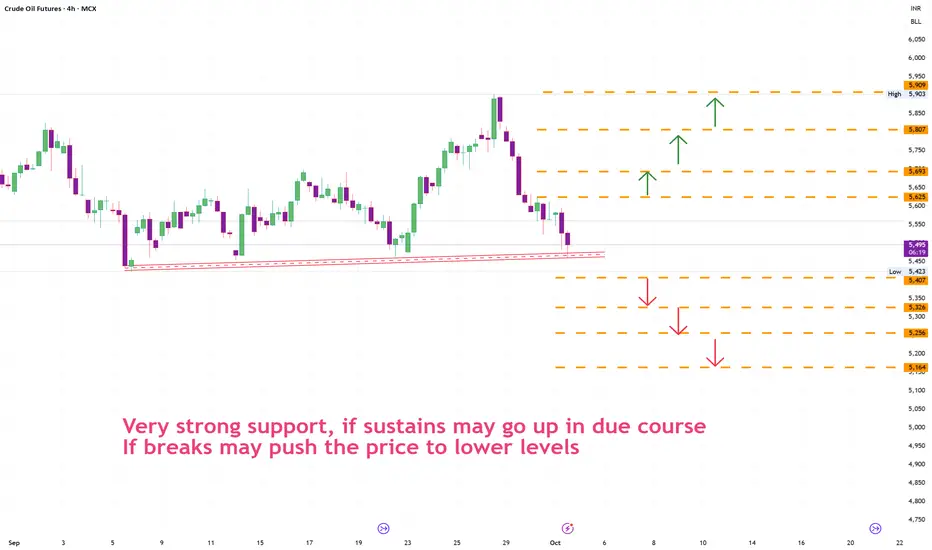
Crudeoil Probable price levelsCrudeoil price tested 5400 -5450 levels many times.
1. if buyers couldnt support the level then the pirce moves down.
2. if buyers defend the position then the price moves up.
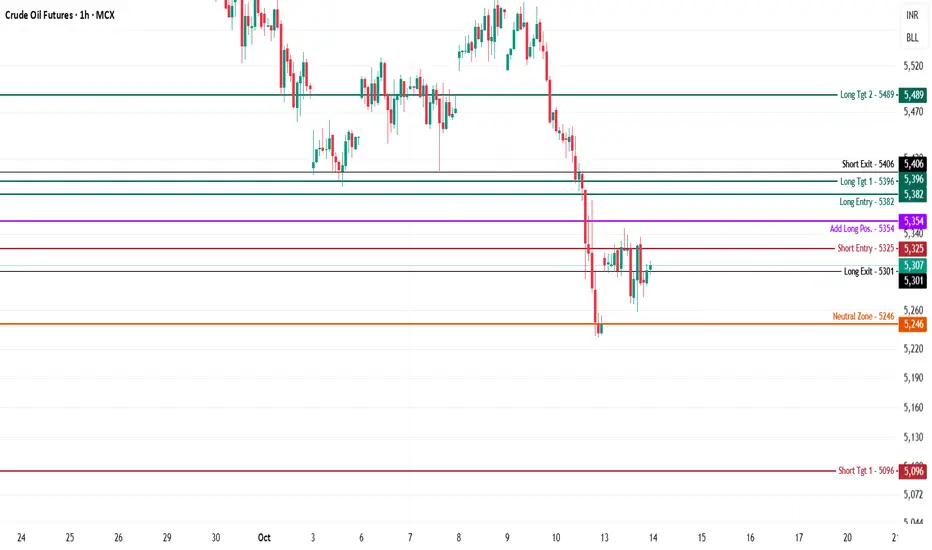
Crude Oil - Intraday Technical Analysis - 14th Oct., 2025 $MCX:CRUDEOIL
Crude Oil is trading at 5,307, consolidating after a steep fall and holding just above the neutral zone (5,246). Price is compressing between intraday supply and demand.
Bearish Scenario
Short Entry (5,325): Shorts become actionable below 5,325, especially if the price fails to reclaim 5,354 (add long zone) and loses momentum.
Downside Targets:
5,096 (Target 1): First mapped support for covering shorts.
5,003 (Target 2): Additional extension if selling accelerates.
Stop Loss: Hold shorts only if price remains below 5,301 (long exit); cover if it bounces above 5,354.
Bullish Scenario
Long Entry (5,382): Fresh longs trigger above 5,382, with additional conviction if price sustains over 5,396 (short exit).
Upside Targets:
5,489 (Target 1): Key resistance and logical profit booking area.
Stop Loss: Use 5,354 or 5,325 for active risk control.
Neutral/Range Logic
Neutral Zone (5,246):
If price continues to oscillate in this band, expect a choppy range until a directional breakout confirms the trend.
Watch for decisive moves out of the compression zone to activate either bullish or bearish plans.
If these levels help your trading, please boost, comment, and share. Follow for more daily key levels and actionable market logic!
Reach out in the comments—no hassle, just honest learning and open sharing. Your engagement drives this effort for all active viewers!
CRUDE OILPreferably suitable for scalping and accurate as long as you watch carefully the price action with the drawn areas.
With your likes and comments, you give me enough energy to provide the best analysis on an ongoing basis.
And if you needed any analysis that was not on the page, you can ask me with a comment or a personal message.
Enjoy Trading ;)
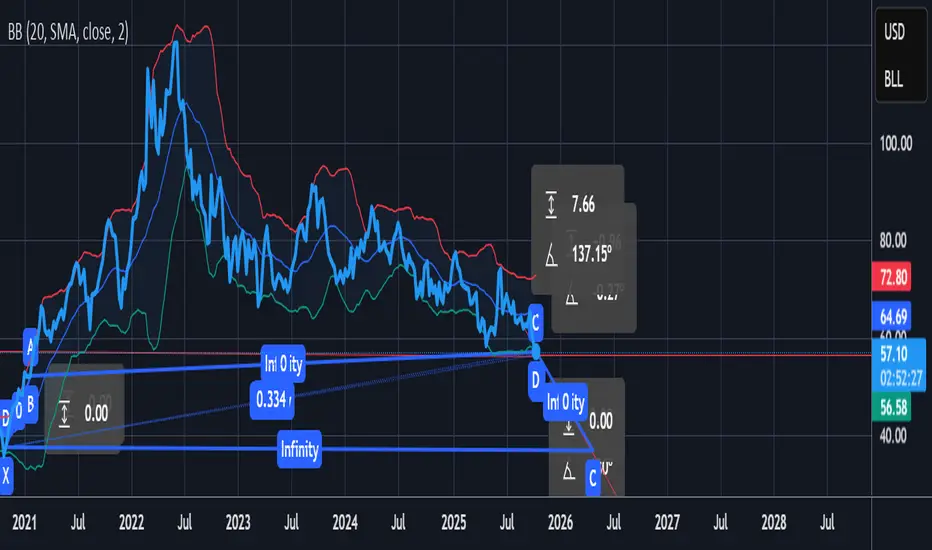
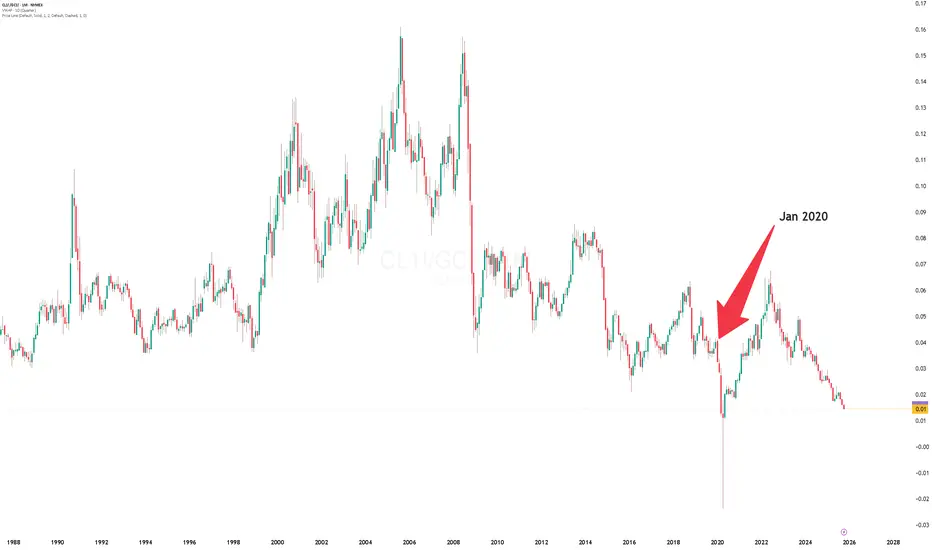
Oil/ Gold relative value chart. Back to early pandemic levels of value here, no doubt driven by outstanding gold performance.
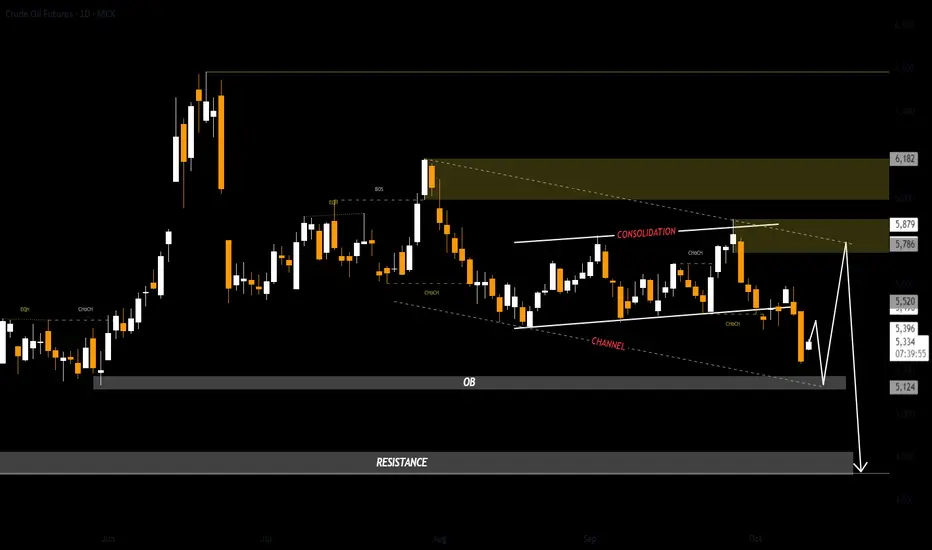
US OilCrude Oil
- Consolidation Phase
- Break of Structure
- Bearish Channel as an corrective pattern in Short Time Frame
- Order Block
- Resistance Level
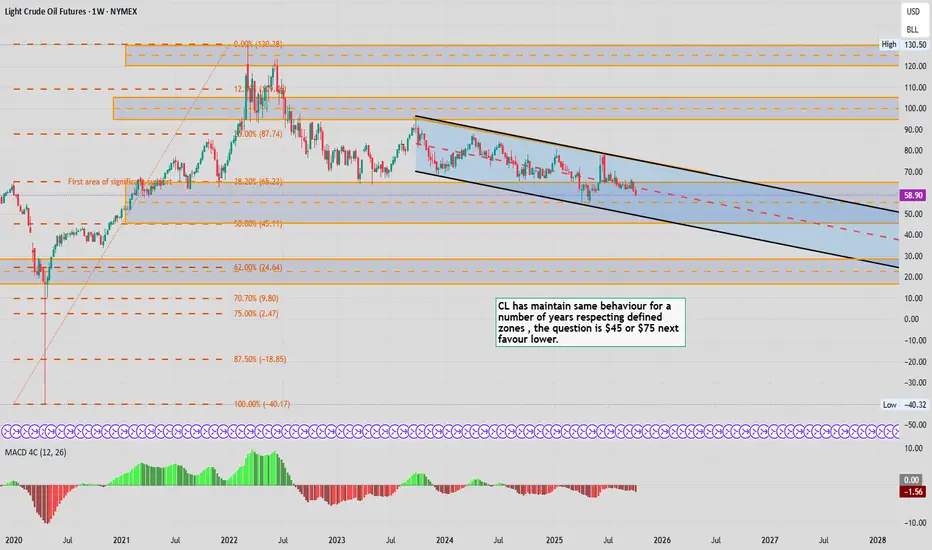
Updating Last months CL chart CL been behaving within defined ranges for the longest time and do not see anything changing just yet, and look like we willprobe lower in the short term
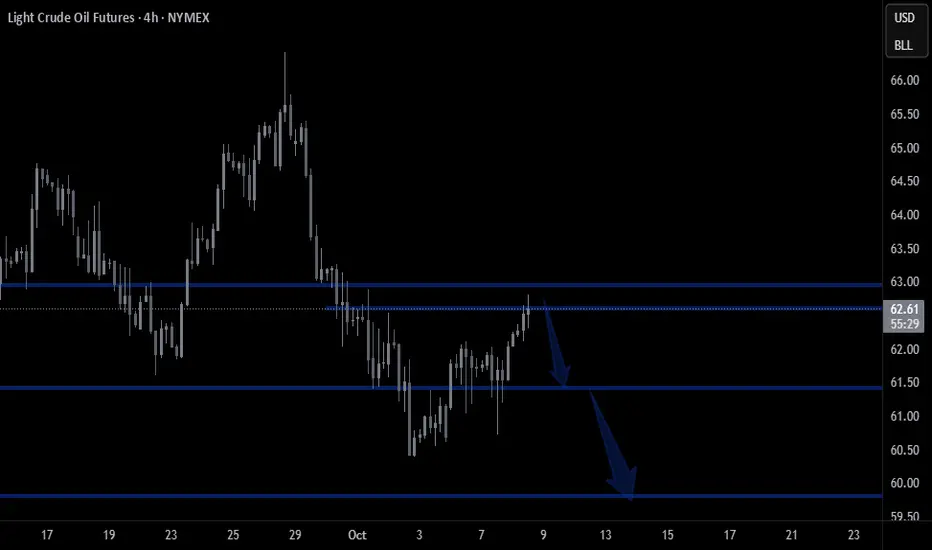
Lower Highs Signal Weakness: Crude Oil Bears Eye $61 Support
The recent attempt to rally stalled around $65–66, failing to break above the mid-Bollinger band resistance.
Multiple long upper wicks show selling pressure on rallies.
Price is moving closer to the lower band after failing to hold above the middle band.
The market shows weak upside momentum and dominant selling pressure.
As long as price stays below $65.50, bears maintain control.
If $61.00 support breaks, downside targets are $59.00, then $57.00.

Crudeoil probable price projection1. if takes support may push the price up
2. if breaks it may push the price to lower side
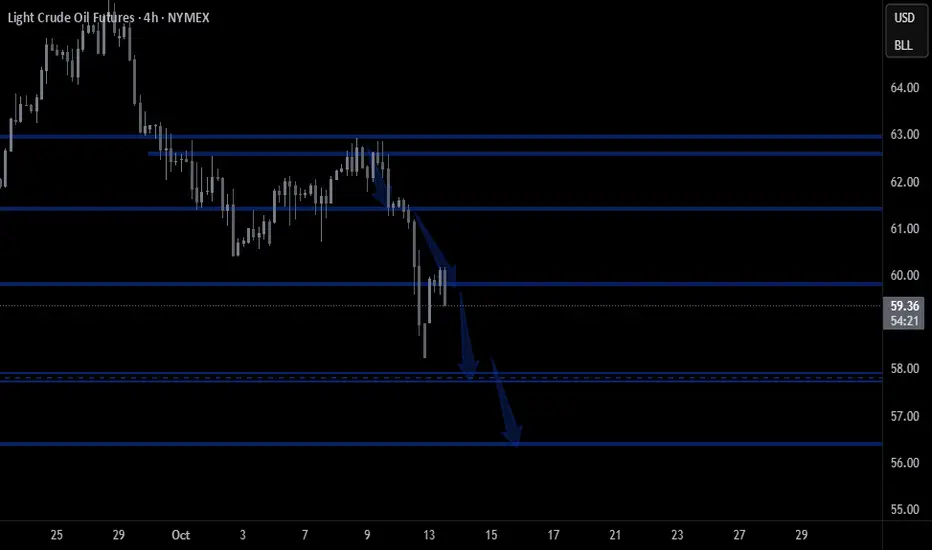
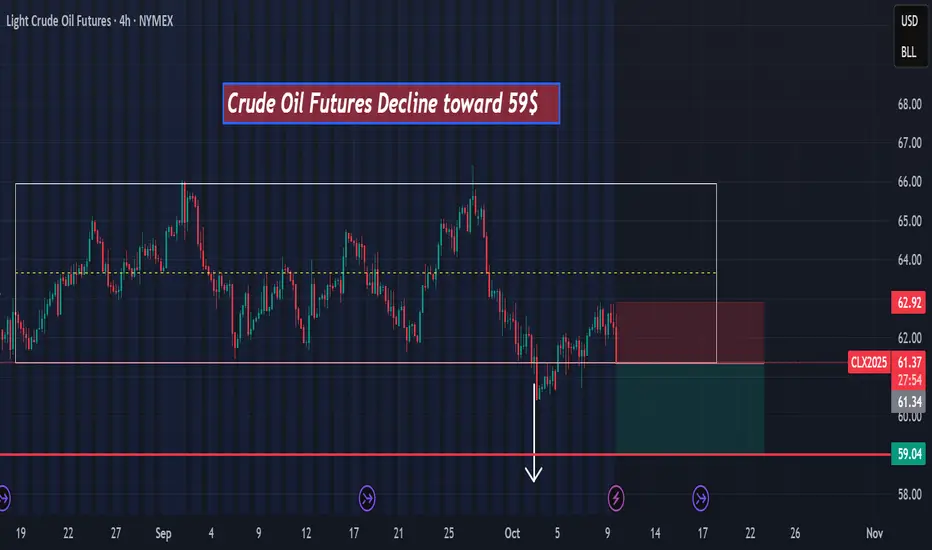
Crude oil decline toward 59$hello,
According to my technical analysis, there is a high probability of a decline toward $59 in the next few hours,
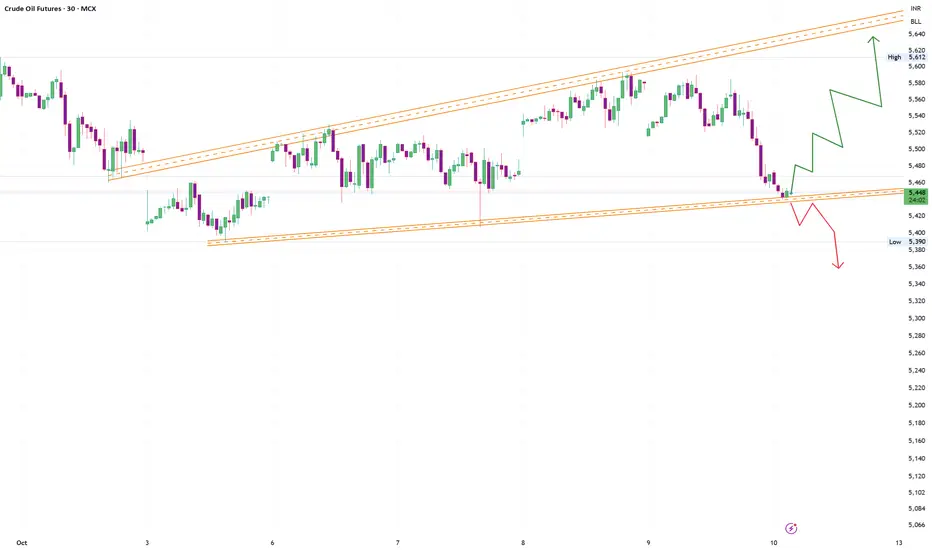
MCX CRUDE: Showing Traces of a bounce bk RallyMCX CRUDE: Trading at around 5600 has given Golden EMA Cross over in 30Min chart .
Major Resistance lies at 5700 -5800.
Close above 5800 likely to trigger a rally towards 6400 whereas 5400 likely to act as the crucial support.
Drifting below its 5400 likely to test 5100 its June ,2025.My bias is positive and buy on dips for 5700/5800/6000+(For educational purpose only)
CRUDE OILPreferably suitable for scalping and accurate as long as you watch carefully the price action with the drawn areas.
With your likes and comments, you give me enough energy to provide the best analysis on an ongoing basis.
And if you needed any analysis that was not on the page, you can ask me with a comment or a personal message.
Enjoy Trading ;)