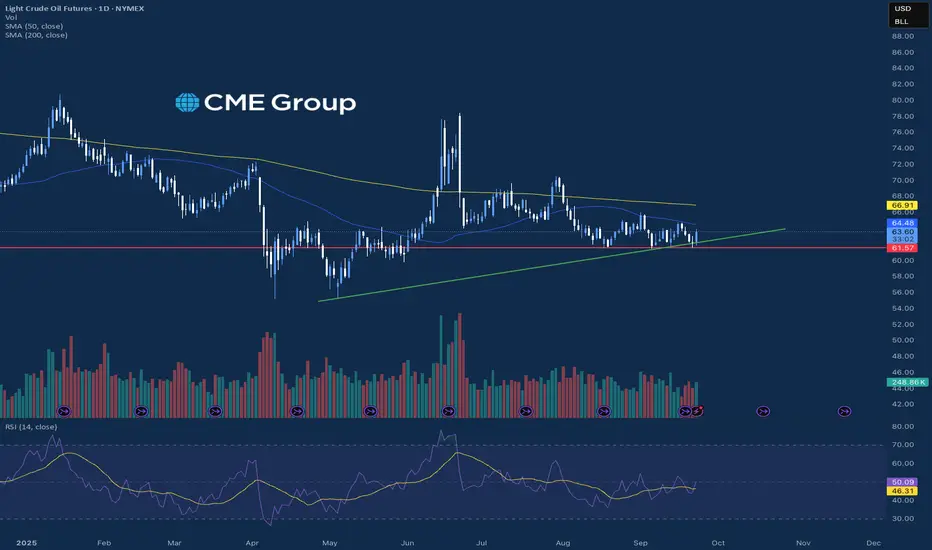
crudeoil probable price movements crudeoil is at key levels.
1. if rejected from the levels may test lower levels
2. if crosses above may touch upper levels
Crude Oil Mini Futures
CRUDEOILMF2025 trade ideas

Crude oil: Sell around 64.90, target 63.00-61.00Crude Oil Market Analysis:
The rise in crude oil prices has left many investors confused. Shouldn't they be selling crude oil? Why is it so strong again? A look at the 4-hour candlestick chart will show that the current rally is still within a range of fluctuations and hasn't broken out. Furthermore, the range-bound resistance level is approaching again. It's a good time to sell immediately. The overall trend for crude oil is bearish, and short-term volatility recovery is expected.
Fundamental Analysis:
Gold surged and then retreated, while the US dollar rebounded sharply after hitting a bottom. No major market data was released, and the Fed's policy has no sustained impact on the market in the short term.
Trading Recommendations:
Crude oil: Sell around 64.90, target 63.00-61.00

CL oil & Inflation are cooling-off towards $55!1). Corrective wave 4 is likely over! 2). MACD is divergent, as price inches up 3). Retail candle is an indecisive spinning top. 4). Overall correction needs a wave 5 south. 5). Volume is dropping. 6). Oil is an Inflation barometer, which is dropping. 7).I've been analyzing charts for over 20 yrs. as my strategies "trend" to be very accurate! A lot of effort goes into this, so please consider a "Boost".

Momentum Speaks: Crude Oil Buy OpportunityCrude Oil Momentum Buy Setup
4H & 15M Timeframe View
Crude Oil is respecting the channel lower boundary with reversal from 5460–5490 support zone.
Currently moving in momentum, with Supertrend also confirming buy-on-dip opportunity.
Watch for pullbacks near 5540–5550 support (Supertrend zone) for potential entries.
Thank you!

Equities Cooling From All Time HighsEquity Indices are seeing selling pressure into the close today marking the first down day of the week. The selling was led by the Nasdaq which traded down near 0.6% after being the most technically “overbought” of the equity indices on a daily basis. The economic data slate today showed PMI came in slightly worse than expected, and the markets slowly traded lower throughout the session before closing. Traders also heard remarks from Fed Chair Powell where he re-emphasized some of the points from the Fed meeting last week, and also said there is no risk-free path in balancing jobs and inflation.
Outside markets saw strong movements today as well, with the precious metals continuing to move higher, looking at Gold, Silver, and Copper all moving higher and Gold and Silver recording another new all time high price. Energy markets also saw a nice move higher today as Crude Oil and Natural Gas both traded up over 2% on the day. Tomorrow, we will see economic reports on New Home Sales along with Crude Oil Inventories that may add additional volatility into the markets.
If you have futures in your trading portfolio, you can check out on CME Group data plans available that suit your trading needs tradingview.com/cme/
*CME Group futures are not suitable for all investors and involve the risk of loss. Copyright © 2023 CME Group Inc.
**All examples in this report are hypothetical interpretations of situations and are used for explanation purposes only. The views in this report reflect solely those of the author and not necessarily those of CME Group or its affiliated institutions. This report and the information herein should not be considered investment advice or the results of actual market experience.

Options Blueprint Series [Basic]: Risk-Defined Bull Spread on CLIntroduction
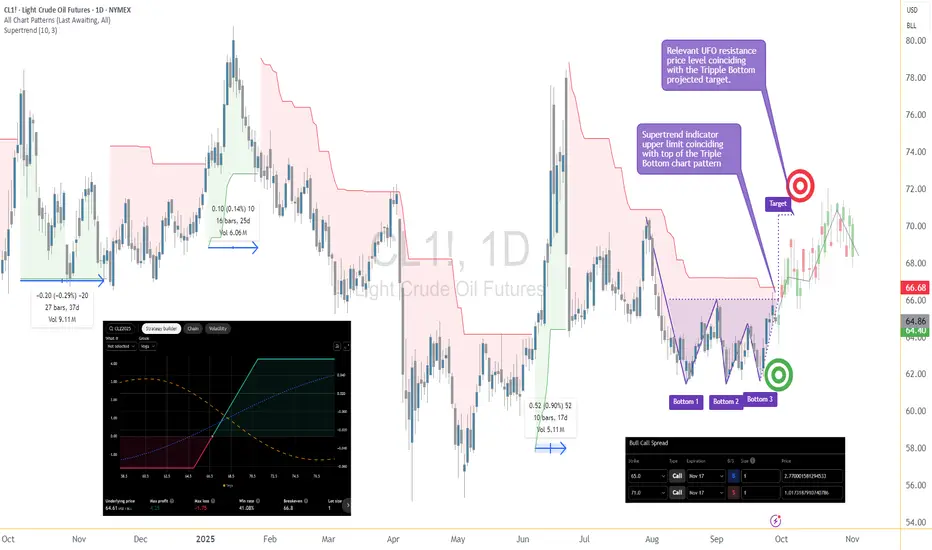
Crude Oil has been carving out a compelling structure on the daily timeframe. The chart has formed a Triple Bottom pattern, a classic base-building formation that often precedes significant directional moves. As prices approach a critical resistance area, traders are watching closely for confirmation of a breakout.
Options provide a unique way to participate in such setups. Instead of buying futures outright — which exposes the trader to potentially unlimited downside — a Bull Call Spread allows participation with limited and predefined risk. Today, we’ll explore how this strategy can be structured on WTI Crude Oil (CL) Options on Futures to target a move higher while keeping risk controlled.
Market Setup
Chart pattern: Triple Bottom on the daily timeframe.
Entry trigger: Breakout above 66.68, where the top line of the Triple Bottom coincides with the upper band of the Supertrend indicator.
Target: ~70.63, which aligns with both the Triple Bottom projected objective and a relevant UFO (UnFilled Orders) resistance area.
Trend context: A successful breakout here would not only complete the Triple Bottom pattern but also suggest a broader trend reversal on the daily chart.
This confluence of technical signals makes 66.68 a price level worth paying attention to.
The Strategy: Bull Call Spread
A Bull Call Spread involves buying one call option with a lower strike and simultaneously selling another call option with a higher strike, both with the same expiration.
Buy: CL Nov-17 65 Call (cost ≈ 2.77)
Sell: CL Nov-17 71 Call (credit ≈ 1.02)
Net debit (cost): ≈ 1.75 points
Since each CL options contract represents 1,000 barrels of oil, the cost of this spread is about $1,750 per spread (subject to commissions).
Why November 17?
The timing matches the behavior of prior Supertrend cycles. The longest green cycle shown on the chart lasted about 37 trading days. By selecting Nov-17 expiration, the position allows sufficient time for a breakout and follow-through, while not overpaying for excess time value.
Risk/Reward Profile
From the risk graph:
Maximum Profit: ≈ 4.25 points, or $4,250 per spread.
Maximum Loss: ≈ 1.75 points, or $1,750 per spread.
Reward-to-Risk Ratio: ~2.4:1.
Breakeven: ~66.8 (very close to breakout level).
The breakeven location is important: it aligns almost exactly with the breakout trigger on the chart. This means that if the technical pattern validates, the option structure begins to work immediately.
The reward-to-risk ratio above reflects the pricing available at the time of building the spread. If a trader waits for confirmation of the breakout before entering, option premiums may rise, making the Bull Call Spread slightly more expensive. In that case, the risk-to-reward ratio would be somewhat less favorable, though the trade-off is higher confirmation of the technical signal.
Trade Application
Entry trigger: Now, or confirmed breakout above 66.68 depending on trader style.
Target: ~70.63, aligning with the Triple Bottom projection and UFO resistance.
Stop-loss consideration: If prices fall back below the Triple Bottom lows, the breakout thesis would be invalidated.
Here, the options spread itself already caps the maximum loss at $1,750 per spread. Still, traders may choose to exit earlier if the chart setup fails, avoiding full risk.
The defined-risk nature of the spread helps enforce discipline, as the worst-case scenario is known from the outset.
Contract Specs & Margin Considerations
WTI Crude Oil contracts at CME come in two main forms:
Standard CL Contract: Represents 1,000 barrels of crude oil. A single point move = $1,000 P&L impact.
Micro CL Contract (MCL): Represents 100 barrels of crude oil. A single point move = $100 P&L impact.
Both contracts offer powerful ways to trade Crude Oil, and traders also have access to options on the Micro CL contract. This means the same Bull Call Spread structure can be applied with much smaller capital outlay. Instead of ~$1,750 risk per spread with the standard CL options, the risk would be about $175 per spread using MCL options.
The availability of Micro contracts and options provides traders with greater flexibility to tailor exposure to account size and risk tolerance, while still benefiting from the same strategic advantages.
Margin requirements vary depending on the broker and clearing firm, but options spreads like this one are far more capital-efficient compared to holding outright futures. The premium paid becomes the required margin ($1,750 or $175 in this case) as it defines the total risk, without margin calls tied to daily fluctuations.
Risk Management
The hallmark of this Bull Call Spread is defined risk. Unlike a naked long call, where premium decay can erode value quickly, the short 71 Call helps reduce the upfront cost and lowers time decay exposure.
Key considerations:
Position sizing: Limit risk per trade to a fraction of total trading capital.
Time decay management: If the move happens quickly, consider taking profits early instead of holding until expiration.
Adjustment potential: If CL approaches 70 quickly, traders may roll the short call higher to extend potential gains.
Risk management is not just about setting stops; it’s also about designing positions where the worst-case scenario is tolerable before the trade is entered. This Bull Call Spread embodies that principle.
Conclusion
The WTI Crude Oil market is at a pivotal point. With a Triple Bottom base, a breakout above 66.68 could carry prices toward the 70.63 region, where unfilled orders and technical projections converge.
A Bull Call Spread on the Nov-17 expiration offers a structured way to engage with this potential move. It balances opportunity with defined risk, aligning the technical chart setup with the capital efficiency of options on futures.
As always, this is an educational case study designed to highlight how options can be used to structure trades around market scenarios.
When charting futures, the data provided could be delayed. Traders working with the ticker symbols discussed in this idea may prefer to use CME Group real-time data plan on TradingView: www.tradingview.com - This consideration is particularly important for shorter-term traders, whereas it may be less critical for those focused on longer-term trading strategies.
General Disclaimer:
The trade ideas presented herein are solely for illustrative purposes forming a part of a case study intended to demonstrate key principles in risk management within the context of the specific market scenarios discussed. These ideas are not to be interpreted as investment recommendations or financial advice. They do not endorse or promote any specific trading strategies, financial products, or services. The information provided is based on data believed to be reliable; however, its accuracy or completeness cannot be guaranteed. Trading in financial markets involves risks, including the potential loss of principal. Each individual should conduct their own research and consult with professional financial advisors before making any investment decisions. The author or publisher of this content bears no responsibility for any actions taken based on the information provided or for any resultant financial or other losses.
Gold oil9 29 September it occurred to me that I probably should have talked about silver and there were markets that I have posted that are actually doing well and some are not... But since gold was making another new high... I will put out another video later this week.

From Mystery to Mastery: Trading EssentialsIntroduction: Why Trading Feels Like a Mystery
For many aspiring traders, the markets appear as a mysterious puzzle. Prices move in ways that often feel unpredictable, charts are filled with patterns that seem random, and every strategy seems to work until it suddenly doesn’t. This is why trading so often feels like a mystery: it blends human behavior, technical structures, and ever-changing fundamentals into one living system.
Yet behind this apparent chaos lies a logic. The transition from “mystery” to “mastery” begins with understanding that trading is not about luck, but about process. Just like a scientist doesn’t guess but instead forms hypotheses, tests them, and adapts based on evidence, traders must approach the markets with discipline and structure.
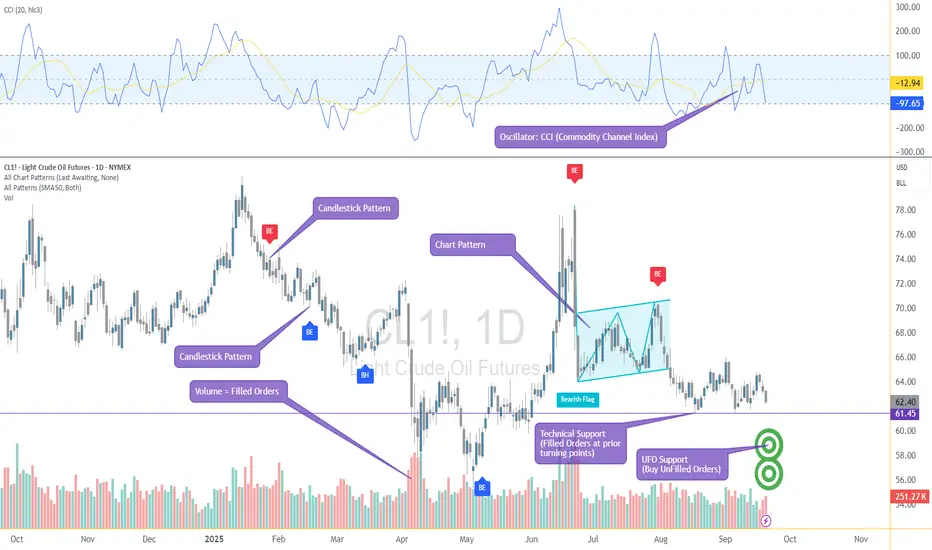
The main chart attached to this article is a good reminder of this. At first glance, it looks overwhelming: candlestick patterns, oscillators, UFO support and resistance zones, chart patterns, and volume data all layered together. But this is not noise — it’s information. Each element highlights a different aspect of market behavior. Once organized and understood, these tools stop being mysterious and instead form the building blocks of trading mastery.
In this guide, we’ll walk step by step through those building blocks: how markets are structured, how trades are placed, how risk is managed, how strategies are built, and how psychology influences decisions. Along the way, you’ll see how these concepts work together to transform confusion into clarity.
Trading mastery doesn’t come overnight, but the journey begins the moment you stop chasing secrets and start building a foundation.
Understanding Market Types
Not all markets are created equal. Before diving into strategies and chart patterns, it’s important to recognize that different markets operate under different structures. Knowing where you are trading — and how those markets function — can be the difference between confidence and confusion.
Exchange-Traded Markets
In exchange-traded markets such as futures or stocks, trading takes place on centralized venues. This means:
Prices are transparent, with all participants seeing the same quotes.
Orders are matched through a regulated system, reducing counterparty risk.
Clearing houses guarantee performance, ensuring that when one side of a trade wins, the other side’s obligations are met.
This structure creates confidence, especially for leveraged instruments like futures, where position sizes can be large.
Over-the-Counter (OTC) Markets
On the other side, forex, crypto and many other derivatives are traded over-the-counter. Here, there is no central exchange — trades are made directly between counterparties, such as banks or brokers.
Prices can vary slightly between providers.
Liquidity depends on the institution offering quotes.
Most importantly, there is counterparty risk — the risk that the other side may not honor the trade.
While OTC markets can be deep and liquid, traders must understand the role of intermediaries and the risk they take on when choosing where and how to trade.
Why It Matters
The choice between exchange-traded and OTC instruments affects everything: order execution, spreads, transparency, and even regulation. Many professional traders favor exchange-traded products for their transparency and reliability, but OTC instruments remain popular due to accessibility and flexibility.
Whether you’re trading futures on the CME or currency pairs in the OTC forex market, the principle is the same: know your marketplace, because the rules of engagement define the playing field.
The Mechanics of Trading
Once you know where you’re trading, the next step is to understand how trades are actually placed. This is where many traders feel overwhelmed, because order types, execution rules, and volume data can feel like a different language. But when broken down, the mechanics are straightforward.
Order Types: The Building Blocks
Market Orders: Execute immediately at the best available price. Fast, but can suffer from slippage in fast-moving markets.
Limit Orders: Specify the maximum price you’re willing to pay (buy) or the minimum price you’ll accept (sell). Excellent for controlling entry, but no guarantee of execution.
Stop Orders: Triggered once price hits a certain level, commonly used for stop-losses.
Bracket Orders: Automating Discipline
One of the most practical tools for managing trades is the bracket order. Instead of placing just an entry, a bracket order automatically places:
A stop-loss order to protect against adverse moves.
A profit-taking order to lock in gains.
This setup creates a “bracket” around your trade, ensuring that risk and reward are defined from the start. It shifts the trader’s mindset from hoping to managing.
Volume: The Footprint of Filled Orders
Volume is more than a number at the bottom of a chart — it’s the record of filled orders. When volume surges at a level, it shows where buyers and sellers agreed most aggressively. Combined with support/resistance or UFO zones, volume can help traders identify which levels have strong institutional participation.
Execution Matters
Bid-ask spreads, commissions, and slippage all impact profitability. A great strategy can still fail if execution costs aren’t managed. This is why many traders choose more liquid products — deeper liquidity usually means tighter spreads and better fills.
By mastering these mechanics — order types, brackets, and the interpretation of volume — traders gain the ability to structure trades with precision instead of improvisation.
Core Principles of Risk Management
If there’s one constant across all successful traders, it’s this: they never risk their capital blindly. Strategies may differ, but the principles of risk management remain universal.
Risk per Trade
A common practice is to limit the risk of any single trade to a small percentage of account equity — often 1–2%. This way, even a series of losing trades doesn’t wipe out a portfolio.
Position Sizing
Lot size isn’t just about ambition, it’s about survival. Position sizing must reflect both account size and volatility of the instrument. A highly volatile product like crude oil futures demands a smaller size than a low-volatility product like Treasury futures, even if account equity is the same.
Reward-to-Risk Ratio
Before placing a trade, the potential reward should always justify the risk. For example, risking 10 points to potentially gain 30 points gives a 3:1 reward-to-risk ratio — meaning you can be wrong more often than right and still be profitable over time.
Support, Resistance, and UFO Levels
Risk management becomes more effective when combined with technical reference points. Placing a stop-loss just beyond a well-defined support or UFO zone means that if price breaks through, the trade’s premise is invalidated. Similarly, setting profit targets near resistance zones allows traders to exit before momentum fades.
The Role of Discipline
None of these rules matter without discipline. A trader who moves stops, doubles down on losers, or takes oversized positions is effectively abandoning their edge. Consistency, not heroics, is what keeps traders in the game long enough to grow.
By embedding risk management into every decision, traders shift from chasing trades to controlling outcomes. The market will always be uncertain, but risk can always be defined.
Strategy Frameworks
While no strategy works all the time, every successful trader operates within a clear framework. Frameworks provide structure, helping traders decide when to engage the market and how to manage trades once they’re in.
Trend Following
The principle: “the trend is your friend.”
Traders look for higher highs and higher lows in an uptrend, or lower highs and lower lows in a downtrend.
Tools: moving averages, trendlines, and momentum indicators help confirm direction.
Mean Reversion
The assumption: prices oscillate around a fair value.
Traders buy when prices move far below the average and sell when they stretch too far above.
Tools: oscillators such as RSI or Stochastics signal overbought/oversold conditions.
Breakout Trading
Focused on capturing momentum when price escapes a range.
Traders identify consolidation zones and look for strong volume when price breaks through support or resistance.
Tools: candlestick patterns and chart patterns (triangles, rectangles, flags) often mark breakout points.
Volatility-Based Trading
Markets don’t just move in one direction; they expand and contract in volatility cycles.
Volatility traders adapt position size, target levels, and even strategy choice depending on whether the market is calm or turbulent.
The Role of Confirmation
Frameworks are strengthened when multiple signals align. For example, a breakout confirmed by a candlestick pattern and supported by volume at a UFO level carries more weight than a breakout without confirmation.
By mastering these strategy families, traders learn to adapt their approach to different environments instead of forcing one method onto all markets. Flexibility, not rigidity, is the true hallmark of mastery.
The Trader’s Process as a Scientific Method
The biggest difference between beginners and professionals isn’t the chart setup — it’s the process. Professionals treat trading as a science, not a game.
Step 1: Form a Hypothesis
Just like in a laboratory, the process begins with a hypothesis: “If price breaks above resistance with strong volume, then it is likely to continue higher.” The hypothesis defines what you expect and under what conditions.
Step 2: Backtest the Hypothesis
Rather than risking money immediately, traders test their idea against historical data. The goal is not to prove the trade will work, but to see whether it has worked consistently under similar conditions.
Step 3: Evaluate the Results
If backtesting shows inconsistent outcomes, the hypothesis must be refined or discarded. If results show positive expectancy, the door opens to the next stage.
Step 4: Trade Small in Live Markets
Even a strong backtest doesn’t guarantee success in the real world. Execution, slippage, and emotions enter the equation. That’s why traders begin with small size in live markets to confirm that performance holds.
Step 5: Scale with Confidence
Only after a hypothesis survives both backtesting and live verification should size be increased. At this point, the trader has turned uncertainty into structured probability.
By approaching the market scientifically, traders avoid gambling behavior. Instead of chasing tips or hunches, they move step by step, letting data guide decisions. In doing so, they transform trading from a mysterious guessing game into a disciplined pursuit of mastery.
Psychology of Trading
Even with a solid strategy and risk plan, many traders still struggle — not because the markets beat them, but because their own minds do. Psychology is the silent force that shapes every decision.
Discipline Over Impulse
The temptation to move stops, double down on losing trades, or exit winners too early is constant. Without discipline, even the best strategy collapses under emotional pressure.
Common Biases
• Recency bias: believing that the most recent outcome will repeat.
• Loss aversion: cutting winners short while letting losers run.
• Confirmation bias: searching for information that supports your existing view while ignoring evidence against it.
Emotional Cycles
Traders often swing between fear and greed. Fear prevents them from taking valid setups, while greed leads them to overtrade or oversize. Recognizing these emotional cycles is the first step toward controlling them.
The Power of Journaling
A trading journal records not just trades, but also the reasoning and emotions behind them. Over time, it becomes a mirror that reveals behavioral patterns — both strengths and weaknesses.
Process > Outcome
Individual trade results are largely random. Mastery comes from focusing on process rather than outcome. Following the plan consistently matters more than whether the next trade wins or loses.
By understanding and managing psychology, traders learn to master themselves first. The market will always test patience and conviction, but the disciplined trader treats emotions as signals to be managed — not instructions to follow.
Case Study: A Structured Trade Example
Theory becomes powerful only when applied in practice. Let’s walk through a trade example using the below chart attached.
Setup
The market is trending upward, confirmed by the SMA ribbon sloping higher.
A UFO support zone aligns with prior price action, creating a logical area where buyers may step in again.
A candlestick wick test into this zone provides confirmation of demand.
Trade Execution
Entry: Buy as price approaches the UFO support zone, in line with the trend.
Bracket Order: Place both a stop-loss and a profit target automatically.
(Stop-Loss: Positioned just below the UFO support zone. If price breaks down through support, the trade’s hypothesis is invalid. | Target: Set at the next UFO resistance zone, where prior sellers are likely to appear.)
Risk-to-Reward Balance
The defined stop ensures risk is limited.
The distance from entry to target is significantly larger than the distance to the stop, producing a favorable reward-to-risk ratio.
Outcome
Whether this trade wins or loses is secondary — the key is that it was structured with:
A clear hypothesis.
A defined entry, stop, and target.
Proper use of a bracket order.
Risk contained and reward potential aligned.
This is what separates structured trading from guesswork. Each element — support, UFOs, moving averages, and volume — works together as part of a process-driven decision, not an emotional one.
Conclusion: From Mystery to Mastery
For many traders, the markets begin as a blur of candles and numbers — a mystery that seems impossible to solve. But as we’ve seen, mastery doesn’t come from secrets or shortcuts. It comes from building a structured foundation:
Knowing the market type you’re trading, and whether it’s exchange-traded or over-the-counter.
Understanding the mechanics of orders, brackets, and volume.
Applying risk management principles that define losses before they happen.
Using strategy frameworks to adapt to different conditions.
Following a scientific process that tests hypotheses before scaling them.
Developing the psychological discipline to follow the plan consistently.
Executing trades with structure, where every element — entry, stop, and target — has a reason.
Trading mastery is not about eliminating uncertainty. It’s about controlling what you can — risk, process, discipline — and allowing the market to do the rest. The mystery never fully disappears, but with the right approach, it becomes manageable, even profitable.
This article is the first step in our From Mystery to Mastery series. Here, we’ve laid the foundation for trading in general. From here, we’ll expand into the specialized worlds of futures and options, where leverage, diversification, and advanced strategies open even more doors.
The journey continues — but the path is now clearer.
From Mystery to Mastery trilogy:
When studying markets, it’s important to remember that chart data can sometimes be delayed. This article has presented concepts that apply broadly to trading across all asset classes. The chart examples used here happen to feature products listed on exchanges operated by the CME Group. For traders who follow these products closely and wish to access real-time market data, TradingView offers a dedicated CME Group real-time data plan: www.tradingview.com . This is particularly relevant for shorter-term traders who depend on precise price action, though longer-term participants may find delayed data sufficient for their needs.
General Disclaimer:
The trade ideas presented herein are solely for illustrative purposes forming a part of a case study intended to demonstrate key principles in risk management within the context of the specific market scenarios discussed. These ideas are not to be interpreted as investment recommendations or financial advice. They do not endorse or promote any specific trading strategies, financial products, or services. The information provided is based on data believed to be reliable; however, its accuracy or completeness cannot be guaranteed. Trading in financial markets involves risks, including the potential loss of principal. Each individual should conduct their own research and consult with professional financial advisors before making any investment decisions. The author or publisher of this content bears no responsibility for any actions taken based on the information provided or for any resultant financial or other losses.
CRUDE OILPreferably suitable for scalping and accurate as long as you watch carefully the price action with the drawn areas.
With your likes and comments, you give me enough energy to provide the best analysis on an ongoing basis.
And if you needed any analysis that was not on the page, you can ask me with a comment or a personal message.
Enjoy Trading ;)

OILPreferably suitable for scalping and accurate as long as you watch carefully the price action with the drawn areas.
With your likes and comments, you give me enough energy to provide the best analysis on an ongoing basis.
And if you needed any analysis that was not on the page, you can ask me with a comment or a personal message.
Enjoy Trading ;)

Breaking: Crude Oil Trading at Key Levels Ahead of Q4 Upswing Current Price: $65.13
Direction: LONG
Targets:
- T1 = $67.50
- T2 = $70.00
Stop Levels:
- S1 = $63.50
- S2 = $62.00
**Wisdom of Professional Traders:**
This analysis synthesizes insights from thousands of professional traders and market experts, leveraging collective intelligence to identify high-probability trade setups. Professional traders are currently closely monitoring Crude Oil for potential growth as fundamental drivers align for a bullish outlook. The wisdom of crowds suggests the current pricing and market dynamics could offer compelling upside opportunities for traders and investors alike, particularly as demand is expected to surge in Q4 2025 combined with constrained supply factors.
**Key Insights:**
Crude Oil prices are positioned for growth in Q4 2025, driven by increased demand from upcoming seasonal consumption and recovering global industrial output. Analysts point toward higher oil consumption signals in Europe and Asia, particularly as China ramps up industrial production following stimulus measures earlier this year. Additionally, OPEC+ remains committed to maintaining supply discipline, ensuring that stock draws are consistent across global inventories. Technical indicators, including bullish moving average convergence divergence (MACD) and relative strength index (RSI), currently show momentum shifting in favor of longs as buyers consolidate around $65.
Geopolitical tensions continue to be at the forefront of energy price discussions. Trader sentiment suggests that recent developments in oil-producing regions could amplify supply risks, adding tailwinds for price growth. Combined with refinery demand ahead of winter and constrained inventories, crude oil appears poised for potential upside movement through November.
**Recent Performance:**
Crude Oil prices have experienced consolidation near the $65 level over the past two weeks after climbing from lows of $58 earlier in Q3 2025, driven by increased geopolitical concerns and tighter OPEC+ production quotas. Despite some short-term fluctuations attributed to rate hike fears, the overall trajectory remains stable, setting the stage for significant upside into October. The current price action reflects strong support near $63, making a case for bullish positions at these levels.
**Expert Analysis:**
Seasoned commodity analysts highlight that the $65 level is a critical resistance-turned-support zone, implying that further closing strength above $65.50 could solidify the bullish momentum, with prices likely testing the $70 mark in the coming weeks. Fundamental factors align with technical setups, giving traders the confidence to enter long positions early. Additionally, price targets of $67.50 and $70 appear reasonable based on historical resistance points from Q1 2025. Experts caution traders to closely monitor any shifts in OPEC+ statements for potential supply-side adjustments, as these could influence the price trajectory.
**News Impact:**
Recent headlines surrounding OPEC+ production discipline and tight inventories across the United States have strengthened the bullish case for Crude Oil. The Energy Information Administration (EIA) recently reported inventory draws in line with projections, supporting higher demand assumptions. Meanwhile, cooling global inflation figures have reduced pressure on central banks, which could indirectly favor industrial activity and commodity demand moving into Q4 2025. Combined, these developments enhance the backdrop for a sustained oil price rally leading into the end of the year.
**Trading Recommendation:**
Based on current technical and fundamental dynamics, traders are advised to take a LONG position on Crude Oil at or near $65.13, targeting price gains to $67.50 (T1) as the first breakout zone and $70.00 (T2) as a secondary profit level. Stops should be placed at $63.50 (S1) to manage downside risk, with a wider stop zone at $62.00 (S2) to align with volatility conditions. Positive seasonal demand, geopolitical constraints, and strong technical signals make crude oil an attractive opportunity heading into Q4 2025, while disciplined position sizing mitigates any macroeconomic uncertainty.
Do you want to save hours every week? Register for the free weekly update in your language!

Q4 2025 Oil Market Outlook: WTI and Brent Crude Analysis**September 27, 2025**
## **Executive Summary**
As the global energy landscape enters the final quarter of 2025, the oil market remains delicately balanced between oversupply pressures and persistent geopolitical risks. West Texas Intermediate (WTI) and Brent Crude—two of the world’s most closely watched benchmarks—are trading in a narrow range, reflecting cautious sentiment among traders and investors. This report provides a comprehensive analysis of current market dynamics, evaluates key drivers, and offers a professional forecast for Q4 2025.
---
## **Current Market Snapshot**
- **WTI Crude (as of September 26, 2025):** $65.37/bbl
- **Brent Crude:** $69.72/bbl
- **YTD Performance:** WTI down ~14.8% from 2022; Brent down ~12.3%
Both benchmarks have shown resilience in recent weeks, supported by seasonal demand and inventory drawdowns, but face headwinds from rising global supply and economic uncertainty.
---
## **Fundamental Drivers**
### **1. Supply-Side Dynamics**
- **OPEC+ Production Increases:** OPEC+ has announced a phased increase of 547,000 barrels per day starting in September , with further adjustments planned for October. This marks the final unwinding of the 2.2 million bpd voluntary cuts initiated in late 2023.
- **Non-OPEC+ Output Growth:** U.S. production remains robust at 13.4 million bpd, with additional supply from Canada and Guyana contributing to a projected global surplus of 1.5% in Q4 .
### **2. Demand Outlook**
- **Global Demand Growth:** Forecasted to slow to ~1.1 million bpd in 2025, down from 1.8 million bpd in 2024.
- **Seasonal Trends:** Winter heating demand may offer temporary support, but overall consumption is expected to contract by 230,000 bpd in Q4.
### **3. Geopolitical Risks**
- **Russia-Ukraine Conflict:** Continued strikes on Russian energy infrastructure and renewed sanctions have injected volatility into the market.
- **Middle East Tensions:** Drone attacks and Red Sea disruptions have added risk premiums to Brent pricing.
- **U.S. Tariff Policy:** Aggressive energy tariffs and diplomatic pressure on European allies to reduce Russian imports have further complicated trade flows.
---
## **Technical Analysis & Market Sentiment**
### **WTI Crude**
- **Support Levels:** $62.90, $61.50
- **Resistance Levels:** $66.00, $68.00
- **Trend:** Neutral to mildly bearish; RSI hovering near 50.
### **Brent Crude**
- **Support Levels:** $67.00, $65.70
- **Resistance Levels:** $70.30, $72.00
- **Trend:** Consolidating in a symmetrical triangle; breakout potential remains.
---
## **Institutional Forecasts for Q4 2025**
Institution | WTI Forecast (Q4 2025) | Brent Forecast (Q4 2025)
------------------------|------------------------|---------------------------
EIA | $55.41 | $59.00
J.P. Morgan | $57.00 | $63.57
Goldman Sachs | $60.30 | $63.57
Trading Economics | $62.43 | $67.65
Reuters Poll | $64.65 | $68.20
---
## **Q4 2025 Price Forecast & Rating**
### **WTI Crude Oil**
- **Forecast Range:** $58.00 – $64.00
- **Base Case:** $60.00
- **Rating:** **Neutral to Bearish**
- **Key Risks:** Inventory builds, slowing demand, U.S. shale resilience
### **Brent Crude Oil**
- **Forecast Range:** $62.00 – $68.00
- **Base Case:** $65.00
- **Rating:** **Neutral**
- **Key Risks:** Geopolitical shocks, OPEC+ policy shifts, European demand softness
---
## **Strategic Implications for Stakeholders**
- **Investors:** Expect continued volatility; hedge positions via options and futures.
- **Producers:** Prepare for margin compression; focus on cost efficiency and capital discipline.
- **Policymakers:** Monitor inflationary impacts and energy security amid geopolitical tensions.
---
## **Conclusion**
The Q4 2025 oil market is poised for a cautious and potentially volatile close to the year. While geopolitical risks offer short-term support, the structural oversupply and weakening demand fundamentals suggest limited upside for both WTI and Brent. Market participants should brace for a range-bound environment with breakout risks tied to geopolitical developments and OPEC+ policy shifts.
---
Risk Disclaimer!
General Risk Warning: Trading on the Financial Markets, Stock Exchange and all its asset derivatives is highly speculative and may not be suitable for all investors. Only invest with money you can afford to lose and ensure that you fully understand the risks involved. It is important that you understand how Trading and Investing on the stock exchange works and that you consider whether you can afford the high risk of loss.

Crude Oil Target LongStrong Buy until Daily Bearish FVG
With news on Russia cuts fuel exports, Crude Oil is expected to continue Bullish during US AM sessions.
Expected a manipulation during london session.

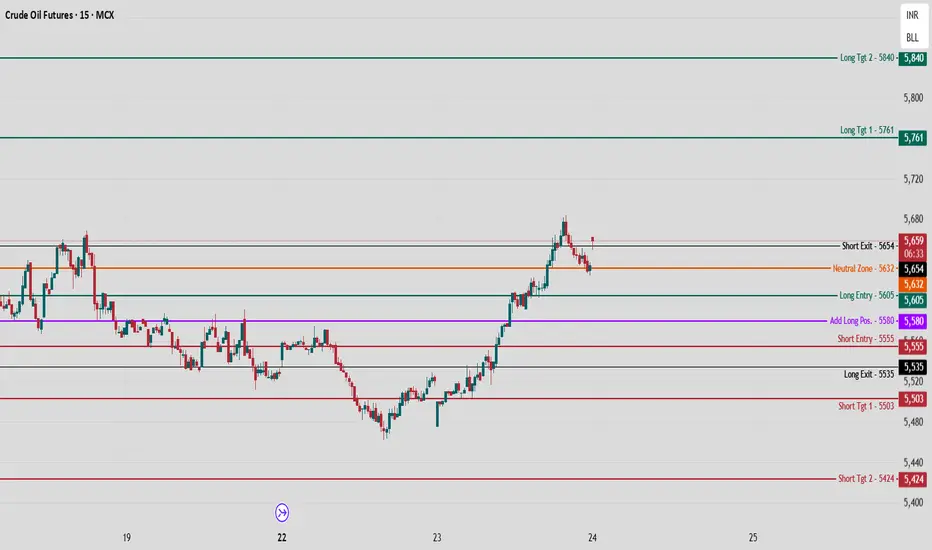
Crude Oil MCX Future Intraday Analysis - 24 Sept., 2025MCX:CRUDEOIL1!
Crude Oil is consolidating near 5,658 after a sharp upside move, reacting to mapped levels designed for intraday momentum traders.
Long Trade Logic
Long Entry (5,605):
Enter long above 5,605, as prior resistance now acts as support. Momentum buyers may lift prices further if this level holds on a retest.
Consider adding near 5,580 for pyramiding if price action sustains above this band.
Targets (5,761 / 5,840):
First target (5,761): Anticipate supply at previous swing high where price faced resistance earlier.
Second target (5,840): Upper resistance mapped from previous session’s range extremes, expect potential profit-taking.
Stop Loss Placement:
Keep stops below 5,555 to mitigate risk, as breakdown here signals failed uptrend and may trigger aggressive selling.
Short Trade Logic
Short Entry (5,555):
Go short beneath 5,555, as breach of this level breaks the structure and signals bears regaining control.
Targets (5,503 / 5,424):
Target 1 (5,503): Previous intraday pivot, where covering and bounce attempts may emerge.
Target 2 (5,424): Deeper support—if hit in momentum, expect further liquidation.
Short Exit / Stop:
Exit shorts above 5,634 (Short Exit) to avoid whipsaw. Indicates failed breakdown and recovery by bulls.
Neutral Zone & Structure Logic
Neutral Zone (5,632):
Price trading in 5,632 zone signals indecision; best to avoid new trades unless decisive break above/below occurs.
Structural View:
The recent rally and subsequent pullback to the mapped levels provides a framework for range-based or momentum trades.
Volume confirmation near entry levels is suggested for sustaining positions.
This chart logic ensures discipline, risk management, and clarity for both breakout and reversal-oriented trading approaches on MCX Crude Oil Futures intraday.
Follow Chart Pathik for more such analysis!
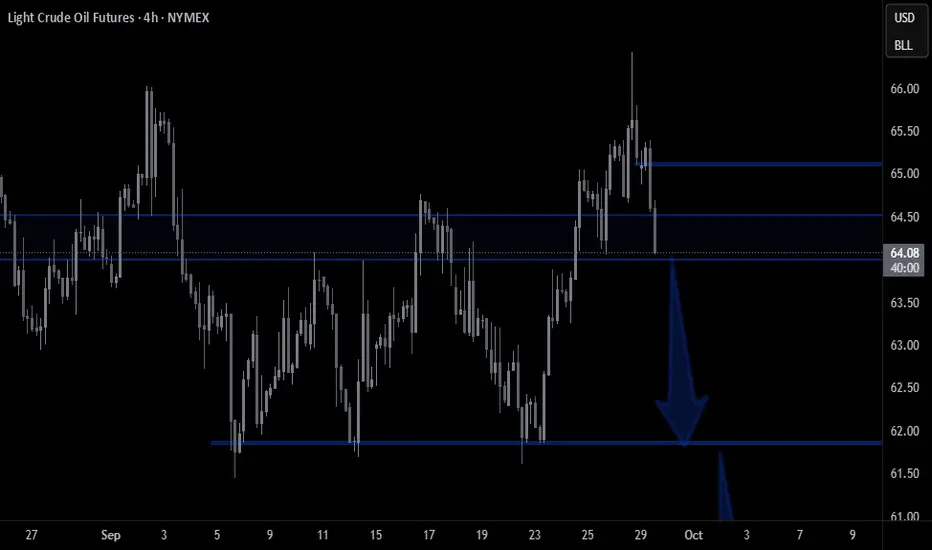
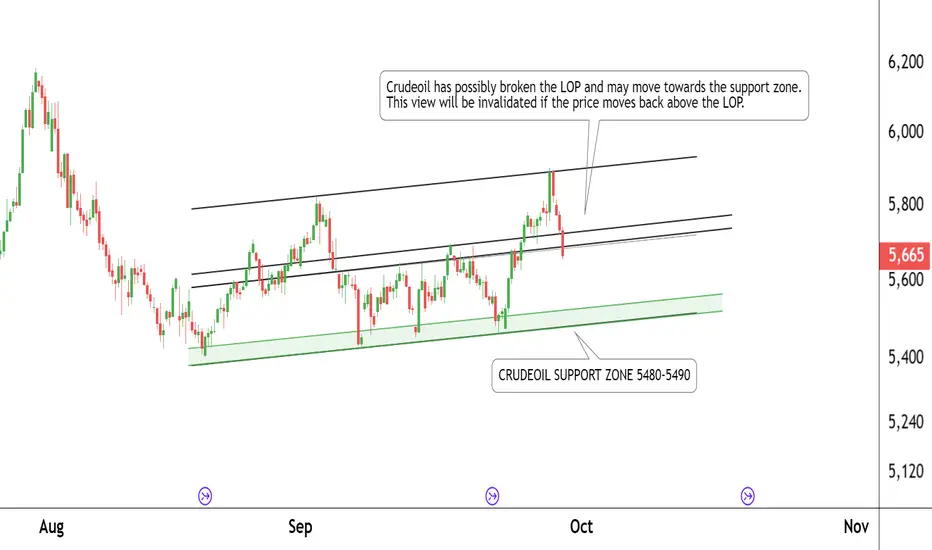
Crude Oil Breakdown – Short Trade ViewThis is the 4-hour timeframe chart of Crude Oil.
Crude Oil has broken the LOP support zone around 5700–5720.
The next key support zone is placed around 5480–5490.
The previous LOP zone may now act as a resistance.
If this resistance holds, Crude Oil prices may continue to move lower.
Thank You!!
CrudeOil - Long TradeCrudeOil - Long Trade
After this compression, price has break resistence zone and can have a potential final rally
Final 5 wave is on going

Crude Oil Pivot at $65 | Break & Hold Fuels UptrendLast Sunday Opec+ agrees further oil output boost by 137K barrels per day, but less than Sep / Aug output, when market open it went higher.
How to manage short-term risk, in this case opportunity with CME Group weekly energy options on such a scheduled announcement?
Video version:
Crude Oil Futures & Options
Ticker: CL
Minimum fluctuation:
0.01 per barrel = $10.00
Disclaimer:
• What presented here is not a recommendation, please consult your licensed broker.
• Our mission is to create lateral thinking skills for every investor and trader, knowing when to take a calculated risk with market uncertainty and a bolder risk when opportunity arises.
CME Real-time Market Data help identify trading set-ups in real-time and express my market views. If you have futures in your trading portfolio, you can check out on CME Group data plans available that suit your trading needs tradingview.com/cme/

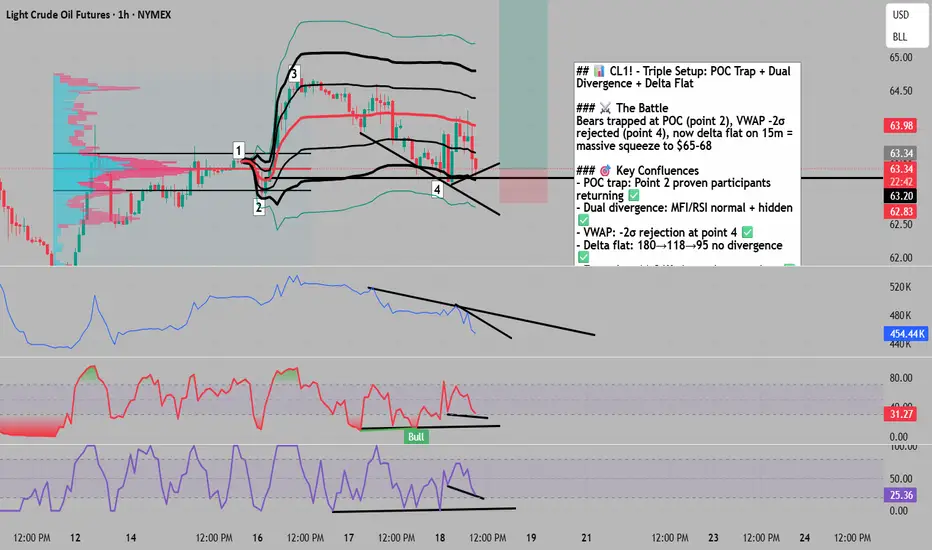
Triple Confluence: POC Return + Dual Divergence + Delta Flat🔥 CL1! Triple Confluence: POC Return + Dual Divergence + Delta Flat
The Market Participant Battle:
Bears have been systematically crushed at three critical junctures. First, at point 2 (the POC from swing 0→3), establishing proven trapped participants. Second, at point 4 where price pierced VWAP's 2nd deviation only to violently reject. Now, on the 15-minute entry timeframe, we see the final capitulation signal: delta remaining completely flat (no divergence) while price shows bullish divergence. This triple-layered setup reveals bears are not just beaten - they're exhausted, absorbed, and about to fuel a squeeze back to the $65-68 resistance zone as price returns to reclaim the proven participants at point 2.
Confluences:
Confluence 1: POC Market Participant Trap (1H Chart)
The hourly chart reveals the foundation of this trade: Point 2 marks the Point of Control from the major swing 0→3, where maximum volume traded hands. When price closed above point 1, these participants became trapped bears. Now at point 4, we're returning to this proven battleground where shorts will be forced to cover. The numbered reference points (1,2,3,4) map the complete journey of market participants from accumulation to distribution to the current return phase.
Confluence 2: Dual MFI/RSI Divergences (1H Chart)
Both MFI and RSI show an extraordinary dual-divergence setup. First, a normal bullish divergence where price made lower lows while indicators made higher lows. Second, a hidden/continuation divergence confirming the underlying trend remains bullish. This rare combination of two different divergence types on the same indicators typically precedes 3-5% moves. The divergences span from point 2 through point 4, showing sustained buying pressure despite price weakness.
Confluence 3: VWAP 2nd Deviation Rejection + Delta Flat Entry
Using VWAP anchored from point 1, price at point 4 pierced the -2 standard deviation before snapping back - a classic institutional accumulation signal. Now on the 15-minute entry timeframe, we see the trigger: delta completely flat (180→118→95) showing no divergence despite price attempts lower, combined with bullish price divergence. Volume footprint s
CRUDE OILPreferably suitable for scalping and accurate as long as you watch carefully the price action with the drawn areas.
With your likes and comments, you give me enough energy to provide the best analysis on an ongoing basis.
And if you needed any analysis that was not on the page, you can ask me with a comment or a personal message.
Enjoy Trading ;)

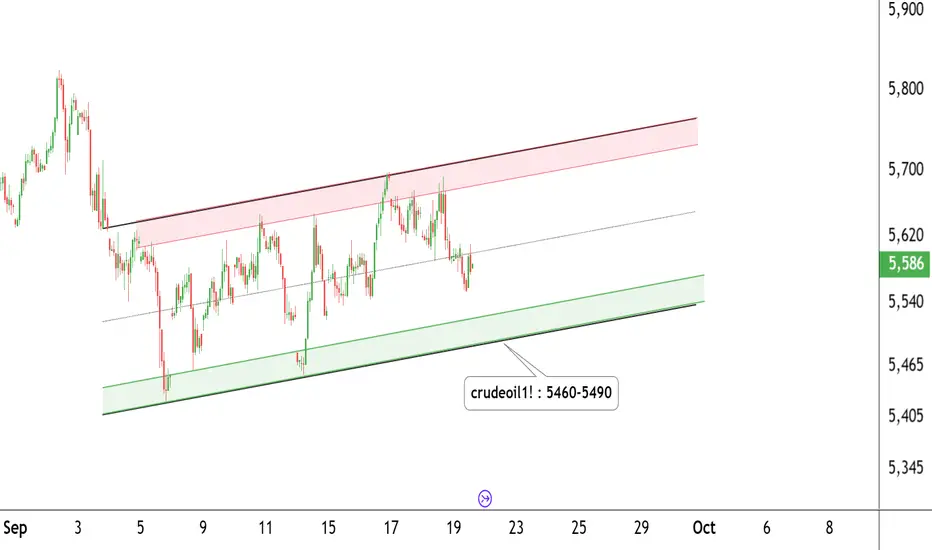
Crude Oil Trading Levels – Plan Your Move!CRUDE OIL – Daily Timeframe Update
Crude Oil is trading within a well-defined parallel channel on the daily chart.
The price is currently taking support near the 5460–5490 zone and moving within an ascending channel.
Support Zone: 5460 – 5490
Resistance Zone: 5700 – 5720
If these levels sustain, we may see higher prices ahead in Crude Oil.
Thank you!!
CRUDE OILPreferably suitable for scalping and accurate as long as you watch carefully the price action with the drawn areas.
With your likes and comments, you give me enough energy to provide the best analysis on an ongoing basis.
And if you needed any analysis that was not on the page, you can ask me with a comment or a personal message.
Enjoy Trading ;)
