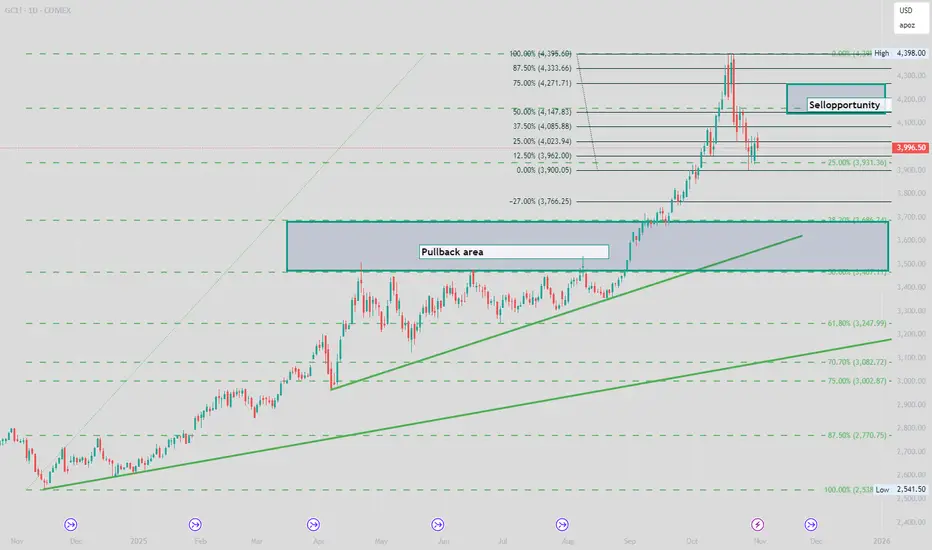
Massive move in GC this year, what now ?Gold has been on a tear this year to the top a combination of factors, massive buying by central banks and hedging against any potential turmoil i the markets, dips have been limited but we could be seeing a deeper correction before the resumption of the move higher and testing $5000
Gold Mini Futures
Trade ideas
Gold Bush dont rush put a flush but stay hush
Do you really see what's happening here? I
was Not able to use my indictors and New
Algos Bc they are private or unpublished
Wouldn’t you join then if that was The
Case?? previews thsnkd TV , getting into sharing ideas here and youll love them

US Employment Data Positive for GOLD Prices. Can GOLD reverse?GOLD is declining in falling channel pattern however seems to be taking support at the marked trendline.
US Employment data came just in where number of jobs added was better than expectations which would mean a stronger labour market and inflation might stay elevated which is good for GOLD/SILVER due to safe haven demand in the long term.
Keep an eye on GOLD prices.

Gold futures max in 4hGold futures max in 4h and trying to identify the trendlines to find entry stop-loss and targets based on 4h time frame.
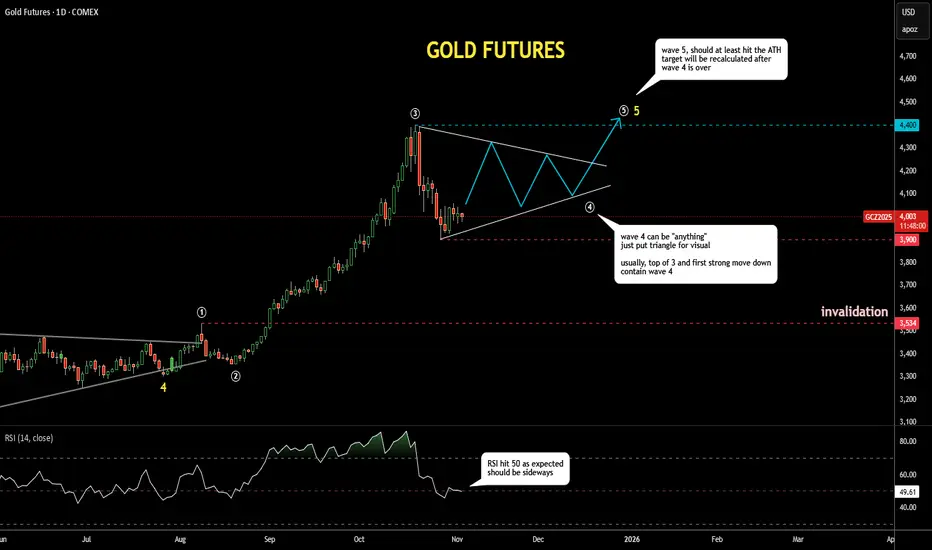
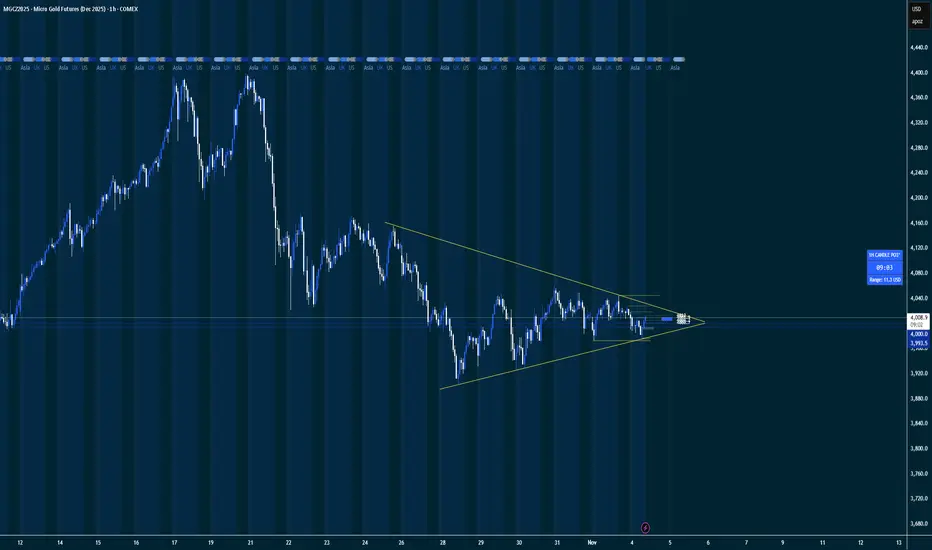
Gold Update 04NOV2025: Wave 4 Dropped Into Target AreaGold futures dropped into the pink-box target area based on the Fibonacci retracement between $3,750 and $4,000.
As expected, the RSI has reached the 50 “waterline”, where it could find some support and start moving around that level.
Many traders lose money in fourth waves, as they can be “anything” and often last longer than one’s pocket. I’ve outlined a triangle shape in wave 4 just for visual context.
The range built through the peak of wave 3 around $4,400 and the bottom of recent panic selling near $3,900 will likely contain most of the volatility in wave 4.
It can take time… testing one’s patience.
GOLD: Bullish! Continue To Buy! The +FVG Is Holding!In this Weekly Market Forecast, we will analyze the Gold (XAUUSD) for the week of Nov. 3 - 7th.
Gold has completed the pullback into the Weekly +FVG. It has moved sideways since, but inching higher.
Buys are valid. They have the highest probability.
Sells become valid only after a bearish break of market structure!
Enjoy!
May profits be upon you.
Leave any questions or comments in the comment section.
I appreciate any feedback from my viewers!
Like and/or subscribe if you want more accurate analysis.
Thank you so much!
Disclaimer:
I do not provide personal investment advice and I am not a qualified licensed investment advisor.
All information found here, including any ideas, opinions, views, predictions, forecasts, commentaries, suggestions, expressed or implied herein, are for informational, entertainment or educational purposes only and should not be construed as personal investment advice. While the information provided is believed to be accurate, it may include errors or inaccuracies.
I will not and cannot be held liable for any actions you take as a result of anything you read here.
Conduct your own due diligence, or consult a licensed financial advisor or broker before making any and all investment decisions. Any investments, trades, speculations, or decisions made on the basis of any information found on this channel, expressed or implied herein, are committed at your own risk, financial or otherwise.

Gold Futures (MGCZ2025) — Weekly FVG Magnet & Potential ReversalPrice has been respecting Standard Deviation levels beautifully across the H4, Daily, and Weekly timeframes. The market recently rejected the H4 FVG and is now hovering mid-range, with a Weekly Fair Value Gap left open below.
This imbalance could attract price early in the week, creating a liquidity grab and possible weekly low before Gold flips bullish again.
Key Levels:
🟤 H4 FVG rejection zone: 4,040 – 4,080
🔵 Weekly FVG target: 3,880 – 3,900
⚫ Weekly High: 4,124
⚫ Weekly Low: 3,901
Narrative:
I’m expecting price to push into the Weekly FVG discount zone early in the week — potentially aligning with high-impact financial news — and then reverse bullish for a mid-week or end-of-week rally.
Watch For:
Price displacement or BOS near the Weekly FVG
Killzone reactions (London & NY)
Volume and order flow confirmation before entering
Bias: Short-term bearish → medium-term bullish
Invalidation: Sustained trade below 3,842 (Weekly Lows & -1σ zone breach)

Choosing Your Path in Futures TradingThere’s more than one way to participate in the futures markets. Whether you're hands-on or prefer a more passive approach, selecting the right method depends on your trading goals, risk tolerance, and available time. Here’s a breakdown of the most common approaches used by active and aspiring futures traders.
1. Self-Directed Trading
If you like full control over your trades, this approach is for you. It requires staying up to date on market news, analyzing charts, and executing your own trades according to a plan and framework which can be referred to as your “strategy.” Experienced traders may prefer this model for its flexibility and transparency.
Past performance is not indicative of future results.
2. Automated Trading Systems
These systems use predefined rules to analyze data and execute trades without manual intervention. They can be ideal for traders who want to capitalize on algorithmic speed and logic while minimizing emotional decision-making, or for traders who might not have the time to dedicate to self-directed trading.
EdgeClear offers connectivity to a handful of automated programs, if you are interested in learning more please contact us.
3. Managed Futures
For a more passive route, managed futures allow you to invest in futures contracts through a Commodity Trading Advisor (CTA) or Commodity Pool Operator (CPO). The advisor handles the trading, using their expertise to manage risk and seek opportunity.
4. Broker-Assisted Trading
Prefer to have a trusted guide by your side? With broker-assisted trading, a professional helps execute trades, manage risk, and offer support—all tailored to your preferences.
Key Takeaway
Every trader’s journey in the futures markets looks different. Whether you thrive on taking full control of your trades, prefer automated systems, or rely on professional guidance, the key is to find the approach that aligns with your goals, risk tolerance, and lifestyle.
Understanding the options available self-directed, automated, managed, or broker-assisted empowers you to trade more confidently and effectively.
Call to Action
At EdgeClear, we’re dedicated to helping traders at every level find the tools, guidance, and support they need to succeed. Explore our platforms, connect with our expert brokers, or follow us on TradingView to discover more Trade Ideas and educational content to refine your edge.
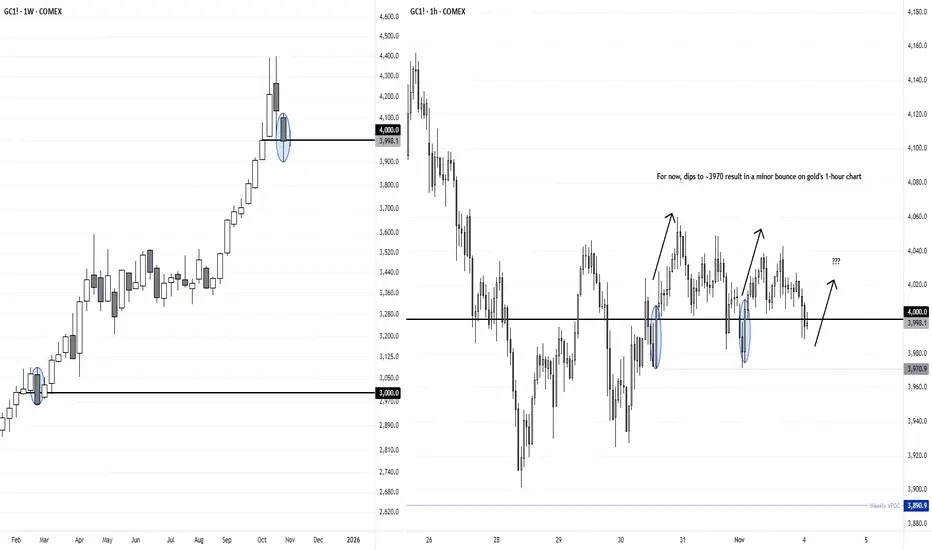
Gold Bulls Defend the $4000 Level as Bears Struggle for ControlGold closed lower for a second week, and prices are now meandering around the 4000 handle. We can see that the last time it tried to break back below such a milestone level, gold bear sonly managed a single weekly close below 3000 before the rally continued.
I doubt we’ll see another 1000 directly from current levels, and my bias is actually for the retracement to eventually dip lower before its bullish trend resumes. But for now, traders could seek false breaks below 4000 in anticipation of at least a minor move higher.
My video from Friday provides a bullish bias on the daily timeframe over the near term which still stands. But for those on intraday timeframes, notice that bullish engulfing candles have appeared on the 1-hour chart on the prior two occasions that gold tried (but failed) to break beneath 4000. It’s as if gold bears are trying to force the golden beach ball below its 4000 waterline.
Matt Simpson, Market Analyst at City Index
1H DIRECTION SHIFT SELLING OPPORTUNITY1. If Direction Shift happens in internal structure, it's a signal of selling oppo.
2. On Base wait for one Hour selling engulf candle enter on retest and sell.
3. TP1 is 3990 and TP2 is bigger till 3790

Bearish Scenario (primary)Bearish Scenario (primary)
Bias: Still bearish until price can reclaim 4020+ on 4H.
Setup idea:
Entry: 4008–4012 (retest of imbalance / EMA cluster).
Stop-loss: 4022–4025 (above 4H minor swing and trendline).
Targets:
TP1 → 3980 (1H structure low / EMA200 zone)
TP2 → 3960 (liquidity sweep below wedge support)
TP3 → 3920 (major 4H demand zone)
Confirmation: Wait for 15m rejection wick or lower-timeframe MSS/CHOCH within that zone.
Bullish Alternative (reversal breakout)
If price closes a 4H candle above 4020 with strength:
Entry: Retest of 4010–4012 as support.
Stop-loss: Below 3995.
Targets:
TP1 → 4040 (previous supply zone).
TP2 → 4080 (liquidity above equal highs).
Summary
Structure compression signals potential breakout soon.
Since momentum is still bearish and price is failing to reclaim 4H EMAs, short from resistance is higher-probability.
Watch reaction to 3980 — if it holds firmly with bullish divergence, the wedge breakout north could begin.

Multiple time Standard Deviation PlaybackGoing over a playback looking at how a Standard Dev indicator works in finding levels of support and resistance. This helps to fins good areas to take profit or where price might just turn around. Good Pivotal points.

GC UpdateDollar index heading upwards is bearish for gold. Also, RSI isn't getting over 50 the last couple of pumps.
Not gonna short it because option premiums are too high unless you have exact timing.

Long trade
📘 Trade Journal Entry — Micro Gold Futures (MGC1!)
Date: 12th Oct 25
Time: 12:00 PM
Session: LDN → NY AM
Direction: Buyside Trade
Timeframe: 1H
🔹 Trade Details
Entry: 3978.8
TP: 4290 (+8.06%)
SL: 3924.9 (–1.31%)
RR: 6.15
📌 Technical Narrative
Price formed a macro liquidity sweep, followed by CHOCH and BOS confirming a bullish reversal. A clean inducement below the 4050 zone fueled displacement upward through multiple FVGs, each of which held as re-entry zones. The trade was taken from a discount retracement aligned with the 0.382 and 0.61 fib levels, supported by stacked FVGs and KAMA MA trend alignment.
🔹Model: FVG → Inducement → BOS → Re-entry
Liquidity swept - Price immediately shifted into displacement
Accumulation & Inducement Zone - Between Oct 28 → Nov 5, price carved:
Slow accumulation structure
Multiple small FVGs (stacked)
A clean inducement low at 4050-zone
Equal lows resting near 4084 PD-array
Displacement Leg (Current Move Up) Price breaks:
BOS @ 4148.7 and holds above: 0.382 retracement @ 4140
0.618 retracement @ 4229.
Multiple micro FVGs (confirmed by fills)
📌Market Sentiment Narrative
Gold currently trades in an environment of: Fed dovish shift, Geopolitical uncertainty
Commodity demand rotational flows, Liquidity flight from risk-on assets. This supports a buyside continuation toward HTF premium zones.

MGC Short Asian SessionShort On MGC
Price action confirmed a short on the 5m TF
Targets session lows

GOLD Near Levels of Interest and Buyer Aggession. Another Rally?Gold is near key levels where buyers aggression has been seen in the past. Another rally brewing in GOLD?
Recently US Govenrment reopening has raised chances of interest rate cuts in December which can boost Gold prices further. All eyes on key US data points coming around 2200-2300 IST
Follow me for more such updates
4398.7This channel is not providing individualized trading or investment advice, nor is it a banking service, brokerage service, trading service, investment service or money management service

Gold Confirmed Bullish BiasFenzoFx—Gold is bullish again, confirmed by engulfing above the $4,175.00 resistance. As of this writing, XAU/USD trades inside the bearish fair value gap, testing the $4,230.00 resistance.
Last day, Gold did not dip below $4,103.00 (the bullish FVG) for liquidity. This indicates a strong bullish market. However, going long at the current price is risky because the price has surged already. The ideal level for joining the bull market would be around $4,146.00, which is in conjunction with daily highs and the October 23 and 24 close. This area should provide decent support for Gold.
In the bullish scenario, we expect Gold to form a double top at all-time highs by targeting $4,398.00.

GOLD (XAU) Outlook - Prediction (12 NOV)GOLD (XAU) Outlook - Prediction
📊 Market Sentiment
Market sentiment for GOLD remains strongly bullish, primarily driven by central bank accumulation. Since 2023, global central banks led by China have been purchasing gold aggressively, creating a durable demand base. With the FED preparing to initiate QE while inflation remains elevated, I think risk assets like GOLD could outperform as the USD (DXY) weakens. This macro setup continues to support a long term bullish narrative.
📈 Technical Analysis
Price has been retracing since October 20, which I think was a healthy correction following a strong expansion. As mentioned in my previous GOLD outlook, price appeared to be retesting the Weekly Value Gap and accumulating within that zone. In my opinion, this accumulation phase seems to have ended, and the market looks ready to continue higher.
📌 Game Plan - Prediction
Price has broken out of the accumulation zone and started expanding upward. I plan to enter after a retest near the key zone around $4060. It may dip toward $4027, which I consider a discount zone. I intend to scale in between $4060 and $3950, with invalidation if the daily candle closes below $3900.
💬 Follow my Substack profile for detailed insights and extended analysis.
⚠️ Disclaimer: For educational purposes only. This is not financial advice.

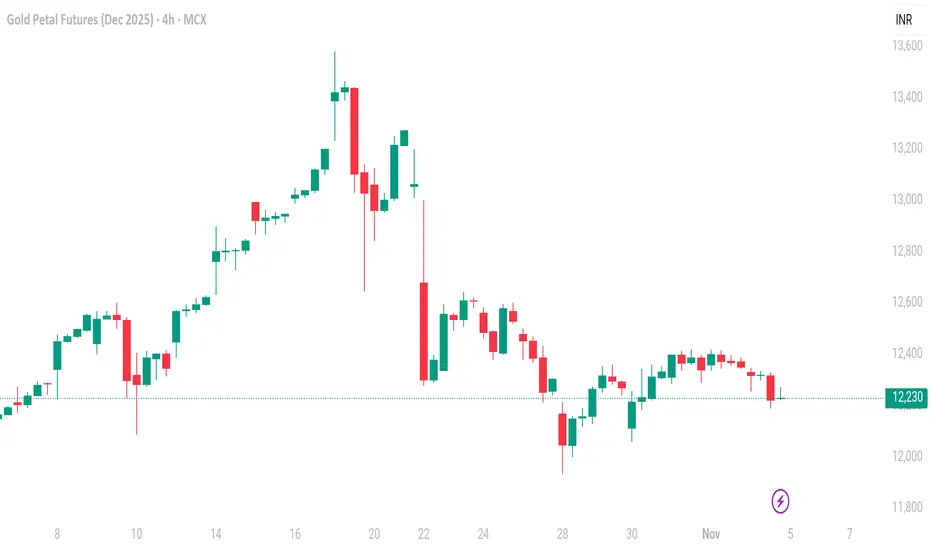
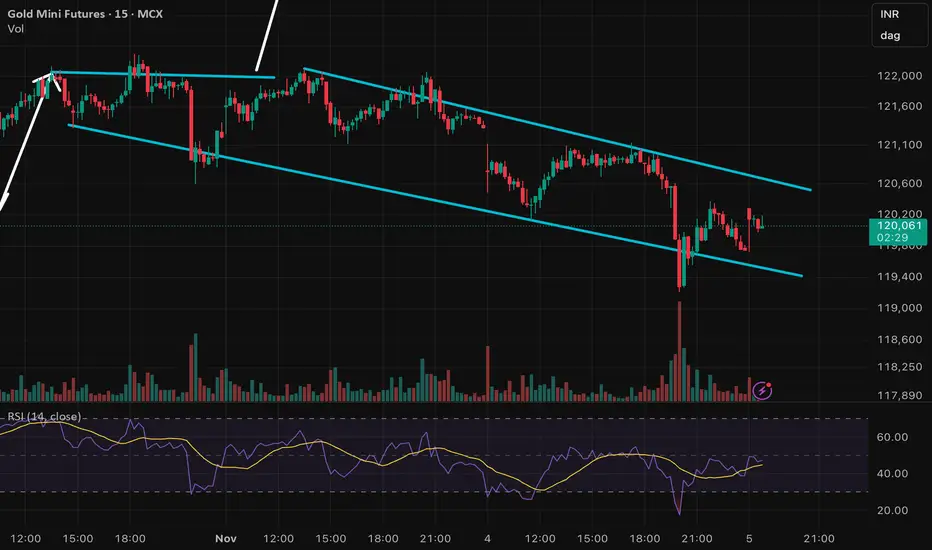
GOLD falling in a parallel channel formation Gold price has been falling since yesterday as expectations of December rate cut fades away. It is forming a parallel falling channel pattern and has recently bounced from the lower zone.
Keep an eye on it as volatility is expected to stay and there will be ample opportunities to capture movements. Follow me for live updates.
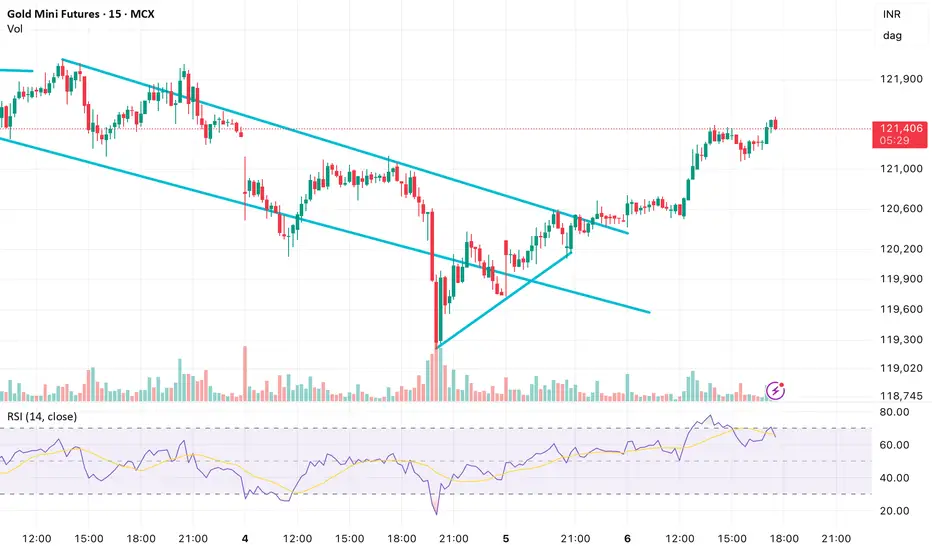
GOLDM showing upside momentum as BoE keeps rate at 4%GOLDM is rallying today before Bank of England interest rate decision where they have kept interest rate at 4% meeting market expectations.
Gold recently gave a breakout from a falling channel pattern formation on 15 min chart
Gold GC - Is the bullish Bias Back?Gold just completed a major pullback. Is Gold going to recover? Will the bullish Bias continue? Price is trending above the EMAs. This signals strong momentum for now. The Gold rush is on?
