AAPL Chart AnalysisHi!
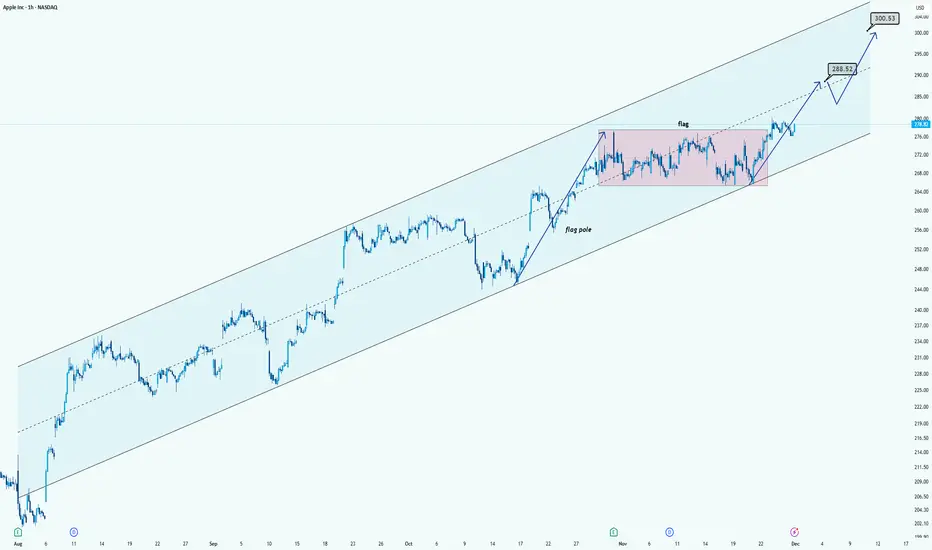
AAPL is trading inside a clean long-term ascending channel, showing a strong uptrend. Recently, the price formed a bullish flag (pink zone) after a sharp move up. The breakout above the flag signals continuation of the trend.
The chart projects two key upside levels:
$288.52 as the first tar
Apple Inc.
No trades
Key facts today
Next report date
—
Report period
—
EPS estimate
—
Revenue estimate
—
6.40 EUR
95.45 B EUR
354.65 B EUR
14.76 B
About Apple Inc
Sector
Industry
CEO
Timothy Donald Cook
Website
Headquarters
Cupertino
Founded
1976
Identifiers
3
ISIN:US0378331005
Apple, Inc. engages in the design, manufacture, and sale of smartphones, personal computers, tablets, wearables and accessories, and other varieties of related services. It operates through the following geographical segments: Americas, Europe, Greater China, Japan, and Rest of Asia Pacific. The Americas segment includes North and South America. The Europe segment consists of European countries, as well as India, the Middle East, and Africa. The Greater China segment comprises China, Hong Kong, and Taiwan. The Rest of Asia Pacific segment includes Australia and Asian countries. Its products and services include iPhone, Mac, iPad, AirPods, Apple TV, Apple Watch, Beats products, AppleCare, iCloud, digital content stores, streaming, and licensing services. The company was founded by Steven Paul Jobs, Ronald Gerald Wayne, and Stephen G. Wozniak in April 1976 and is headquartered in Cupertino, CA.
Related stocks
APPLE Just formed its Cycle Top. Best sell opportunity is here.Almost 3 months ago (September 19, see chart below), we gave a buy signal on Apple Inc. (AAPL), which recently hit our final $290 Target:
This week we go back to the long-term 1W time-frame as the Bullish Leg (green) since the April 07 bottom just hit the top (Higher Highs trend-line) of its 4

AAPL – Dec 10 OutlookKey Levels Tighten as Price Compresses Inside a Falling Wedge
AAPL has been slowly compressing inside a clean falling wedge on both the 1H and 15M charts. Each bounce is getting weaker, but sellers haven’t fully broken the structure yet — they’re defending every lower-high while buyers continue hold

let's buy appleMy analysis is purely technical, supported by multiple factors:
1) We've been within an ascending channel for several months now, specifically since August. This gives us a sense of the market's general trend and allows us to identify potential retracement zones.
2) Subsequently, we can observe a d

Apple - This stock will collapse!🥊Apple ( NASDAQ:AAPL ) is reversing right now:
🔎Analysis summary:
Starting back five years ago, Apple established a major rising channel pattern. Following this channel, Apple recently created a textbook +40% move higher. But with the current retest of resistance, we will certainly see anothe

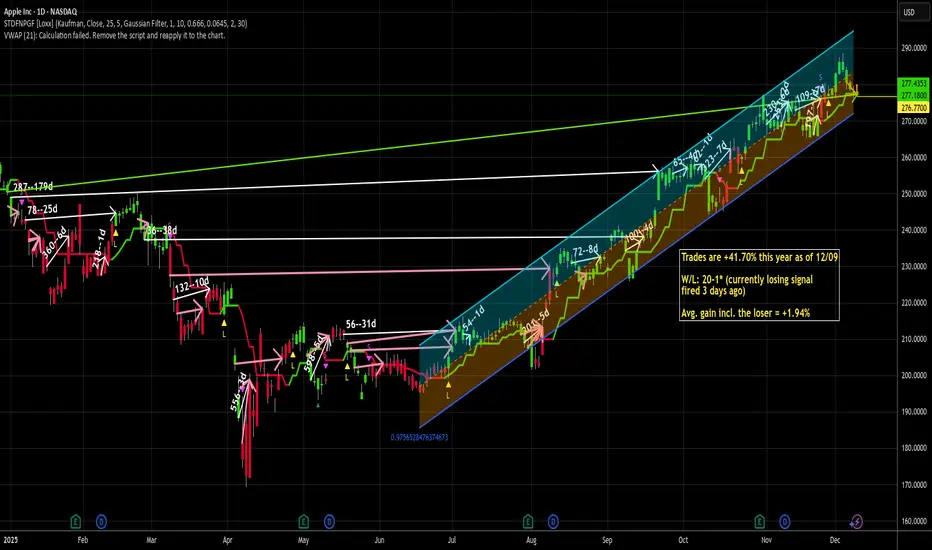
I like AAPL for uncertain times -- long at 276.77First and foremost, I like AAPL here because the system I use likes AAPL here. It actually liked it 3 days ago, but I decided to wait and I'm glad I did because I'm getting a better deal here. I jumped in just before the end of the after hours session today because I couldn't wait any longer. T
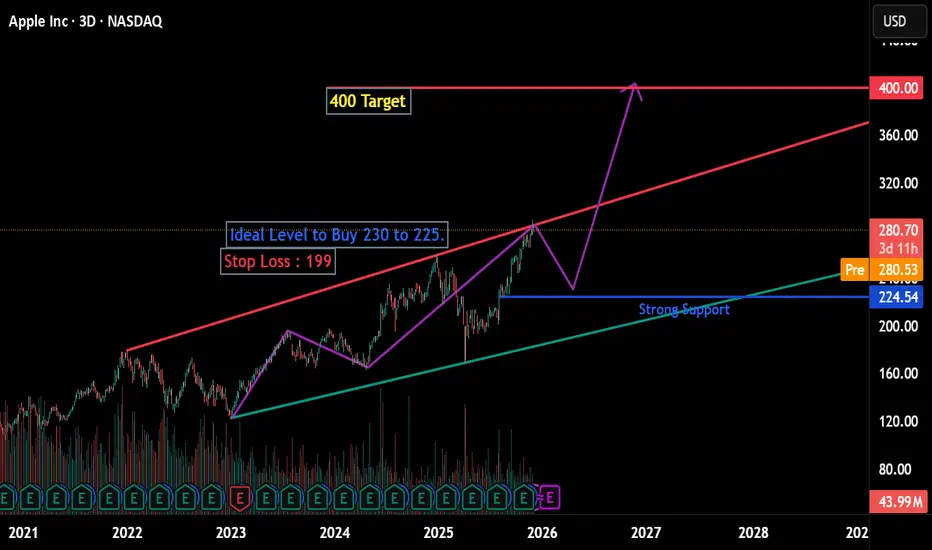
Apple : It is awaiting correctionCurrently it is at head to correction.
according to my chart reading.
ideal buy entry after correction to 225-230 if decline and come to those levels.
Target 400
SL : Below 199.
Manage your Risk .
I don't have anything to see to buy at current price.
And also I am not in favor of Short Sell.
AAPL 1-Month Projection: Low-Volatility Neutral PatternAAPL QuantSignals Katy 1M Prediction 2025-12-08
QuantSignals Katy AI Stock Analysis
Analyzed 1 stock(s): AAPL
AAPL Analysis
Current Price: $276.54
Final Prediction: $276.97 (+0.16%)
30min Target: $277.86 (+0.48%)
Trend: NEUTRAL
Confidence: 49.3%
Volatility: 5.7%
Summary: Generated 0 trade signal

Apple to NVIDIAApple vs. NVIDIA Chart Analysis
Does anyone know something we don’t? This chart compares Apple to NVIDIA.
As you can see, Apple relative to NVIDIA has completed a clear five-wave structure within a descending channel.
Price has now reached the end of wave 5 at the bottom of its 11-year channel, sh

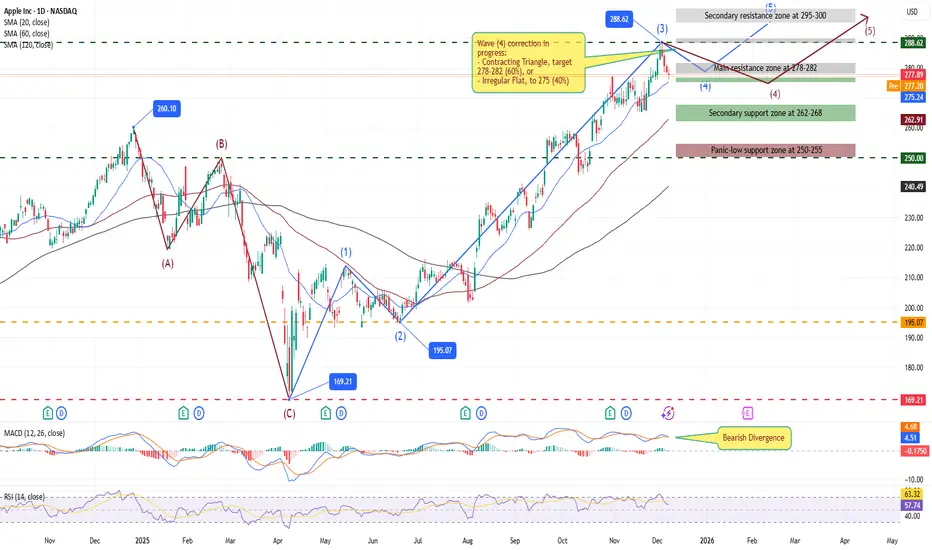
AAPL Elliott Wave Update: Wave 4 Triangle Nears Completion –$300AAPL Elliott Wave Update: Wave 4 Triangle Nears Completion – $300+ Wave 5 Targets Ahead
AAPL continues its bullish trajectory in a classic 5-wave impulse structure, originating from the April 2025 low of $169.21 following an ABC correction from late 2024 highs. This rally has delivered over 70% ga
See all ideas
Summarizing what the indicators are suggesting.
Neutral
SellBuy
Strong sellStrong buy
Strong sellSellNeutralBuyStrong buy
Neutral
SellBuy
Strong sellStrong buy
Strong sellSellNeutralBuyStrong buy
Neutral
SellBuy
Strong sellStrong buy
Strong sellSellNeutralBuyStrong buy
An aggregate view of professional's ratings.
Neutral
SellBuy
Strong sellStrong buy
Strong sellSellNeutralBuyStrong buy
Neutral
SellBuy
Strong sellStrong buy
Strong sellSellNeutralBuyStrong buy
Neutral
SellBuy
Strong sellStrong buy
Strong sellSellNeutralBuyStrong buy
Displays a symbol's price movements over previous years to identify recurring trends.
US37833ER7
Apple Inc. 4.1% 08-AUG-2062Yield to maturity
5.47%
Maturity date
Aug 8, 2062
US37833EG1
Apple Inc. 2.8% 08-FEB-2061Yield to maturity
5.45%
Maturity date
Feb 8, 2061
US37833EK2
Apple Inc. 2.7% 05-AUG-2051Yield to maturity
5.45%
Maturity date
Aug 5, 2051
US37833EL0
Apple Inc. 2.85% 05-AUG-2061Yield to maturity
5.44%
Maturity date
Aug 5, 2061
US37833EQ9
Apple Inc. 3.95% 08-AUG-2052Yield to maturity
5.42%
Maturity date
Aug 8, 2052
US37833DD9
Apple Inc. 3.75% 12-SEP-2047Yield to maturity
5.41%
Maturity date
Sep 12, 2047
US37833CD0
Apple Inc. 3.85% 04-AUG-2046Yield to maturity
5.40%
Maturity date
Aug 4, 2046
US37833EF3
Apple Inc. 2.65% 08-FEB-2051Yield to maturity
5.40%
Maturity date
Feb 8, 2051
US37833DQ0
Apple Inc. 2.95% 11-SEP-2049Yield to maturity
5.40%
Maturity date
Sep 11, 2049
US37833DW7
Apple Inc. 2.65% 11-MAY-2050Yield to maturity
5.39%
Maturity date
May 11, 2050
APC3
Apple Inc. 3.75% 13-NOV-2047Yield to maturity
5.35%
Maturity date
Nov 13, 2047
See all 1AAPL bonds
Curated watchlists where 1AAPL is featured.


Frequently Asked Questions
The current price of 1AAPL is 236.50 EUR — it has increased by 0.45% in the past 24 hours. Watch Apple Inc. stock price performance more closely on the chart.
Depending on the exchange, the stock ticker may vary. For instance, on MIL exchange Apple Inc. stocks are traded under the ticker 1AAPL.
1AAPL stock has fallen by −1.60% compared to the previous week, the month change is a −1.02% fall, over the last year Apple Inc. has showed a 0.55% increase.
We've gathered analysts' opinions on Apple Inc. future price: according to them, 1AAPL price has a max estimate of 300.79 EUR and a min estimate of 184.77 EUR. Watch 1AAPL chart and read a more detailed Apple Inc. stock forecast: see what analysts think of Apple Inc. and suggest that you do with its stocks.
1AAPL reached its all-time high on Dec 27, 2024 with the price of 248.80 EUR, and its all-time low was 29.50 EUR and was reached on Feb 6, 2018. View more price dynamics on 1AAPL chart.
See other stocks reaching their highest and lowest prices.
See other stocks reaching their highest and lowest prices.
1AAPL stock is 0.85% volatile and has beta coefficient of 1.15. Track Apple Inc. stock price on the chart and check out the list of the most volatile stocks — is Apple Inc. there?
Today Apple Inc. has the market capitalization of 3.50 T, it has decreased by −1.12% over the last week.
Yes, you can track Apple Inc. financials in yearly and quarterly reports right on TradingView.
Apple Inc. is going to release the next earnings report on Jan 29, 2026. Keep track of upcoming events with our Earnings Calendar.
1AAPL earnings for the last quarter are 1.58 EUR per share, whereas the estimation was 1.51 EUR resulting in a 4.10% surprise. The estimated earnings for the next quarter are 2.27 EUR per share. See more details about Apple Inc. earnings.
Apple Inc. revenue for the last quarter amounts to 87.32 B EUR, despite the estimated figure of 87.12 B EUR. In the next quarter, revenue is expected to reach 116.93 B EUR.
1AAPL net income for the last quarter is 23.41 B EUR, while the quarter before that showed 19.89 B EUR of net income which accounts for 17.66% change. Track more Apple Inc. financial stats to get the full picture.
Yes, 1AAPL dividends are paid quarterly. The last dividend per share was 0.22 EUR. As of today, Dividend Yield (TTM)% is 0.37%. Tracking Apple Inc. dividends might help you take more informed decisions.
Apple Inc. dividend yield was 0.40% in 2025, and payout ratio reached 13.66%. The year before the numbers were 0.43% and 16.11% correspondingly. See high-dividend stocks and find more opportunities for your portfolio.
As of Dec 12, 2025, the company has 166 K employees. See our rating of the largest employees — is Apple Inc. on this list?
EBITDA measures a company's operating performance, its growth signifies an improvement in the efficiency of a company. Apple Inc. EBITDA is 123.35 B EUR, and current EBITDA margin is 34.78%. See more stats in Apple Inc. financial statements.
Like other stocks, 1AAPL shares are traded on stock exchanges, e.g. Nasdaq, Nyse, Euronext, and the easiest way to buy them is through an online stock broker. To do this, you need to open an account and follow a broker's procedures, then start trading. You can trade Apple Inc. stock right from TradingView charts — choose your broker and connect to your account.
Investing in stocks requires a comprehensive research: you should carefully study all the available data, e.g. company's financials, related news, and its technical analysis. So Apple Inc. technincal analysis shows the buy rating today, and its 1 week rating is buy. Since market conditions are prone to changes, it's worth looking a bit further into the future — according to the 1 month rating Apple Inc. stock shows the buy signal. See more of Apple Inc. technicals for a more comprehensive analysis.
If you're still not sure, try looking for inspiration in our curated watchlists.
If you're still not sure, try looking for inspiration in our curated watchlists.