META QuantSignals V3 | Moderate Risk alretMETA Swing Signal — (2025-11-28)
Instrument: META
Direction: BUY CALLS 📈
Confidence: 60% (Medium)
Horizon / Expiry: 14 days → 2025-12-12
Strike Focus: $650.00
Entry Range: $12.50 – $13.50 (mid $13.00)
Target 1: $19.00 (+50%)
Target 2: $25.00 (+100%)
Stop Loss: $8.50 (-35%)
Position Size: 3% of port
Key facts today
Next report date
—
Report period
—
EPS estimate
—
Revenue estimate
—
19.8 EUR
60.24 B EUR
158.90 B EUR
2.17 B
About Meta Platforms, Inc.
Sector
Industry
CEO
Mark Elliot Zuckerberg
Website
Headquarters
Menlo Park
Founded
2004
ISIN
US30303M1027
FIGI
BBG00J7BKFG3
Meta Platforms, Inc. engages in the development of social media applications. It builds technology that helps people connect and share, find communities, and grow businesses. It operates through the Family of Apps (FoA) and Reality Labs (RL) segments. The FoA segment consists of Facebook, Instagram, Messenger, WhatsApp, and other services. The RL segment includes augmented, mixed and virtual reality related consumer hardware, software, and content. The company was founded by Mark Elliot Zuckerberg, Dustin Moskovitz, Chris R. Hughes, Andrew McCollum, and Eduardo P. Saverin on February 4, 2004, and is headquartered in Menlo Park, CA.
Related stocks
META – Weekly Chart📈 META – Weekly Chart Overview
A technical rebound may be starting to form.
Several signals from The Wave system are aligning:
✅ Price in the buy zone
META has retraced into a historically strong demand area, perfectly overlapping with the Wave buy signal zone.
This region has acted as a springboa

Meta Wave Analysis – 3 December 2025
- Meta reversed from support zone
- Likely to rise to resistance level 700.00
Meta recently reversed up from the support zone between the round support level 600.00 and the support trendline of the daily Down Channel from July.
The upward reversal from this support zone started the active short

META now close to a critical trendlineMETA is approaching a significant technical region.
The trendline currently in focus originated on 31 October 2022, and it has remained relevant over time.
This same trendline was retested twice in April of this year, and price action is once again moving toward it after achieving a new all-time

META — Watching for a Potential GAP Closure.Hello Everyone, Followers,
META is the second one for Today.
After disappointing financial report, It created big GAP between 742 to 680 .
The GAP is still unfilled.
Then META has shown a solid rebound after weeks of heavy selling. The chart is now structured around one key element:
🔍 Chart

META — Setting Up for a Potential 50% Upside?META (Weekly Chart) is showing a strong technical setup after a healthy multi-week correction. Price has bounced exactly from the long-term rising trendline + 100-WMA zone — a region that has historically acted as a strong accumulation area.
🔍 Key Bullish Signals
Bullish candle forming near str

looking good this bouncemaybe if NVDA dips a bit with google, the money rotates to Meta, time will tell

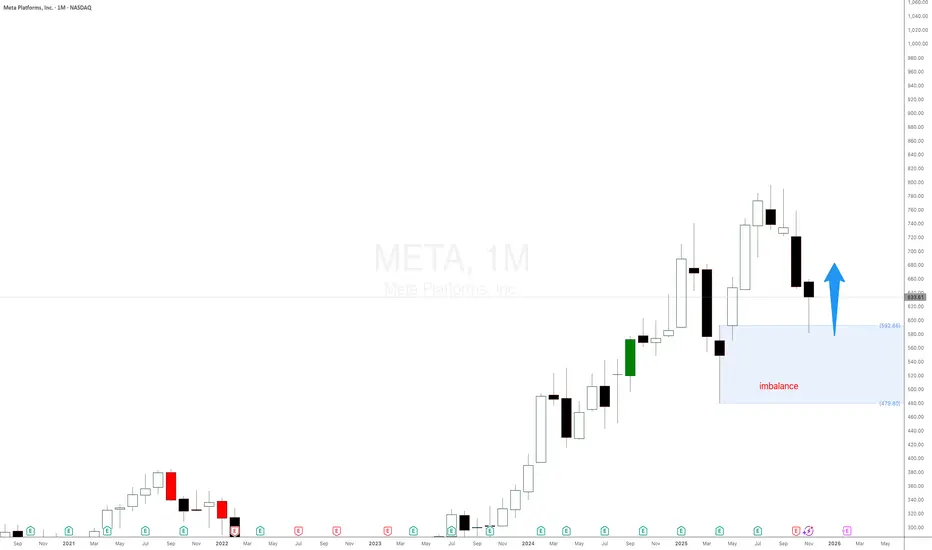
Meta Plafforms stock $META is exploding as expectedMETA Platforms NASDAQ:META is reacting nicely to the monthly demand imbalance at $592 as mentioned in the last update. Using pure supply and demand price action. META’s big drop was predictable from the monthly and weekly imbalances, and how the current reaction was part of the plan all along. Exp
META — WEEK 49 TREND REPORTNASDAQ:META — WEEK 49 TREND REPORT
Ticker: NASDAQ:META — 12/02/2025 @ 647.10$
Timeframe: WEEKLY
This is a reactive structural classification of NASDAQ:META based on the weekly chart as of this timestamp. Price conditions are evaluated as they stand — nothing here is predictive or forwar

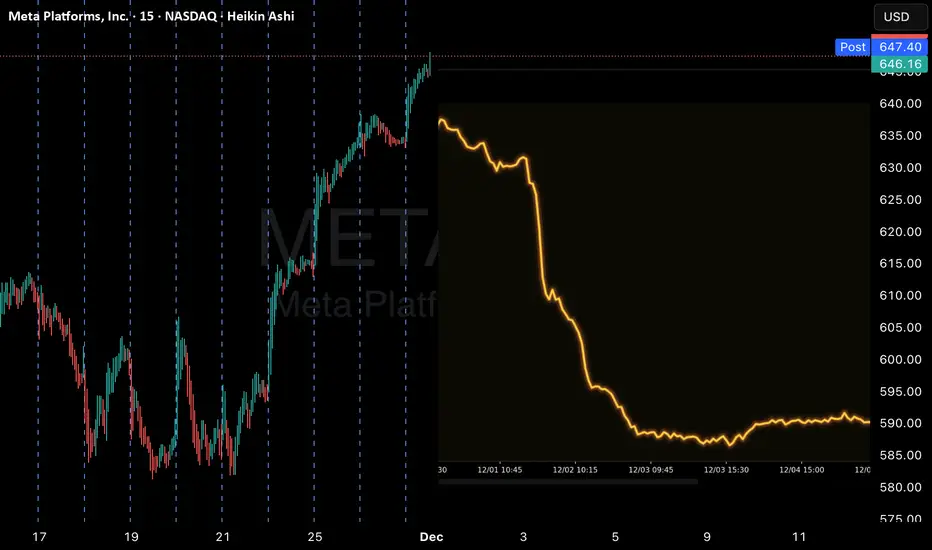
Nasdaq Rallies into Thanksgiving, Meta Bounce Kicks InWall Street sentiment has perked up on renewed Fed cut bets, with the Nasdaq leading the way. This has allowed Facebook to finally rally from support levels I highlighted 3 weeks ago.
Matt Simpson, Market Analyst at City Index.

See all ideas
Summarizing what the indicators are suggesting.
Neutral
SellBuy
Strong sellStrong buy
Strong sellSellNeutralBuyStrong buy
Neutral
SellBuy
Strong sellStrong buy
Strong sellSellNeutralBuyStrong buy
Neutral
SellBuy
Strong sellStrong buy
Strong sellSellNeutralBuyStrong buy
An aggregate view of professional's ratings.
Neutral
SellBuy
Strong sellStrong buy
Strong sellSellNeutralBuyStrong buy
Neutral
SellBuy
Strong sellStrong buy
Strong sellSellNeutralBuyStrong buy
Neutral
SellBuy
Strong sellStrong buy
Strong sellSellNeutralBuyStrong buy
Displays a symbol's price movements over previous years to identify recurring trends.
US30303M8D7
Meta Platforms, Inc. 3.85% 15-AUG-2032Yield to maturity
14.70%
Maturity date
Aug 15, 2032
FB5458295
Meta Platforms, Inc. 4.65% 15-AUG-2062Yield to maturity
5.87%
Maturity date
Aug 15, 2062
FB6221365
Meta Platforms, Inc. 5.75% 15-NOV-2065Yield to maturity
5.82%
Maturity date
Nov 15, 2065
FB5581331
Meta Platforms, Inc. 5.75% 15-MAY-2063Yield to maturity
5.81%
Maturity date
May 15, 2063
FB5868810
Meta Platforms, Inc. 5.55% 15-AUG-2064Yield to maturity
5.81%
Maturity date
Aug 15, 2064
FB5522241
Meta Platforms, Inc. 4.65% 15-AUG-2062Yield to maturity
5.74%
Maturity date
Aug 15, 2062
FB6221364
Meta Platforms, Inc. 5.625% 15-NOV-2055Yield to maturity
5.69%
Maturity date
Nov 15, 2055
FB5581330
Meta Platforms, Inc. 5.6% 15-MAY-2053Yield to maturity
5.68%
Maturity date
May 15, 2053
FB5868809
Meta Platforms, Inc. 5.4% 15-AUG-2054Yield to maturity
5.68%
Maturity date
Aug 15, 2054
FB5522214
Meta Platforms, Inc. 4.45% 15-AUG-2052Yield to maturity
5.64%
Maturity date
Aug 15, 2052
FB6221369
Meta Platforms, Inc. 5.5% 15-NOV-2045Yield to maturity
5.53%
Maturity date
Nov 15, 2045
See all 1FB bonds
Curated watchlists where 1FB is featured.


Frequently Asked Questions
The current price of 1FB is 571.6 EUR — it has increased by 0.11% in the past 24 hours. Watch Meta Platforms Inc Class A stock price performance more closely on the chart.
Depending on the exchange, the stock ticker may vary. For instance, on MIL exchange Meta Platforms Inc Class A stocks are traded under the ticker 1FB.
1FB stock has risen by 0.36% compared to the previous week, the month change is a 1.15% rise, over the last year Meta Platforms Inc Class A has showed a −2.21% decrease.
We've gathered analysts' opinions on Meta Platforms Inc Class A future price: according to them, 1FB price has a max estimate of 961.04 EUR and a min estimate of 524.83 EUR. Watch 1FB chart and read a more detailed Meta Platforms Inc Class A stock forecast: see what analysts think of Meta Platforms Inc Class A and suggest that you do with its stocks.
1FB stock is 7.58% volatile and has beta coefficient of 1.45. Track Meta Platforms Inc Class A stock price on the chart and check out the list of the most volatile stocks — is Meta Platforms Inc Class A there?
Today Meta Platforms Inc Class A has the market capitalization of 1.38 T, it has increased by 4.97% over the last week.
Yes, you can track Meta Platforms Inc Class A financials in yearly and quarterly reports right on TradingView.
Meta Platforms Inc Class A is going to release the next earnings report on Feb 4, 2026. Keep track of upcoming events with our Earnings Calendar.
1FB earnings for the last quarter are 0.89 EUR per share, whereas the estimation was 5.73 EUR resulting in a −84.38% surprise. The estimated earnings for the next quarter are 7.02 EUR per share. See more details about Meta Platforms Inc Class A earnings.
Meta Platforms Inc Class A revenue for the last quarter amounts to 43.67 B EUR, despite the estimated figure of 42.19 B EUR. In the next quarter, revenue is expected to reach 49.98 B EUR.
1FB net income for the last quarter is 2.31 B EUR, while the quarter before that showed 15.57 B EUR of net income which accounts for −85.17% change. Track more Meta Platforms Inc Class A financial stats to get the full picture.
Yes, 1FB dividends are paid quarterly. The last dividend per share was 0.44 EUR. As of today, Dividend Yield (TTM)% is 0.32%. Tracking Meta Platforms Inc Class A dividends might help you take more informed decisions.
Meta Platforms Inc Class A dividend yield was 0.34% in 2024, and payout ratio reached 8.38%. The year before the numbers were 0.00% and 0.00% correspondingly. See high-dividend stocks and find more opportunities for your portfolio.
As of Dec 4, 2025, the company has 74.07 K employees. See our rating of the largest employees — is Meta Platforms Inc Class A on this list?
EBITDA measures a company's operating performance, its growth signifies an improvement in the efficiency of a company. Meta Platforms Inc Class A EBITDA is 84.93 B EUR, and current EBITDA margin is 51.83%. See more stats in Meta Platforms Inc Class A financial statements.
Like other stocks, 1FB shares are traded on stock exchanges, e.g. Nasdaq, Nyse, Euronext, and the easiest way to buy them is through an online stock broker. To do this, you need to open an account and follow a broker's procedures, then start trading. You can trade Meta Platforms Inc Class A stock right from TradingView charts — choose your broker and connect to your account.
Investing in stocks requires a comprehensive research: you should carefully study all the available data, e.g. company's financials, related news, and its technical analysis. So Meta Platforms Inc Class A technincal analysis shows the buy rating today, and its 1 week rating is neutral. Since market conditions are prone to changes, it's worth looking a bit further into the future — according to the 1 month rating Meta Platforms Inc Class A stock shows the buy signal. See more of Meta Platforms Inc Class A technicals for a more comprehensive analysis.
If you're still not sure, try looking for inspiration in our curated watchlists.
If you're still not sure, try looking for inspiration in our curated watchlists.