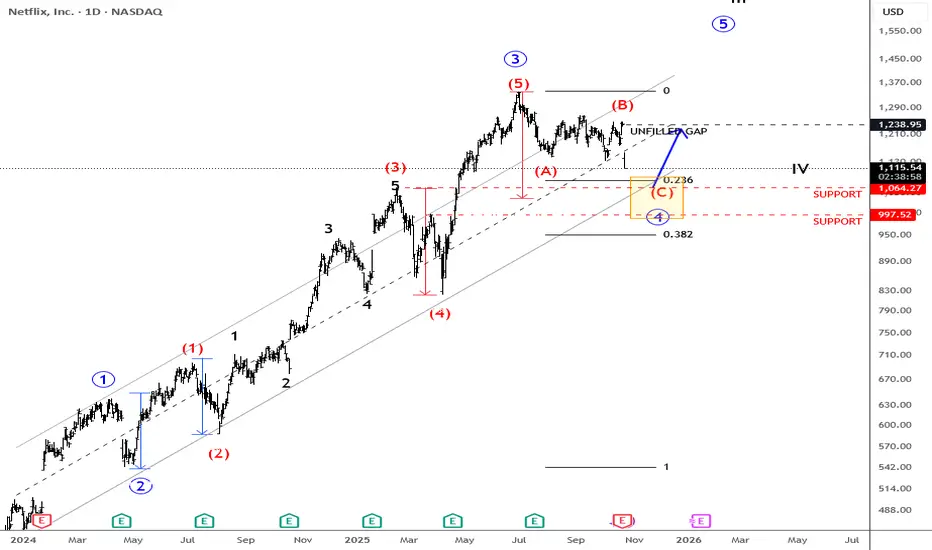
Netflix (NFLX) - Elliott Wave Map to $25K📘 Netflix (NFLX) – The Final Act of Supercycle Wave III, Setting the Stage for Wave V to $25,000+
Symbol: NASDAQ:NFLX
Timeframe: Monthly
Published: October 2025
Current Price: ~$1,120
Framework: Elliott Wave | Fibonacci Extensions | Price Action | Smart Money Concepts (SMC) | Fundamenta
Key facts today
Next report date
—
Report period
—
EPS estimate
—
Revenue estimate
—
20.9 EUR
8.42 B EUR
37.55 B EUR
421.10 M
About Netflix, Inc.
Sector
Industry
Website
Headquarters
Los Gatos
Founded
1997
ISIN
US64110L1061
FIGI
BBG00J7BK316
Netflix, Inc. engages in providing entertainment services. It also offers activities for leisure time, entertainment video, video gaming, and other sources of entertainment. It operates through the United States and International geographic segments. The company was founded by Marc Randolph and Wilmot Reed Hastings on August 29, 1997 and is headquartered in Los Gatos, CA.
Related stocks

Netflix Down After Earning, But Its Hunting SupportNetflix is coming down after earnings and is currently trading more than 10% lower. Whenever we see such a sharp reversal, it’s important to zoom out and look at the broader trend. From the 2023 lows, there is still a very strong and impulsive recovery, so this could be just a temporary deeper corre
Netflix (NFLX) Shares See a Sharp DeclineNetflix (NFLX) Shares See a Sharp Decline
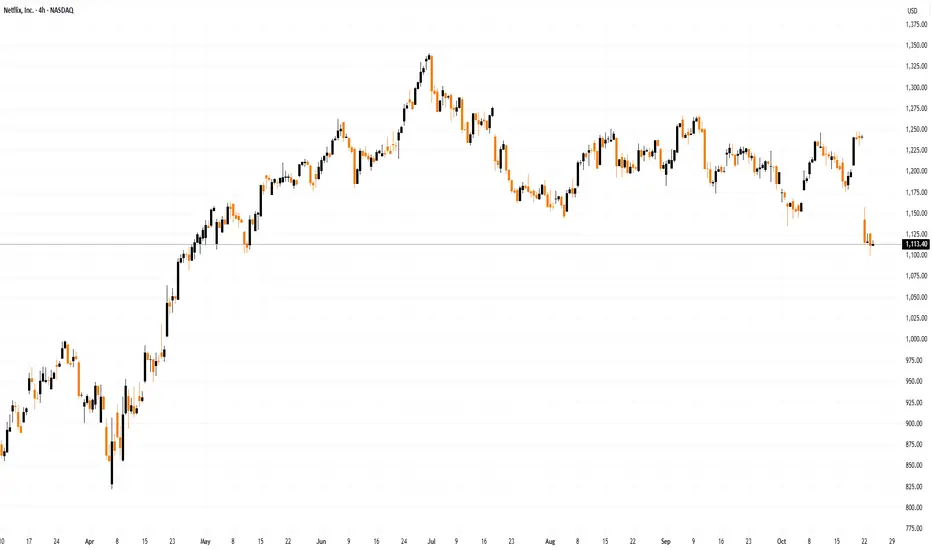
According to recent charts, Netflix (NFLX) shares have traded below $1,100 this week — for the first time since late May. The stock has fallen more than 17% from its July peak, while the S&P 500 index remains close to record highs.
Why Has Netflix (NFLX)
Netflix: A Correction Within a Strong UptrendNetflix: A Correction Within a Strong Uptrend
NASDAQ:NFLX has gone through a lot over the past few years, from huge growth to deep corrections, and lately we’ve seen a (healthy?) 20% pullback that brought the price right to the lower boundary of its long-term ascending channel.
At first glanc

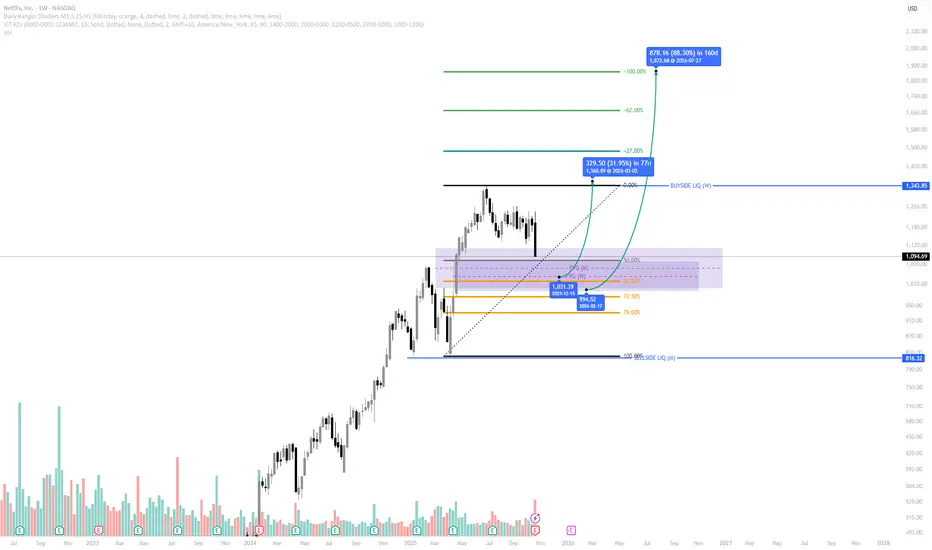
Netflix: Key Support Zone in sightNetflix shares have continued to decline since our last update. We have now provided additional detail on the ongoing turquoise wave 4, which is subdivided into a magenta three-part structure. Within this structure, wave is expected to push price further down into the turquoise Target Zone, betwee

Netflix Earnings Market OverreactionAt this point we all know that Netflix is a common part of an average American's life. However, we came to terms with reality that the global field has a larger effect on the NASDAQ:NFLX than we might think. As we saw in the Q3 '25 earnings report, Brazil levied a one time tax bill on Netflix that

Netflix (NFLX) | FVG + OTE Entry Loading | Multi-Confluence ICT Netflix (NASDAQ: NFLX) is currently retracing into a high-probability multi-timeframe setup, aligning several ICT confluences that suggest a potential re-entry opportunity within a bullish continuation narrative.
Market Structure:
Price remains bullish overall, with clear higher highs (HH) and high
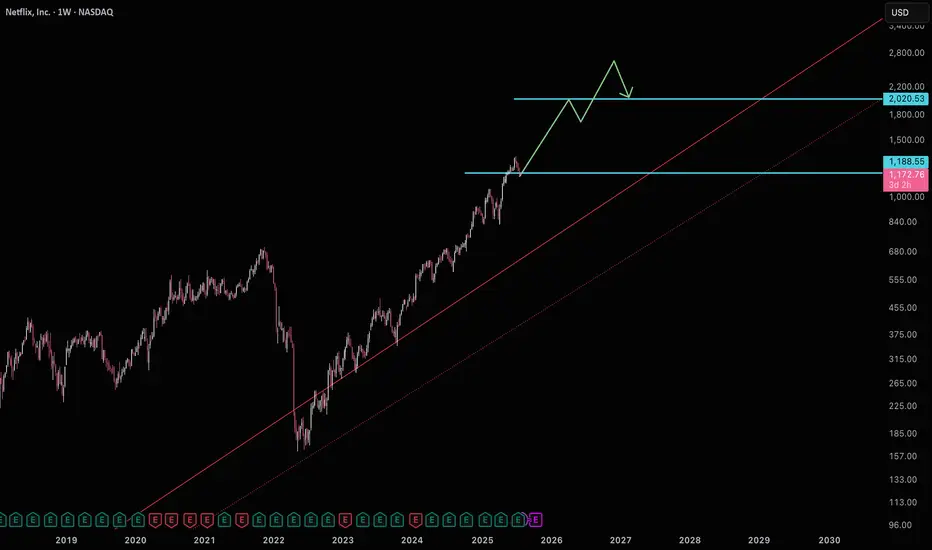
Netflix building support for $2000Netflix is currently sitting on support getting ready for a move to $2000.
Good luck!
Netflix Buying OpportunityNetflix shares have dropped sharply — losing around 10% of their value in just one day, wiping billions from its market cap. The decline followed disappointing earnings results and a one-off $619 million tax charge in Brazil, overshadowing strong revenue growth.
On the chart, price has tapped into

NFLX Earnings Today - Levels to WatchNetflix (NFLX) releases its Q3 earnings today, and sentiment is leaning bullish.
Analysts expect revenue around $11.5 billion (+17% YoY) and EPS near $6.96, supported by optimism around its ad-tier and paid-sharing model.
🌿 This signals growth.
For Q2 2025, Netflix posted revenue of about $11
See all ideas
Summarizing what the indicators are suggesting.
Neutral
SellBuy
Strong sellStrong buy
Strong sellSellNeutralBuyStrong buy
Neutral
SellBuy
Strong sellStrong buy
Strong sellSellNeutralBuyStrong buy
Neutral
SellBuy
Strong sellStrong buy
Strong sellSellNeutralBuyStrong buy
An aggregate view of professional's ratings.
Neutral
SellBuy
Strong sellStrong buy
Strong sellSellNeutralBuyStrong buy
Neutral
SellBuy
Strong sellStrong buy
Strong sellSellNeutralBuyStrong buy
Neutral
SellBuy
Strong sellStrong buy
Strong sellSellNeutralBuyStrong buy
Displays a symbol's price movements over previous years to identify recurring trends.
NFLX5862368
Netflix, Inc. 5.4% 15-AUG-2054Yield to maturity
5.25%
Maturity date
Aug 15, 2054
NFLX5862367
Netflix, Inc. 4.9% 15-AUG-2034Yield to maturity
4.34%
Maturity date
Aug 15, 2034
NFLX4901374
Netflix, Inc. 4.875% 15-JUN-2030Yield to maturity
4.13%
Maturity date
Jun 15, 2030
USU74079AN1
Netflix, Inc. 5.375% 15-NOV-2029Yield to maturity
4.06%
Maturity date
Nov 15, 2029
NFLX4908613
Netflix, Inc. 6.375% 15-MAY-2029Yield to maturity
3.98%
Maturity date
May 15, 2029
NFLX4826528
Netflix, Inc. 5.875% 15-NOV-2028Yield to maturity
3.92%
Maturity date
Nov 15, 2028
NFLX4764899
Netflix, Inc. 4.875% 15-APR-2028Yield to maturity
3.85%
Maturity date
Apr 15, 2028
US64110LAN64
Netflix, Inc. 4.375% 15-NOV-2026Yield to maturity
3.80%
Maturity date
Nov 15, 2026
XS198938050
Netflix, Inc. 3.875% 15-NOV-2029Yield to maturity
3.34%
Maturity date
Nov 15, 2029
XS207282979
Netflix, Inc. 3.625% 15-JUN-2030Yield to maturity
2.79%
Maturity date
Jun 15, 2030
XS198938017
Netflix, Inc. 3.875% 15-NOV-2029Yield to maturity
2.71%
Maturity date
Nov 15, 2029
See all 1NFLX bonds
Curated watchlists where 1NFLX is featured.


Frequently Asked Questions
The current price of 1NFLX is 945.1 EUR — it has increased by 0.12% in the past 24 hours. Watch Netflix, Inc. stock price performance more closely on the chart.
Depending on the exchange, the stock ticker may vary. For instance, on MIL exchange Netflix, Inc. stocks are traded under the ticker 1NFLX.
1NFLX stock has fallen by −11.46% compared to the previous week, the month change is a −8.47% fall, over the last year Netflix, Inc. has showed a 35.01% increase.
We've gathered analysts' opinions on Netflix, Inc. future price: according to them, 1NFLX price has a max estimate of 1,374.00 EUR and a min estimate of 815.81 EUR. Watch 1NFLX chart and read a more detailed Netflix, Inc. stock forecast: see what analysts think of Netflix, Inc. and suggest that you do with its stocks.
1NFLX reached its all-time high on Jun 30, 2025 with the price of 1,140.2 EUR, and its all-time low was 155.8 EUR and was reached on May 12, 2022. View more price dynamics on 1NFLX chart.
See other stocks reaching their highest and lowest prices.
See other stocks reaching their highest and lowest prices.
1NFLX stock is 1.96% volatile and has beta coefficient of 1.05. Track Netflix, Inc. stock price on the chart and check out the list of the most volatile stocks — is Netflix, Inc. there?
Today Netflix, Inc. has the market capitalization of 398.29 B, it has increased by 3.51% over the last week.
Yes, you can track Netflix, Inc. financials in yearly and quarterly reports right on TradingView.
Netflix, Inc. is going to release the next earnings report on Jan 15, 2026. Keep track of upcoming events with our Earnings Calendar.
1NFLX earnings for the last quarter are 5.00 EUR per share, whereas the estimation was 5.93 EUR resulting in a −15.68% surprise. The estimated earnings for the next quarter are 4.73 EUR per share. See more details about Netflix, Inc. earnings.
Netflix, Inc. revenue for the last quarter amounts to 9.81 B EUR, despite the estimated figure of 9.81 B EUR. In the next quarter, revenue is expected to reach 10.28 B EUR.
1NFLX net income for the last quarter is 2.17 B EUR, while the quarter before that showed 2.65 B EUR of net income which accounts for −18.19% change. Track more Netflix, Inc. financial stats to get the full picture.
No, 1NFLX doesn't pay any dividends to its shareholders. But don't worry, we've prepared a list of high-dividend stocks for you.
As of Oct 28, 2025, the company has 14 K employees. See our rating of the largest employees — is Netflix, Inc. on this list?
EBITDA measures a company's operating performance, its growth signifies an improvement in the efficiency of a company. Netflix, Inc. EBITDA is 24.49 B EUR, and current EBITDA margin is 66.68%. See more stats in Netflix, Inc. financial statements.
Like other stocks, 1NFLX shares are traded on stock exchanges, e.g. Nasdaq, Nyse, Euronext, and the easiest way to buy them is through an online stock broker. To do this, you need to open an account and follow a broker's procedures, then start trading. You can trade Netflix, Inc. stock right from TradingView charts — choose your broker and connect to your account.
Investing in stocks requires a comprehensive research: you should carefully study all the available data, e.g. company's financials, related news, and its technical analysis. So Netflix, Inc. technincal analysis shows the sell today, and its 1 week rating is neutral. Since market conditions are prone to changes, it's worth looking a bit further into the future — according to the 1 month rating Netflix, Inc. stock shows the buy signal. See more of Netflix, Inc. technicals for a more comprehensive analysis.
If you're still not sure, try looking for inspiration in our curated watchlists.
If you're still not sure, try looking for inspiration in our curated watchlists.