Trade ideas

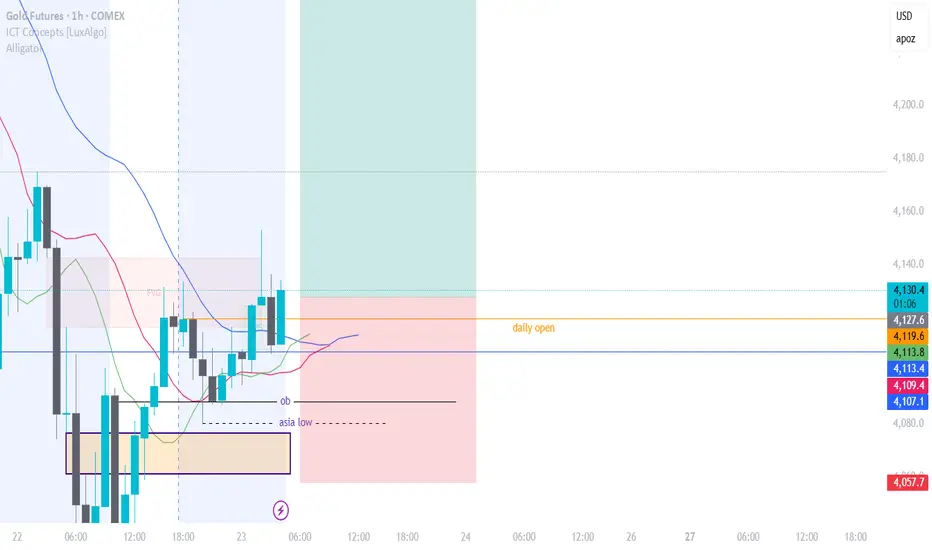
GOLD LONG 1hr setup
### 🧠 **Market Context & Liquidity**
- Gold took out some sellside liquidty
- We’re watching for whether buyers hold above the daily open or if we see a pullback into support.
- Key levels to watch:
- **Resistance:** 4,128 – 4,130 (recent high)
- **Support:** 4,107 – 4,112 (consolidation low & potential buy zone)
---
### 🐊 **Bill Williams Alligator Signal**
- The **Alligator** is awake and aligned — jaws above teeth above lips — indicating a **trending market**.
- Price is trading **above the Alligator**, supporting a **bullish bias**.
- Pullbacks into the Alligator (lips/teeth) are potential entries if structure holds.
---
### 🎯 **Gold (GC1!) Trade Plan – Long Setup**
- **Entry Zone:** 4,110 – 4,128 (support + Alligator confluence)
- **Stop Loss:** Below 4,057
- **TP1:** 4,128
- **TP2:** 4,200 4hr fvg (sibi)
---
### ✅ **Confirmation Needed:**
- Bullish reaction off support with volume.
- No loss of 4,107 level.
- Alligator continues pointing upward.
---
**Bottom Line:**
Gold is in a bullish structure above the Alligator.
Look for longs into support with a tight stop.
Trade the pullback — not the breakout.
GOLD (XAU/USD) Game Plan GOLD (XAU/USD) Game Plan
📊 Market Sentiment
Market sentiment for GOLD remains extremely bullish, driven primarily by central bank accumulation.
Since 2023, global central banks — led by China — have been buying gold aggressively, creating a long-term demand base.
With the FED preparing to initiate QE while inflation remains elevated, risk assets like GOLD are expected to outperform as USD (DXY) weakens.
This macro setup builds a powerful bullish narrative that continues to favor long exposure on gold.
📈 Technical Analysis
GOLD has rallied for nine consecutive weeks since mid-August, reaching overbought RSI levels.
Currently, price is showing signs of retracement and consolidation, suggesting an accumulation phase may form before the next impulsive move.
The Weekly Fair Value Gap (FVG) around $4010, just below the HTF bullish trendline, acts as a critical support area where a potential deviation and bounce may occur.
📌 Game Plan
I expect GOLD to retrace toward the HTF trendline and Weekly FVG ($4017).
A deviation and bounce from this zone could trigger a new bullish leg.
However, I anticipate 1–2 weeks of accumulation before continuation.
💬 Like, follow, and comment if this breakdown supports your trading! More setups and market insights coming soon — stay connected!
⚠️ Disclaimer: This content is for informational and educational purposes only and does not constitute financial, investment, or trading advice. Always DYOR before making any financial decisions.

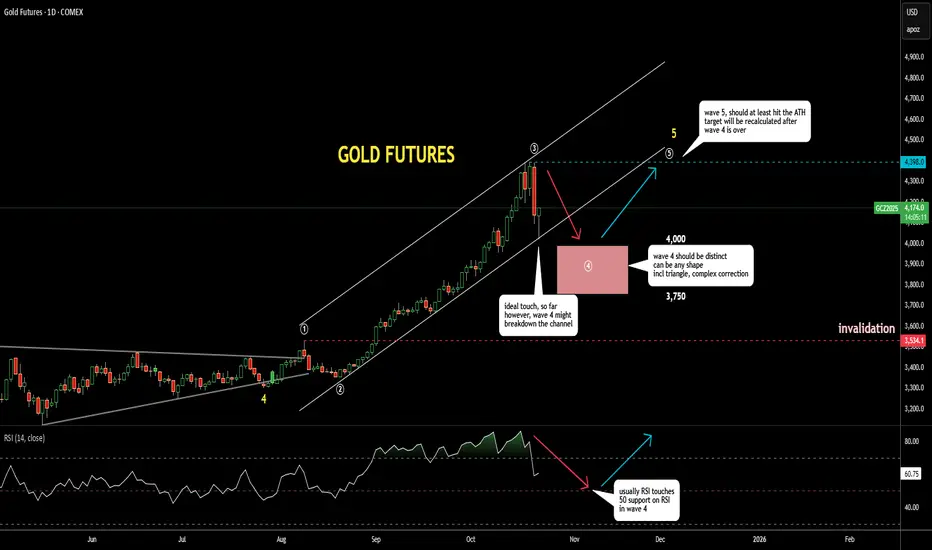
Gold Update 22OCT2025: Wave 4 Correction is in Progress Sooner or later, both overbought conditions and bearish divergence tend to play out — and we’re seeing that now.
Gold just experienced a massive and surprising sell-off, with many stop-losses triggered.
The price dropped $300 in a single day, compared to its usual $50 range.
This likely marks the start of wave 4, as expected. Price briefly touched the bottom of the uptrend channel and bounced off quickly.
However, wave 4 is rarely straightforward.
It can take many corrective forms, such as a triangle or sideways consolidation.
It also tends to be larger than wave 2 and should become clearly visible on the chart.
The target range for wave 4 remains $3,750–$4,000. While $4,000 has already been touched, the corrective structure isn’t fully formed yet.
We should wait for wave 4 to fully develop before setting any expectations for wave 5.
Understanding the Foundation of Global MarketsFutures contracts are everywhere, from crude oil and stock indices to interest rates and even Bitcoin. They’re essential tools for traders and institutions to manage risk or capitalize on price speculation.
What Are Futures?
A futures contract is a legally binding agreement to buy or sell an asset at a set price on a future date. These contracts can involve commodities, currencies, or financial instruments.
Why Trade Futures?
Futures serve two core purposes
Hedging: Used by businesses to protect against adverse price moves. Example: A Corn farmer locks in $4.00 per bushel using a short futures position. If the price drops, they’re protected by gains in the contract. Conversely, if the price rises, the farmer should theoretically be able to sell the physical product at a higher amount.
Speculation: Speculators are a very important piece to market stability and liquidity. Many traders use futures to attempt to profit from market direction, in other words speculate on market moves. For instance, if a trader buys an E-mini S&P 500 contract at 6500 and it rises to 6550, they profit*. But losses can occur just as quickly if the market moves against the position.
*Always account for fees and commissions when evaluating performance."
Types of Futures Contracts
Commodity Futures — Crude oil, soybeans, gold.
Financial Futures — S&P 500, interest rates, Treasury bonds.
Currency Futures — Euro, Yen, and other FX contracts.
Cryptocurrency Products — Bitcoin, Etherum, Solana.
Key Takeaway
Whether you’re hedging or speculating, futures are dynamic and powerful tools. But they also carry significant risk. The first step is understanding what you're trading and why.
At EdgeClear, we’re here to help you trade with confidence. If you’re new or want to enhance your strategy, follow us on TradingView to learn more about Futures and read our latest Trade Ideas.
CME_MINI:ES1! CME_MINI:NQ1! COMEX:GC1! NYMEX:CL1! CME:BTC1!

Very short term bearish -Long term BullPossible support for buy and time frame - not trading or investing advise.

Gold Above 4300 – Watching for FVG Fill Before Next LegPrice consolidated all of yesterday’s Asian and London sessions before breaking bullish through NY, clearing the 4300 resistance.
Today, we’re holding above that breakout level and sitting just beneath the weekly high at 4398.
A 4H FVG rests below price around 4345–4360 — that’s my first area of interest for a retrace and possible continuation higher.
If price dips to fill that gap and shows strength, I’ll look for a long toward 4398–4420.
Otherwise, I’ll wait for a clear reclaim above the weekly high before confirming continuation.
Staying patient tonight — the easy part is waiting for the market to tell me what it wants to do.
#FuturesTrading #Gold #ICT #PriceAction #NOFOMO

GC gold updateVIX died overnight, gold did not tank.
I'm expecting gold to just go sideways for a couple of months unless there's a significant news event.

Gold bounce back into value (4217)Starting to come off the bottom of this manipulation phase into what could be the start of distribution. Next week, I think 4217 is very possible.

Gold Volatility Surges Above $4000Gold's selloff on Tuesday was its fifth most bearish day's trade since 1970 - according to spot prices from LSEG. Clearly this is a significant event, especially when we consider it occurred at its record high. Let's take a closer look at technical levels.
Matt Simpson, Market Analyst at City Index and Forex.com.

A good look at some markets that traded very well yesterdayThis is Tuesday morning and I gave a review of a number of markets and I have to apologize for the video that I did for Monday because I picked the worst market... Silver which was contracted and there were all these other possibilities that were set up to go but I picked silver. But this video showed a lot better choice if I'd been more careful and so hopefully this will make up for the previous video. Warren Buffett is giving me indigestion because he is very bearish on gold..... I mean very bearish. Me gold may have a 2 bar reversal that that signifies that the market's going to correct lower since it completed a very profitable ABCd pattern but that's different than saying you're going to lose your wealth if you're an old participant in the markets... Which is what I am so I'm a little concerned because the worst thing I could put my assets in is the American dollar as best I can tell so if I liquidate positions of gold I'm right back where I didn't want to be and that's with the dollar and from what I understand the dollar is Ravishly losing its ability to maintain its purchase power. He does mention that there is a a position you can take where the government guarantees a certain price and it's I don't think it'a bond and it's not the money that you put into your bank account but to me I don't see that as a solution.

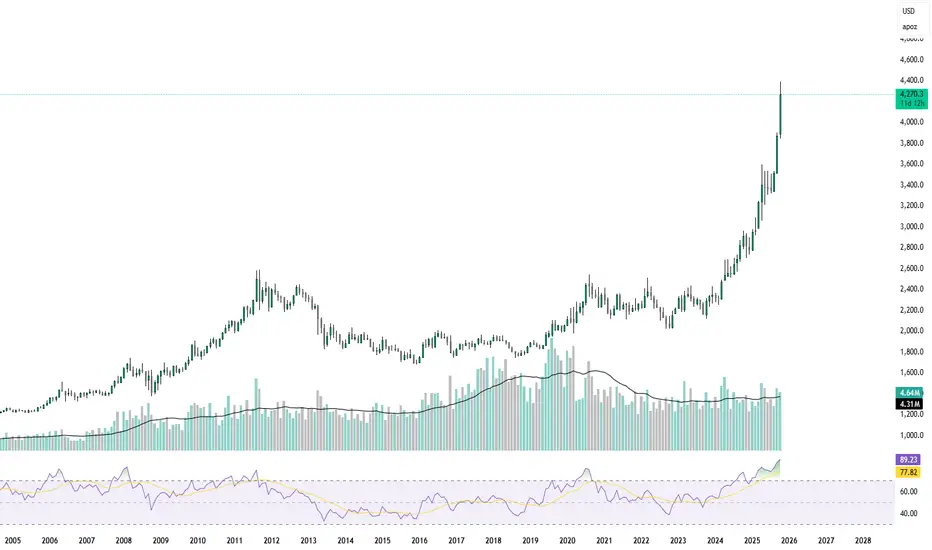
Gold Outlook – A Historical Signal of an Impending DeclineSince 1970, gold (GC – CME) has experienced six major crashes, each occurring right after eight consecutive green weekly closes.
In every case, the market first showed what seemed like a “healthy buying phase” — strong optimism and aggressive inflows — before a sharp reversal took place.
Historical data reveals a clear pattern:
In the first week after the streak, gold fell an average of 11.8%.
By week four, the average drawdown deepened to 23.5%.
And within eight weeks, the total average decline reached up to 33%.
This pattern suggests that gold tends to build extreme bullish momentum before major corrections, as traders chase prices higher and sentiment detaches from fundamentals.
Currently, after another extended streak of weekly gains, gold once again sits in the same statistical zone that historically preceded a significant pullback.
If history repeats itself, we may soon witness a sharp correction — a natural reset after an overheated rally.
Gold’s Pullback: The Dip Everyone’s Afraid to Buy🏆 Gold’s Pullback: The Dip Everyone’s Afraid to Buy 🏆
Gold just gave us the pullback we’ve been waiting for. After an incredible vertical run to $4,400, price has tapped right back into long-term trend support — exactly where past rallies have launched from.
Zoom out on the weekly channel and it’s clear:
Momentum spikes look scary, but historically they’ve reset just before the next leg up.
Volume confirms conviction — this isn’t a fade; it’s a reload.
On the 4H chart, buyers are already defending the trendline like clockwork.
On the 15M, we’re seeing the first signs of stabilization.
💡 My take:
This isn’t the time to panic — it’s the time to position.
“Buy fear, sell greed” wasn’t written for stocks; it was written for gold.
🎯 Watch zone: $4,000–$4,050 — that’s my reload range.
Next resistance: $4,400 → $4,800 if the structure holds.
📈 I’m buying the dip. Are you brave enough to?
#Gold #GC1 #Comex #Futures #BuyTheDip #Macro #Commodities #TrendFollowing #TechnicalAnalysis
Gold to push back up to 4270 Gold is now targeting the highs as liquidity sits there waiting for the taking. Price just broke structure to the upside on m5-H4! Momentum is for sure expected as FVG acts as a stronger attraction towards the liquidity sitting above it.
Weekly Outlook — Gold Futures (MGCZ2025)Price is sitting between key levels after last week’s explosive move.
I’m watching 4,300 as immediate resistance — if bulls can’t hold above this level, I expect a sweep toward 4,200–4,150 (H4 + Daily FVGs) before continuation.
Monday might just be a setup day, building liquidity for a Tuesday/Wednesday move.
Key Levels:
🟦 4,392 – Previous Weekly High
🟨 4,300 – Near-term resistance
🟧 4,200 – Daily Low / Support zone
🟩 4,150 – H4 FVG top
Let’s see how Monday sets the tone for the week.
#Gold #Futures #TradingPlan #ICT #PriceAction

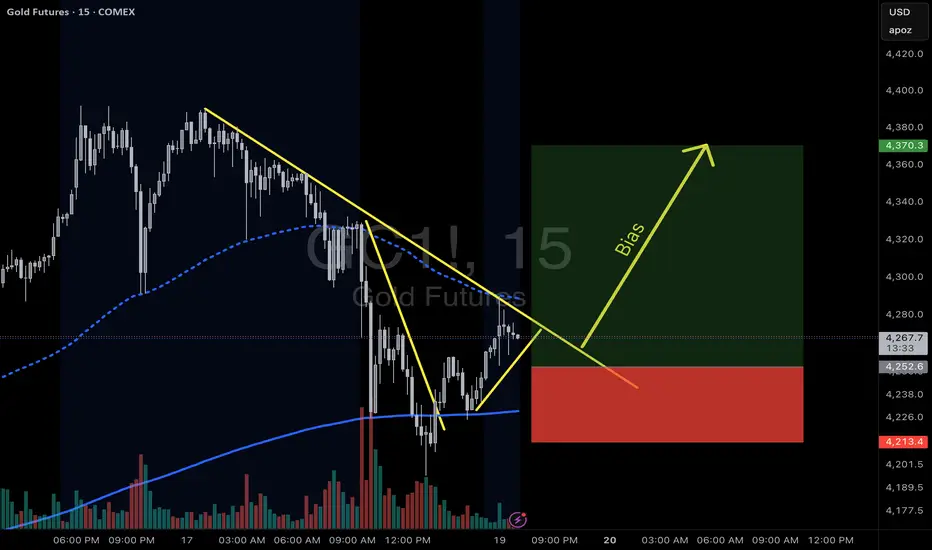
Gold Futures GC - 1:3 opportunity setting up?Based on the market bias Gold may be setting up a 1:3 Risk:Reward? What are your thoughts? Will news impact the balanced flow of Gold?
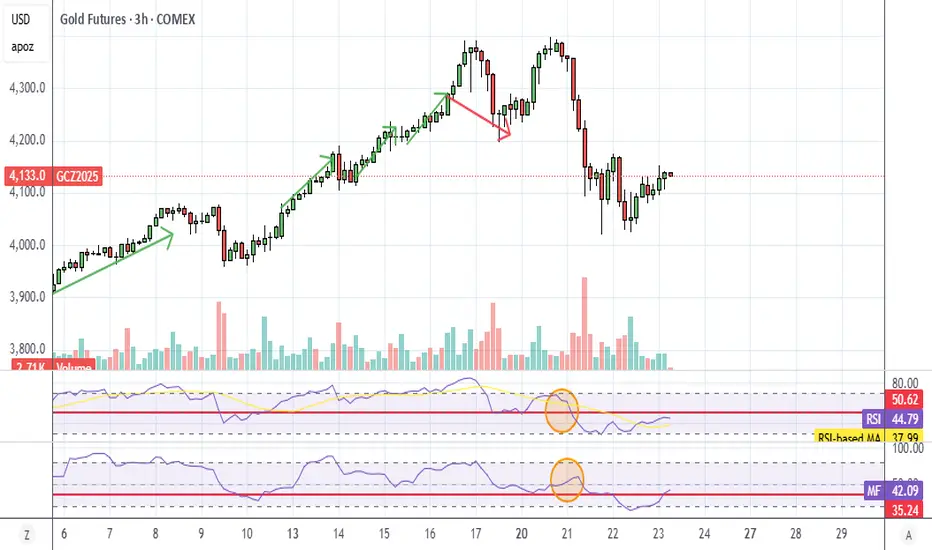
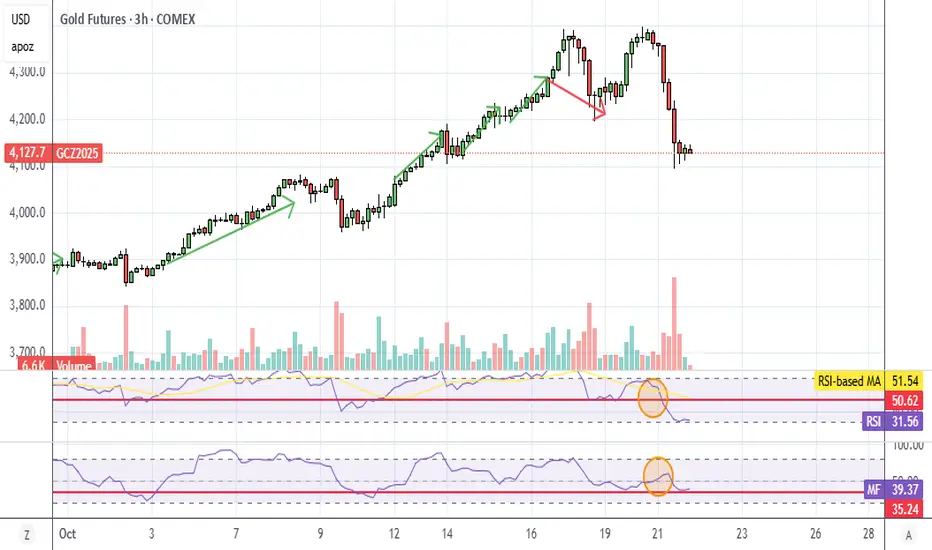
GC - Gold UpdateLooks like my last green arrow was wrong and the red arrow wound up being right anyways, lol.
Anyways, you can see on my chart that gold actually went down while MFI was still climbing. Not a good sign. I think gold is done unless something really bad happens in the world, like Russia invading Europe or something along those lines.
Not touching gold for now, at least I made some money off of it last week. Silver is tanking as well.
GOLD FUTUREs near its resistanceThe unprecedent rally in GOLD nearing its peak as per Elliott WAVE cycle.
Wave 'C' of ABC wave will terminate its golden ratio of expansion 1.62 time of wave A.
IF $4122 is not breached then you may see a great fall in price as there is huge runup in this metal.
Investors; don't do anything
Traders; BOOK PROFITs before the price falls

Gold to Push DownPrice has shown liquidity sweep of the Highs while breaking structure on the smaller timeframe m5. Price has told me it intends to now wipe out previous lows (retail pending orders) and I am targeting the lows of yesterdays NY Session as first target, and London Low as 2nd Target.

Gold , final top $8500 area. Still on track !Gold , final top is in the $8500 area top based on the chart. Still on track with corrections and consolidations along the way. Then big bear market with a low of $2500 and then new bull. Not for trading

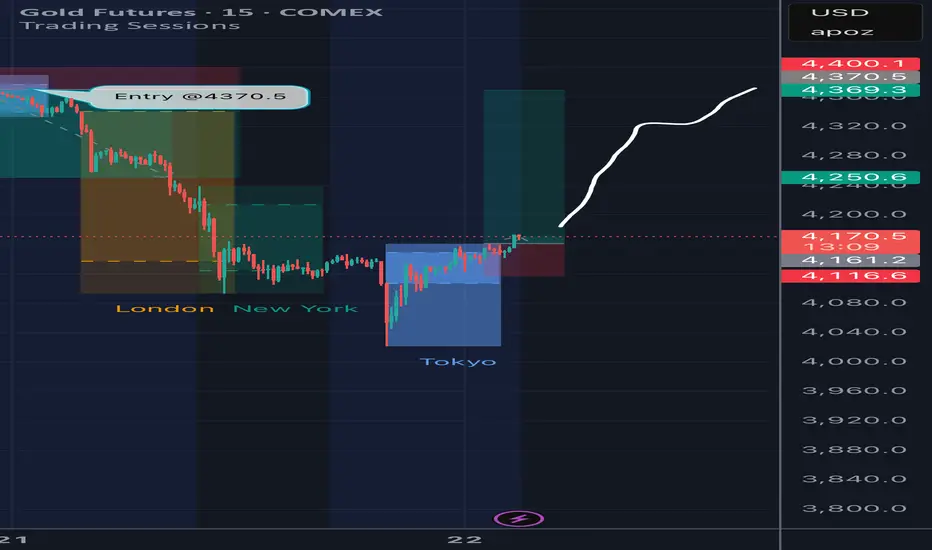
Long trade
1Hr TF overview
📘 Trade Journal Entry
Pair: MGC1! (Micro Gold Futures)
Direction: Buyside Trade
Date: Fri 10th Oct 2025
Time: 12:00 PM
Session: LND to NY Session AM
Timeframe: 1-Hour
🔹 Trade Details
Entry: 3,998.3
Profit Target: 4,373.6 (+9.39%)
Stop Loss: 3,972.4 (–0.63%)
Risk-Reward Ratio (RR): 14.9
⚙️ Model Context
Model 010 – Sweep / Trigger / Entry
Setup Sequence:
Price swept the prior swing low and formed a liquidity grab near the breaker block and demand zone. Clear CHOCH (Change of Character) confirmed on 1H timeframe.
Fib retracement alignment with the 0.618–0.705 zone, providing ideal re-entry confirmation.
Volume expansion occurred at breakout, supported by sustained EMA/WMA alignment.
Structure maintained a strong ascending trendline respecting 50EMA and 200WMA support.
🧭 Narrative Context
Price consolidated in the mid-3,900s region following an extended accumulation phase, with multiple FVGs (Fair Value Gaps) and a high-volume zone below acting as structural support.
Institutional order flow confirmed by consistent re-accumulation and sweep of internal liquidity pockets.
Projection levels 4,259 → 4,373 (Fib 2.618–3.618) highlight continuation potential, targeting extended buyside liquidity above 4,300.
📊 Outcome (as of chart timestamp)
Current price hovering near 4,260+, validating trajectory towards projected extension levels.
Trade remains in the upside continuation phase with structural integrity intact above the 4,120 WMA. Trump’s “Trade War 2.0” rhetoric, combined with renewed geopolitical and tariff tensions, is reviving safe-haven demand. TSM earnings volatility and an anticipated Federal Reserve speech could amplify market uncertainty — typically, this may translate into accelerated gold inflows.

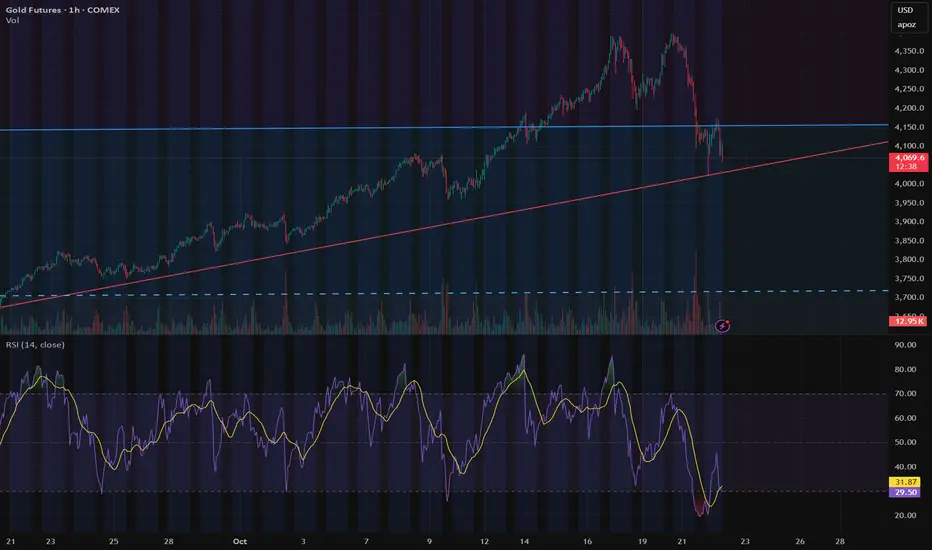
Gold Technical Outlook: Breakout or Breakdown Ahead?Market Context
Gold recently hit fresh all-time highs near $4,400 in mid-October after dovish comments from the Federal Reserve, but has since paused as traders digest the news. The price is consolidating around the $4,000 area, with bulls and bears locked in a tug-of-war, creating a crucial juncture for gold’s short-term trend.
Technical Breakdown
• Trend:
Gold had been climbing steadily along a rising support trendline , but that line has now been broken . This signals that the recent uptrend may be on hold or reversing in the near term.
• Resistances:
The chart shows a classic double-top pattern , with peaks around 4,210–4,225 . After retesting this zone and failing, sellers took control. There’s also a minor resistance zone near 4,040 , which capped a recent bounce.
In short, bulls must reclaim 4,040 first, a breakout above this would open the path toward 4,210–4,225 .
• Support:
Key support lies near 3,914 . This level held strong during earlier pullbacks even after the trendline broke.
If gold retests 3,914 and holds, it could provide a solid base for buyers, but a decisive break below it would confirm downside continuation.
• RSI (Momentum):
The 14-period RSI is hovering near 50 , showing a neutral stance. We can observe both bearish divergence (as price formed a double top while RSI made a lower high) and bullish divergence (as RSI formed higher lows while price dipped).
This mix of signals means momentum is indecisive , traders should wait for confirmation.
What to Watch Next
1. Price Reaction at Key Levels
Watch how price reacts around 4,040 and 3,914 .
A break and hold above 4,040 could shift short-term momentum bullish, targeting 4,210–4,225 .
A rejection or breakdown below 3,914 could trigger further selling pressure.
2. RSI Confirmation
A sustained move of RSI above 50 supports bullish momentum, especially if price also rises.
Conversely, a drop below 45–40 would reinforce bearish sentiment.
If price breaks above the double top and RSI makes a higher high , bearish divergence is invalidated, confirming strength.
But if price breaks below support and RSI follows with new lows , the bullish divergence fails, favoring sellers.
Summary
Gold’s short-term trend depends on how it reacts at these key levels (4,040 and 3,914) .
The market is at a decision point, either breakout or breakdown.
Combining price structure with RSI confirmation can help traders stay aligned with the next impulsive move.
Analysis by @TraderRahulPal | More analysis & educational content on my profile.
Disclaimer: This analysis is for educational purposes only and should not be considered financial advice. Trade responsibly with proper risk management.
