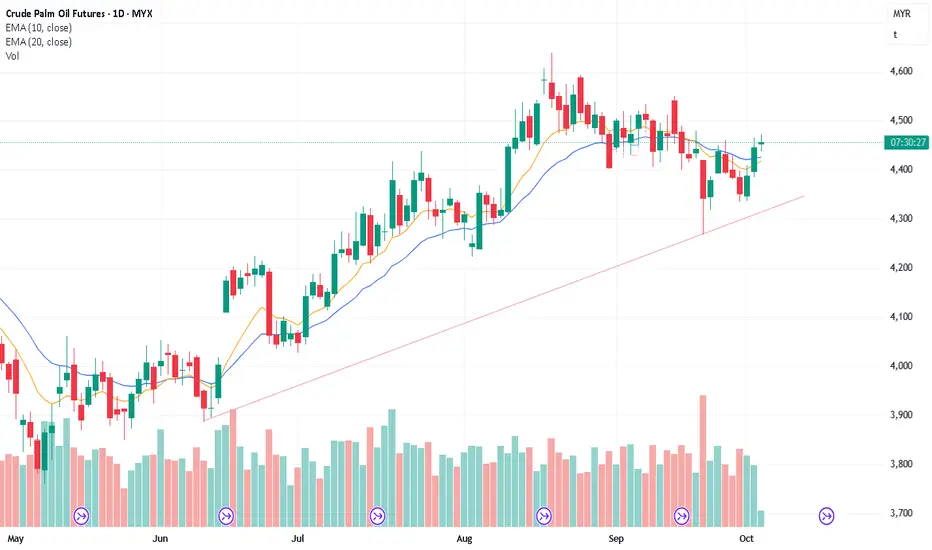
FCPO Week 43 2025: Consolidation or bearish to 4300?Happy Deepavali!
Price has shifted from bullish to a potential bearish. Momentum to go higher has been greatly reduced. A key reversal created on Friday could be the Lower High for a bearish move.
There is a potential of double top. Still early since it is yet to confirm. If price can break and close below 4490 then bearish could go and test 4300. Price will confirm double top once if break below 4270 area.
If there is no momentum this week then another consolidation is expected with a view for a break to a lower price.
Happy trading.
Trade ideas

Weekly Roundup: FCPO as of October 10, 2025Weekly Roundup: FCPO as of October 10, 2025
Market Stance & Technical Bias
Stance: Bullish, based on a valid cup and handle formation evident across both daily and weekly timeframes.
Confidence Level: High for bullish continuation upon confirmation; medium until a decisive breakout is observed.
Price Action & Trend Structure
Cup and Handle Formation:
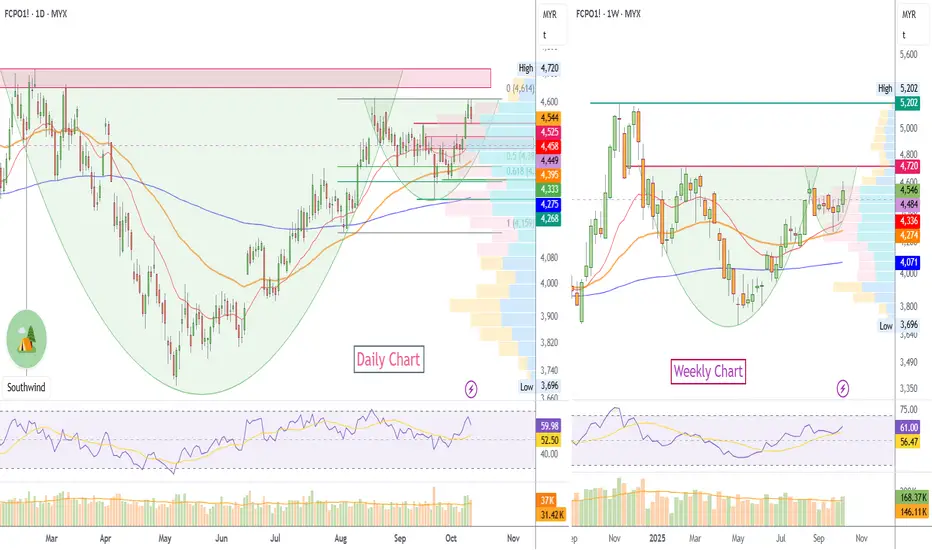
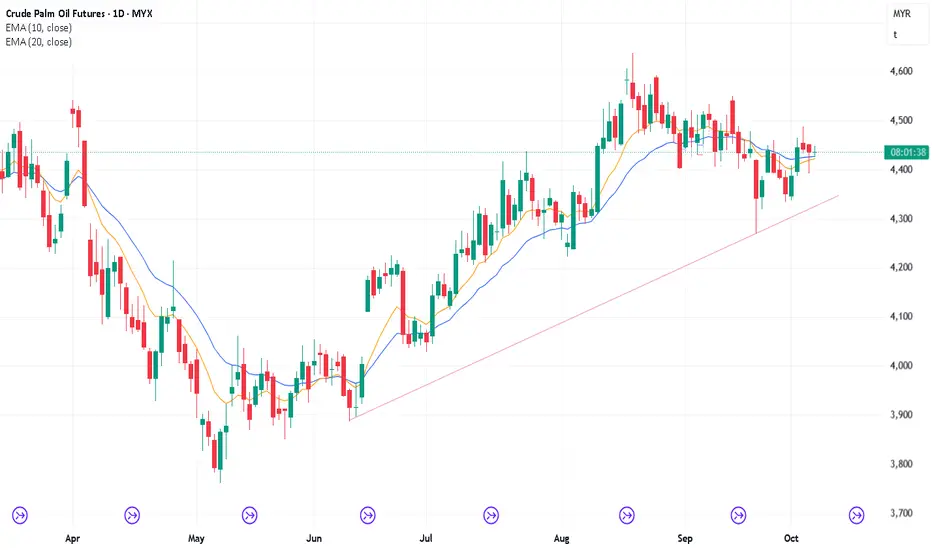
- Classic rounding bottom (“cup”) developed over multiple months, with a minor handle consolidation at the rim (4,614 MYR).FCPO1-_2025-10-11_21-34-16.jpg
- This pattern is one of the most reliable bullish continuation setups, especially when confirmed by increasing volume on breakout.
Trend Dynamics:
- Daily and weekly charts show sustained series of higher lows from the cup base (~3,700 MYR) up to the rim area.FCPO1-_2025-10-11_21-34-16.jpg
- The handle features shallow retracement, suggesting strong buyer interest and a controlled, healthy setup.
Key Technical Levels
| Level | Significance |
| --- | --- |
| 4,614 MYR | Cup rim; breakout trigger |
| 4,444–4,458 MYR | Handle support, minor pullback region |
| 4,268 MYR | Major trend support, bullish invalidation threshold |
| 5,200 MYR | Initial upside target post-breakout |
| 5,630–5,740 MYR | Measured move target for full pattern completion |
Candlestick & Volume Analysis
- Bullish price builds, with candles showing long lower wicks and closing nearer session highs just below rim resistance.FCPO1-_2025-10-11_21-34-16.jpg
- Volume has contracted during handle formation and increased on rallies to the resistance—ideal structure for an imminent technical breakout.FCPO1-_2025-10-11_21-34-16.jpg
- Watch for day/weekly closes above 4,614 MYR with volume surging 20–30% above recent averages to confirm the breakout and limit false signals.FCPO1-_2025-10-11_21-34-16.jpg
Trading Plan
**Entry:** Initiate long position only on clear daily/weekly close above 4,614 MYR with confirming volume.FCPO1-_2025-10-11_21-34-16.jpg
**Stop-loss:** Below handle lows (around 4,420 MYR) to manage breakout failure risk.
**Upside targets:**
- First: 5,200 MYR
- Second: measured-move target near 5,630–5,740 MYR (cup depth projection).
Risk management : Avoid anticipation; confirm breakout with price and volume. Tight stop-loss placement recommended.
Immediate Action Points
- Monitor price consolidation below 4,614 for compressing ranges and accumulation, indicating imminent momentum.
- Volume analysis critical—breakout must coincide with notably higher volume to validate move.
Summary Table
| Technical Signal | Status as of Oct 10, 2025 |
| --- | --- |
| Cup & handle valid? | Yes, clearly formed |
| Breakout entry level | 4,614 MYR |
| Confirmation needed | Price close + strong volume |
| Stop loss | 4,420 MYR |
| First target | 5,200 MYR |
| Full pattern target | 5,630–5,740 MYR |
Weekly Summary:
The FCPO chart as of October 10, 2025 presents a classic bullish cup and handle pattern. Traders should wait for a decisive daily or weekly close above 4,614 MYR, supported by robust volume, before acting. Initial and measured-move targets offer strong risk/reward if the breakout is confirmed. Immediate invalidation occurs below 4,420 MYR, while a failure at 4,614 MYR warrants patience until renewed bullish signals appear.
This analysis discounts all fundamental inputs and is driven entirely by price structure and technical expectation for FCPO.
17/10/25 Can Bull Create Strong FT Buying or Fail to Do So?
Thursday’s candlestick (Oct 16) was another doji trading around the 20-day EMA.
In our last report, we stated that traders would observe whether the bulls could create a retest of the October 9 high in the next few days, even if it only forms a lower high, or if the bears would be able to create follow-through selling below the 20-day EMA.
The market continued to trade sideways around the 20-day EMA. During Thursday night's market, the market traded higher.
The bulls see the recent move (Oct 15) as a pullback and want the 20-day EMA to act as support.
They hope to get a retest of the October 9 high, even if it only forms a lower high.
They must create strong consecutive bull bars to increase the odds of the market trading higher.
They want today to close as a strong bull bar so that the weekly candlestick has a bull body and closes near its high.
The bears see the recent (Oct 9) move as a buy vacuum retest of the August high.
They want a reversal from a double top bear flag (Aug 19 and Oct 9), a lower high major trend reversal (Oct 9), as well as a larger double top bear flag with the February high.
They see Thursday night's rally (Oct 17) forming a lower high and want the market to reverse below the 20-day EMA.
The bears must create consecutive bear bars trading far below the 20-day EMA to increase the odds of a deeper pullback.
They want Friday to close as a strong bear bar so that the weekly candlestick will have a strong bear body.
Production: SPPOMA's first 15 days increased up 6%.
Refineries' appetite to buy remains decent.
Export: Oct up 16% for the first 15 days as per ITS.
For today (Friday, Oct 17), traders will see if the bulls can create a strong bull bar. If they do, the weekly candlestick will close with a bull body near its high. If this is the case, the market could still trade slightly higher next week.
Or will the bears be able to create a strong bear bar, perhaps closing below the 20-day EMA? If they do, it will reduce the recent bullishness.
Andrew
FCPO Week 42 2025: Bullish to 4700?Does price ready for the upside? It looks bullish at the moment. However there might be a retracement coming. A retracement to about 4460-4470 area should create another movement higher.
Happy trading and good luck.
16/10/25 Currently Sideways Around 20-Day EMA
Wednesday’s candlestick (Oct 15) was an inside doji with prominent tails.
In our last report, we stated that traders would observe whether the bulls could create a retest of the October 9 high in the next few days, even if it only forms a lower high, or if the bears would be able to create follow-through selling below the 20-day EMA.
So far, the market is trading sideways slightly above the 20-day EMA.
The bulls see the current move as a pullback and want the 20-day EMA to act as support.
They hope to get a retest of the October 9 high, even if it only forms a lower high.
They must create strong consecutive bull bars to increase the odds of the market trading higher.
The bears see the recent (Oct 9) move as a buy vacuum retest of the August high.
They want a reversal from a double top bear flag (Aug 19 and Oct 9), a lower high major trend reversal (Oct 9), as well as a larger double top bear flag with the February high.
The bears must create consecutive bear bars trading far below the 20-day EMA to increase the odds of a deeper pullback.
Production: SPPOMA's first 10 days increased up 6%.
Refineries' appetite to buy remains decent.
Export: Oct up 16% for the first 15 days as per ITS.
For today (Thursday, Oct 16), traders will see if the bulls can create a retest of the October 9 high in the next few days, even if it only forms a lower high.
Or will the bears be able to create follow-through selling below the 20-day EMA? If they do, especially it is strong, it could swing the odds for a deeper pullback moving forward.

24/5/25 Will The Weekly Candlestick Close Bearish or Neutral?
Thursday’s candlestick (Oct 23) was a bull bar closing near its high with a long tail below and trading below the 20-day EMA.
In our last report, we said traders would observe whether the bears could create follow-through selling below the 20-day EMA, or if the market would trade slightly lower but stall, reversing to retest the 20-day EMA instead.
The market traded lower, but formed a rally in the last 2 hours (following the rally in Crude Oil and SBO) and is still trading below the 20-day EMA.
The bulls see the current move as another pullback.
They want the September 30 or September 23 low areas to act as support.
They want a reversal from a large double bottom bull flag (September 23 and October 23 lows) and want the market to reverse back above the 20-day EMA.
They must create strong consecutive bull bars trading above the 20-day EMA to show they are back in control.
They want Friday's candlestick to be a strong bull bar so that the weekly candlestick will have a bull body and close above the 20-week EMA.
The bears see the recent (Oct 9) move as a buy vacuum retest of the August high.
They want a reversal from a double top bear flag (Aug 19 and Oct 9), a lower high major trend reversal (Oct 9), as well as a larger double top bear flag with the February high on the larger time frame.
They see last Friday's rally (Oct 17) forming a lower high and Tuesday (Oct 21) forming a micro double top (Oct 17 and Oct 21).
They want the market to reverse below the 20-day EMA. They got what they wanted.
If the market trades higher, they want the 20-day EMA or the October 17 high to act as resistance, followed by a 3rd leg sideways to down.
The bears must create sustained follow-through selling trading far below the 20-day EMA and the September 23 low to increase the odds of a deeper pullback.
They want a strong bear bar today so that the weekly candlestick will close near its low and below the 20-week EMA.
Production: SPPOMA's first 20 days increased up 2.7%.
Refineries' appetite to buy remains decent.
Export: Oct up 2.4% for the first 20 days as per ITS.
For today (Friday, Oct 24), traders will see if the bears can create a bear bar closing near its low. If they get that, the weekly candlestick will close near its low, which will increase the odds of next week trading at least a little lower.
Or will the bulls be able to create a bull bar instead? If this is the case, the weekly candlestick will close above the 20-week EMA with a long tail below, and possibly with a bull body. This will reduce the recent bearishness.
Andrew
23/10/25 Bears Need FT Selling Below 20-Day EMA
Wednesday’s candlestick (Oct 22) was a bear bar closing in its lower half and closing below the 20-day EMA.
In our last report, we stated that traders would observe whether the bears could create follow-through selling below the 20-day EMA or if the 20-day EMA would continue to act as support, followed by a retest of the October 9 highs in the days ahead.
The market traded lower, and the bears managed to get a bear bar closing below the 20-day EMA.
The bulls see the current move as another pullback.
They want the September 30 or September 23 low areas to act as support.
They want a reversal from a large double bottom bull flag (with Sept 23 low) and want the market to reverse back above the 20-day EMA.
They must create strong consecutive bull bars to show they are back in control.
The bears see the recent (Oct 9) move as a buy vacuum retest of the August high.
They want a reversal from a double top bear flag (Aug 19 and Oct 9), a lower high major trend reversal (Oct 9), as well as a larger double top bear flag with the February high on the larger time frame.
They see last Friday's rally (Oct 17) forming a lower high and Tuesday (Oct 21) forming a micro double top (Oct 17 and Oct 21).
They want the market to reverse below the 20-day EMA. They got what they wanted.
The bears must create sustained follow-through selling trading far below the 20-day EMA and the September 23 low to increase the odds of a deeper pullback.
Production: SPPOMA's first 20 days increased up 2.7%.
Refineries' appetite to buy remains decent.
Export: Oct up 2.4% for the first 20 days as per ITS.
So far, the market has closed below the 20-day EMA on Wednesday.
For today (Thursday, Oct 23), traders will see if the bears can create follow-through selling below the 20-day EMA. If the bears can get sustained follow-through selling in the next few trading sessions, the odds a deeper pullback will increase.
Or will the market trade slightly lower but stall, reversing to retest the 20-day EMA instead?
Andrew

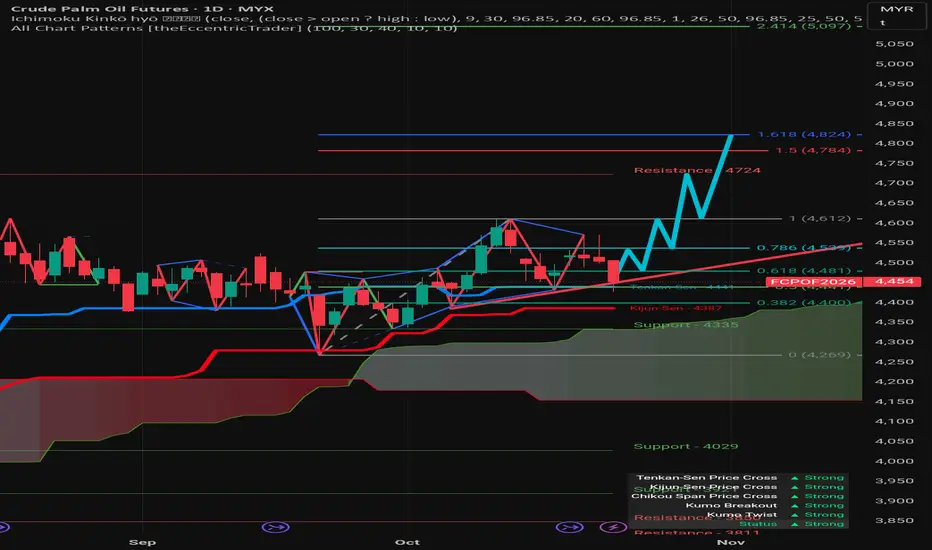
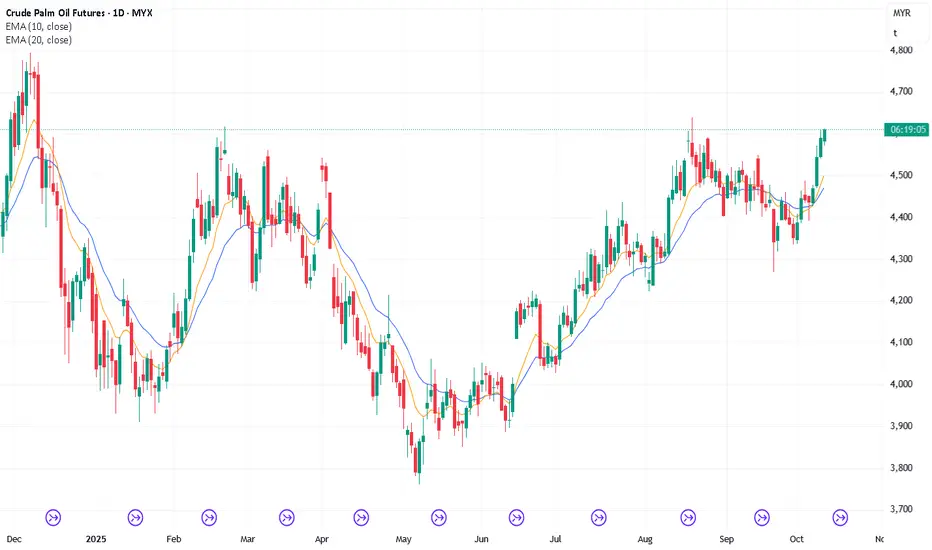
Strong bullish environmentTenkan-Sen (Conversion Line - Blue): 4,441
Kijun-Sen (Base Line - Red): 4,287
Kumo (Cloud): The shaded area that acts as a dynamic support/resistance zone. The current price is trading above the upper edge of the cloud (Senkou Span A/B), which is generally bullish.
Chikou Span (Lagging Span - Green): The closing price shifted back in time, used to confirm the trend's momentum.
Immediate Resistance: 4,527 (The 0.786 Fibonacci retracement level, which appears to have recently acted as a minor reversal point).
Key Resistance (Recent High): 4,724 (This is the high of the recent upward move).
Fibonacci Extension Targets:
1(4,784)
1.618(4,824) (This level is often a strong target for trend continuation).
2.414(5,097) (A longer-term, more ambitious target).
Support
Ichimoku/Fibonacci Support: 4,400 (0.382 Fibonacci retracement level, near the Tenkan-Sen).
Strong Support (Kijun-Sen): 4,287
Mid-Term Support (Below Kijun-Sen): 4,335
Cloud Support: The cloud itself (Kumo) provides a broad support area.
Potential Lower Support: 4,269 (0 Fibonacci level, corresponding to a previous swing low).
Long-Term Support: 4,029 (Marked as a significant previous low).
Strong Resistance/Support Zone (Lower): 3,811 (Marked as a previous resistance level, suggesting it could act as strong support if tested).
Trade Signals (Ichimoku Confirmation)
The table at the bottom suggests a strong bullish environment:
The price is currently in a pullback phase, testing the lower support areas within the context of this strong upward trend.
22/10/25 Bears Need FT Selling Below 20-Day EMA
Tuesday’s candlestick (Oct 22) was a bear doji closing near its low with a long tail above and closing around the 20-day EMA.
In our last report, we stated that traders would watch to see if the bears could create follow-through selling below the 20-day EMA, and if the 20-day EMA would continue to act as support, followed by a retest of the October 9 highs in the days ahead.
The market traded slightly higher in the morning session, forming a micro double top with the October 17 high, but reversed to close near its low of the day.
The bulls see the recent move (Oct 15) as a pullback and want the 20-day EMA to act as support.
They hope to get a retest of the October 9 high, even if it only forms a lower high. So far, the retest is a lower high (Oct 17).
They must create strong consecutive bull bars to increase the odds of the market trading higher.
The bears see the recent (Oct 9) move as a buy vacuum retest of the August high.
They want a reversal from a double top bear flag (Aug 19 and Oct 9), a lower high major trend reversal (Oct 9), as well as a larger double top bear flag with the February high on the larger time frame.
They see last Friday's rally (Oct 17) forming a lower high and yesterday (Oct 21) forming a micro double top (Oct 17 and Oct 21).
They want the market to reverse below the 20-day EMA.
The bears must create strong consecutive bear bars trading far below the 20-day EMA to increase the odds of a deeper pullback.
Production: SPPOMA's first 20 days increased up 2.7%.
Refineries' appetite to buy remains decent.
Export: Oct up 2.4% for the first 20 days as per ITS.
So far, the market traded below the 20-day EMA during Tuesday night's session.
For today (Wednesday, Oct 22), traders will see if the bears can create some follow-through selling below the 20-day EMA.
Or will the 20-day EMA continue to act as support, followed by a retest of the October 9 highs in the days ahead?
Andrew

21/10/25 Can The Bears Create FT Selling Below 20-Day EMA?
Friday’s candlestick (Oct 17) was a bear doji closing in its lower half with a long tail above and closing above the 20-day EMA.
In our last report, we said traders would watch if bulls could create a strong bull bar, closing the weekly candlestick with a bull body. Or, if bears could create a strong bear bar, perhaps closing below the 20-day EMA.
The bulls could not create a bull bar, but the bears could not create a close below the 20-day EMA either. The weekly candlestick closed with a bear body.
The bulls see the recent move (Oct 15) as a pullback and want the 20-day EMA to act as support.
They hope to get a retest of the October 9 high, even if it only forms a lower high. So far, the retest is a lower high (Oct 17).
They must create strong consecutive bull bars to increase the odds of the market trading higher.
This point is already stated in paragraph 3. Remove here to avoid repetition.
The bears see the recent (Oct 9) move as a buy vacuum retest of the August high.
They want a reversal from a double top bear flag (Aug 19 and Oct 9), a lower high major trend reversal (Oct 9), as well as a larger double top bear flag with the February high on the larger time frame.
They see Friday's rally (Oct 17) forming a lower high and want the market to reverse below the 20-day EMA.
The bears must create strong consecutive bear bars trading far below the 20-day EMA to increase the odds of a deeper pullback.
Production: SPPOMA's first 15 days increased up 6%.
Refineries' appetite to buy remains decent.
Export: Oct up 16% for the first 15 days as per ITS.
For tomorrow (Tuesday, Oct 21), traders will see if the bears can create some follow-through selling below the 20-day EMA.
Or will the 20-day EMA continue to act as support, followed by a retest of the October 9 highs in the days ahead?
Andrew

15/10/25 Retest Oct 9 High or FT Selling Below 20-Day EMA?
Tuesday’s candlestick (Oct 14) was a bear bar closing near its low with a long tail above.
In our last report, we stated that traders would observe whether the bulls could create a strong retest of the October 9 high in the next few days, or if the move would lack sustained follow-through buying and stall at a lower high.
The market traded higher but reversed into a bear bar, closing below the 20-day EMA.
The bulls see the current move as a pullback and want the 20-day EMA to act as support.
They hope to get a retest of the October 9 high, even if it only forms a lower high.
They must create strong consecutive bull bars to increase the odds of the market trading higher.
The bears see the recent (Oct 9) move as a buy vacuum retest of the August high.
They want a reversal from a double top bear flag (Aug 19 and Oct 9), a lower high major trend reversal (Oct 9), as well as a larger double top bear flag with the February high.
The bears must create consecutive bear bars trading far below the 20-day EMA to increase the odds of a deeper pullback.
Production: SPPOMA's first 10 days increased up 6%.
Refineries' appetite to buy remains decent.
Export: Oct up 9% for the first 10 days as per ITS.
For today (Wednesday, Oct 15), traders will see if the bulls can create a retest of the October 9 high in the next few days, even if it only forms a lower high.
Or will the bears be able to create follow-through selling below the 20-day EMA? If they do, especially it is strong, it could swing the odds for a deeper pullback moving forward.
Andrew
14/10/25 Can Bulls Create Strong Retest of Oct 9 High?
Monday’s candlestick (Oct 13) was a bear bar closing in its upper half with a long tail below.
In our last report, we stated that traders would observe whether the bears could create a follow-through bear bar, even if it is only a bear doji, or if the bulls would be able to completely reverse the Friday pullback instead.
The market traded lower to test the 20-day EMA, and the bears created some follow-through selling, albeit not yet strong (long tail below the candlestick).
The bulls got a retest near the August high (Oct 9).
They see the current move as a pullback and want the 20-day EMA to act as support.
They hope to get a retest of the October 9 high, even if it only forms a lower high.
They must create a strong breakout above the August high, accompanied by follow-through buying, to increase the odds of the market trading higher.
The bears see the recent (Oct 9) move as a buy vacuum retest of the August high.
They want a reversal from a double top bear flag (Aug 19 and Oct 9), a lower high major trend reversal, as well as a larger double top bear flag with the February high.
They see the current move as a retest of the October 9 high and want it to form a lower high.
The bears must create consecutive bear bars to increase the odds of a deeper pullback.
Production: SPPOMA's first 10 days increased up 6%.
Refineries' appetite to buy remains decent.
Export: Oct up 9% for the first 10 days as per ITS.
For today (Tuesday, Oct 14), traders will see if the bulls can create a strong retest of the October 9 high in the next few days.
Or will the move lack sustained follow-through buying instead, stalling at a lower high?
Andrew
13/10/25 Can Bears Create FT Selling or Retest High Instead?
Friday’s candlestick (Oct 10) was an outside bear bar closing in its lower half with prominent tails.
In our last report, we stated that traders would observe whether the bulls can create another strong bull bar or if the bears are able to create a bear bar instead.
The market traded higher but lacked follow-through buying and reversed into a bear bar. The weekly candlestick closed with a prominent tail above.
The bulls got a retest near the August high.
They want a breakout above the August high, followed by a resumption of the trend.
They must create a strong breakout above the August high, accompanied by follow-through buying, to increase the odds of the market trading higher.
If the market trades lower, they want the 20-day EMA to act as support.
The bears see the current move as a buy vacuum retest of the August high.
They want a reversal from a double top bear flag (Aug 19 and Oct 10), as well as a larger double top bear flag with the February high.
The bears must create consecutive bear bars to increase the odds of a deeper pullback.
If the market trades higher, they want a failed breakout above the August high.
Production: fSPPOMA's first 5 days increased up 12%.
Refineries' appetite to buy remains decent.
Export: Oct up 9% for the first 10 days as per ITS.
For today (Monday, Oct 13), traders will see if the bears can create a follow-through bear bar, even if it is only a bear doji.
Or will the bears be able to completely reverse the Friday pullback instead?
Andrew
10/10/25 Bulls Want Weekly Candlestick to Close at High
Thursday’s candlestick (Oct 9) was a bull bar closing near its high with a small tail above.
In our last report, we stated that traders would observe whether the bulls could generate more follow-through buying above the September 17 high, or if the market would stall around that level instead.
The market continued to trade higher, testing near the August high.
The bulls got a retest near the August high.
They want a breakout above the August high, followed by a resumption of the trend.
They must create a strong breakout above the August high, accompanied by follow-through buying, to increase the odds of the market trading higher.
The bears see the current move as a buy vacuum retest of the August high.
They want a reversal from a double top bear flag (Aug 19 and Oct 9), and a larger double top bear flag with the February high.
If the market trades higher, they want a failed breakout above the August high.
Production for Oct should be down. SPPOMA's first 5 days increased up 12%.
Refineries' appetite to buy remains decent.
Export: Oct down in the first 5 days.
The bulls want the weekly candlestick to close near its high. That would increase the odds of next week trading at least a little higher.
The bears want a strong bear bar today so that the weekly candlestick will have a prominent tail above.
For today (Friday, Oct 10), traders will see if the bulls can create another strong bull bar.
Or will the bears be able to create a bear bar instead?
9/10/25 Bulls Need Strong BO Above Sept 17 High
Wednesday’s candlestick (Oct 8) was a big bull bar closing in its upper half with a prominent tail above.
In our last report, we stated that traders would observe whether the bulls can create more follow-through buying above the 20-day EMA, or if the market would trade higher but stall below the September 17 high instead.
The market traded higher to test the September 17 high but closed slightly below it.
The bulls view the recent move (Sep 23) as a deeper two-legged pullback and want a reversal from a double bottom bull flag (Aug 29 and Sep 23) and a large double bottom bull flag (Aug 4 and Sep 23).
They want the pullback to lack follow-through selling, forming a higher low. So far, this is the case.
They want a retest of the August high, even if it only forms a lower high. The move is underway.
They must create a strong breakout above the September 17 high to increase the odds of testing the August high.
The bears got a deep pullback and a breakout below the tight trading range (Sep 23), but the move lacked sustained follow-through selling.
They see the current move as a pullback and want the September 17 high to act as resistance.
They want a reversal from a large double top bear flag (Sept 17 and Oct 8), and a lower high major trend reversal.
They need to create strong bear bars to show they are back in control.
Production for Oct should be down. SPPOMA's first 5 days increased up 12%.
Refineries' appetite to buy remains decent.
Export: Oct down in the first 5 days.
For today (Thursday, Oct 9), traders will see if the bulls can create more follow-through buying above the September 17 high.
Or will the market stall around the September 17 high instead?
Andrew
8/10/25 Bulls Still Need More FT Buying
Tuesday’s candlestick (Oct 7) was a bull bar closing near its high.
In our last report, we stated that traders would observe whether the bulls could create more follow-through buying above the 20-day EMA, or if the market would stall and reverse below it instead.
The market traded higher above the 20-day EMA.
The bulls view the recent move (Sep 23) as a deeper two-legged pullback and want a reversal from a double bottom bull flag (Aug 29 and Sep 23) and a large double bottom bull flag (Aug 4 and Sep 23).
They view the recent move (Sept 30) as a retest of the prior low (Sept 23), and want the pullback to lack follow-through selling, forming a higher low. So far, this is the case.
They want a retest of the August high, even if it only forms a lower high.
They must create follow-through buying above the 20-day EMA to increase the odds of the market trading higher.
The bears got a deep pullback and a breakout below the tight trading range (Sep 23), but the move lacked sustained follow-through selling.
They see the current move as a pullback and want the 20-day EMA to act as resistance.
They want a reversal from a large double top bear flag (Sept 17 and Oct 3), followed by another sideways to down leg to complete the wedge pattern.
They also observe a smaller wedge forming (Sept 26, Oct 3, and Oct 8).
They need to create strong bear bars below the 20-day EMA to increase the odds of a reversal.
Production for Oct should be down. SPPOMA's first 5 days increased up 12%.
Refineries' appetite to buy remains decent.
Export: Oct down in the first 5 days.
For today (Wednesday, Oct 8), traders will see if the bulls can create more follow-through buying above the 20-day EMA.
Or will the market trade higher but stall below the September 17 low instead?
Andrew

7/10/25 Bulls Still Need FT Buying Above 20-day EMA
Monday’s candlestick (Oct 6) had a small bear body closing in its upper half with a long tail below.
In our last report, we stated that traders would observe whether the bulls could create more follow-through buying above the 20-day EMA, or if the market would stall and reverse below the 20-day EMA instead.
The market traded lower below the 20-day EMA but reversed to close above it.
The bulls view the recent move (Sep 23) as a deeper two-legged pullback and want a reversal from a double bottom bull flag (Aug 29 and Sep 23) and a large double bottom bull flag (Aug 4 and Sep 23).
They view the recent move (Sept 30) as a retest of the prior low (Sept 23), and want the pullback to lack follow-through selling, forming a higher low. So far, this is the case.
They want a retest of the August high, even if it only forms a lower high.
They must create follow-through buying above the 20-day EMA to increase the odds of the market trading higher.
The bears got a deep pullback and a breakout below the tight trading range (Sep 23), but the move lacked sustained follow-through selling.
They see the current move as a pullback and want the 20-day EMA to act as resistance.
They want a reversal from a large double top bear flag (Sept 17 and Oct 3), followed by another sideways to down leg to complete the wedge pattern.
They need to create strong bear bars below the 20-day EMA to increase the odds of a reversal.
Production for Oct should be down. SPPOMA's first 5 days increased up 12%.
Refineries' appetite to buy remains decent.
Export: Oct down in the first 5 days.
For today (Tuesday, Oct 7), traders will see if the bulls can create more follow-through buying above the 20-day EMA.
Or will the market stall around the 20-day EMA area and reverse below it instead?
Andrew
6/10/25 Bulls Need FT Buying Above the 20-Day EMA
Friday’s candlestick (Oct 3) was a bear bar closing near its low with a long tail above.
In our last report, we stated that traders would observe whether the bulls can create a strong bull bar closing near its high, or if the market would stall and reverse below the 20-day EMA instead.
The market traded higher but reversed to close with a bear body, but still above the 20-day EMA.
The bulls view the recent move (Sep 23) as a deeper two-legged pullback and want a reversal from a double bottom bull flag (Aug 29 and Sep 23) and a large double bottom bull flag (Aug 4 and Sep 23).
They view the recent move (Sept 30) as a retest of the prior low (Sept 23), and want the pullback to lack follow-through selling, forming a higher low. So far, this is the case.
They want a retest of the August high, even if it only forms a lower high.
They must create follow-through buying above the 20-day EMA to increase the odds of the market trading higher.
The bears got a deep pullback and a breakout below the tight trading range (Sep 23), but the move lacked sustained follow-through selling.
They see the current move as a pullback and want the 20-day EMA to act as resistance.
They want the market to form a double top bear flag with the Sept 26 high, followed by another sideways to down leg to complete the wedge pattern.
They need to create strong bear bars below the 20-day EMA to increase the odds of a reversal.
Production for Oct should be down.
Refineries' appetite to buy remains decent.
Export: Oct export remains to be seen.
The weekly candlestick closed with a bull body in its upper half. The bulls need to create follow-through buying this week to increase the odds of testing the August high.
For tomorrow (Monday, Oct 6), traders will see if the bulls can create more follow-through buying above the 20-day EMA.
Or will the market stall and reverse below the 20-day EMA instead?
Andrew

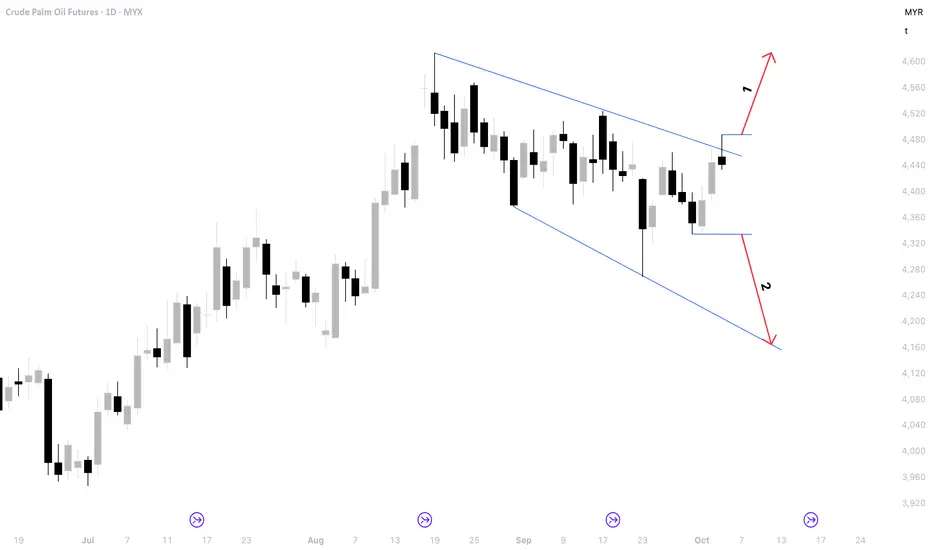
FCPO Week 41 2025: 4100 or 4600?2 scenarios next week MYX:FCPO1! :
1) Bullish: if price close above 4490 then it is bullish towards 4600.
2) Bearish: if price close below 4330 then it is bearish towards 4100.
3) Consolidation: If you trade consolidation there are about plus minus 150 points in between bullish and bearish scenarios.
Happy trading and good luck!
FCPO Weekly Roundup: Week Ending October 03, 2025— Strategic Commodity Insight — 🔶📊🌴
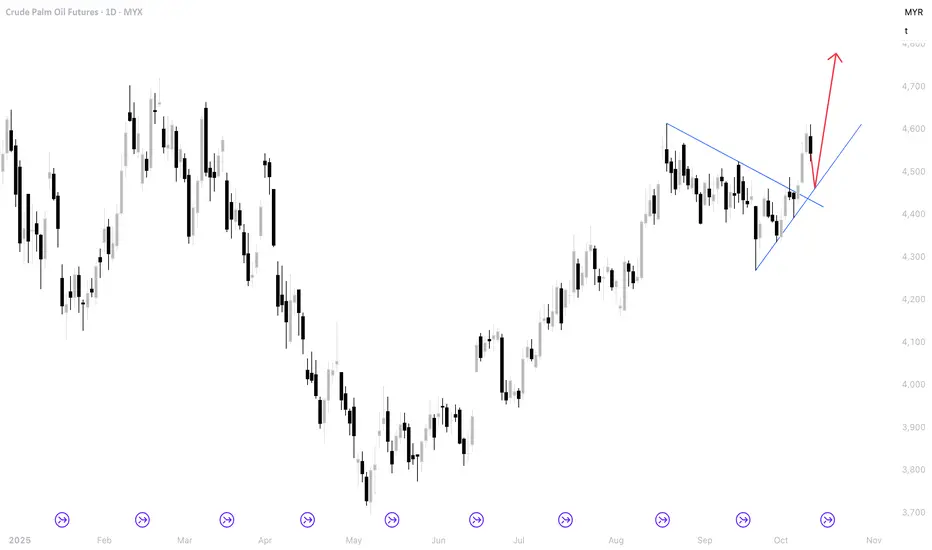
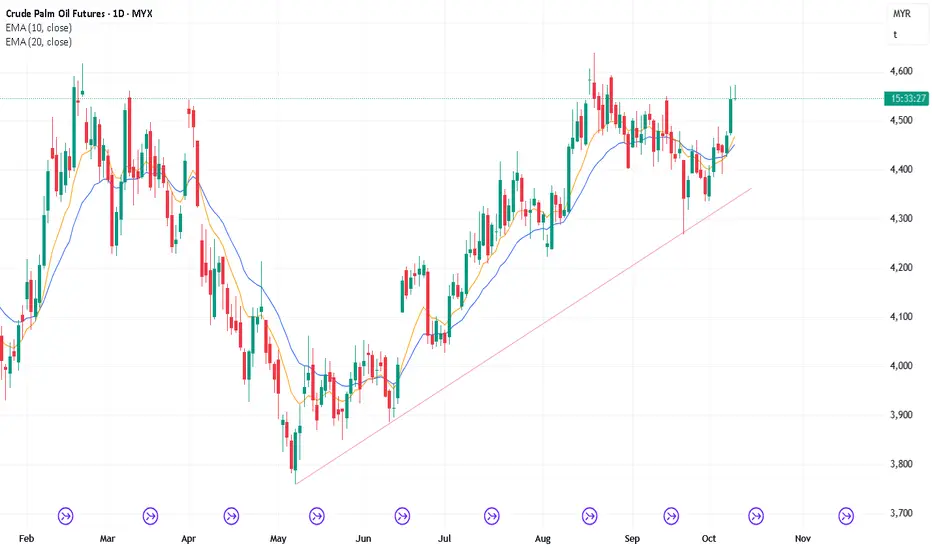
FCPO's technical posture is constructively bullish, as the price coils within a well-defined bull flag on the daily chart. This consolidation is acting as the "handle" for a larger "cup and handle" formation visible on both daily and weekly timeframes, a pattern that strongly suggests a potential upside continuation.
Detailed Analysis ✨
Cup and Handle / Bull Flag Formation: The market carved out a broad, rounding bottom (the "cup") from May through August. The subsequent pullback has formed a textbook descending channel (the "handle" or bull flag). This coiling price action is typical before a major trend resumption.
Supply Zone and Profit-Taking: The reason for the recent stalled momentum is clear: the price is grappling with the significant overhead supply zone between 4,450 and 4,724 MYR. This area represents prior highs where buyers are now exiting positions, causing intraday gains to fade as the market absorbs this trapped supply. Each attempt to break higher has been met with profit-taking, but the pattern of higher lows within the flag remains intact.
Breakout Potential: The price is now approaching the apex of the bull flag, suggesting a breakout is becoming more likely. A decisive close above the flag's upper trendline (currently near 4,525 MYR) would be the first signal, with confirmation on a move above the cup's rim at the 4,614–4,724 MYR resistance zone.
Updated Key Levels and Outlook 🎯
Immediate Resistance: The upper channel line of the bull flag around 4,525 MYR.
Major Breakout Level: A sustained close above the 4,614 MYR pivot is required to validate the cup-and-handle pattern and trigger the next leg higher.
Primary Support: The base of the handle at 4,262–4,214 MYR remains the critical level to hold. A break below this would invalidate the bullish setup.
Takeaway: The combination of a cup-and-handle pattern with a bull flag handle points to a high probability of an upside resolution in the coming week. While sellers at the supply zone are providing friction, the underlying structure suggests buyers are accumulating strength for a breakout attempt. Watch for a close above 4,614 MYR to confirm the start of a new uptrend 🚀

3/10/25 Can Bulls Get a Strong Weekly Candlestick?
Thursday’s candlestick (Oct 2) was a follow-through bull bar closing in its upper half with a prominent tail above.
In our last report, we stated that traders would observe whether the bulls could create more follow-through buying, closing above the 20-day EMA, or if the market would test near the 20-day EMA but stall and trade lower instead.
The market traded higher and closed above the 20-day EMA.
The bulls view the recent move (Sep 23) as a deeper two-legged pullback and want a reversal from a double bottom bull flag (Aug 29 and Sep 23) and a large double bottom bull flag (Aug 4 and Sep 23).
They view the recent move (Sept 30) as a retest of the prior low (Sept 23), and want the pullback to lack follow-through selling, forming a higher low. So far, this is the case.
They want a retest of the August high, even if it only forms a lower high.
They must create follow-through buying above the 20-day EMA to increase the odds of the market trading higher.
The bears got a deep pullback and a breakout below the tight trading range (Sep 23), but the move lacked sustained follow-through selling.
They see the current move as a pullback and want the 20-day EMA to act as resistance.
They want the market to form a double top bear flag with the Sept 26 high.
They need to create strong bear bars below the 20-day EMA to increase the odds of a reversal.
Production for Oct should be down.
Refineries' appetite to buy remains decent.
Export: Oct export remains to be seen.
The bulls want a strong bull bar today so that the weekly candlestick will close near its high and above last week's high. If this is the case, odds slightly favor next week to trade at least a little higher.
The bears want a strong bear bar closing below the 20-day EMA today, so that the weekly candlestick will close as a doji or with a small bear body, reducing the recent bullishness.
For today (Friday, Oct 3), traders will see if the bulls can create a strong bull bar closing near its high. If they do, the weekly candlestick will close near its high, which will increase the bullishness for next week.
Or will the market stall and reverse below the 20-day EMA instead?
Andrew
2/10/25 Bulls Need Strong Close Above 20-Day EMA
Wednesday’s candlestick (Oct 1) was a bull bar closing in its upper half with a prominent tail above.
In our last report, we stated that traders would observe whether the bears could create more follow-through selling testing near the Sept 23 low, or if the move would start to stall at a higher low, followed by a reversal above the 20-day EMA in the weeks ahead.
The market stalled at a higher low (vs Sep 23) so far, and traded higher for the day.
The bulls view the recent move (Sep 23) as a deeper two-legged pullback and want a reversal from a double bottom bull flag (Aug 29 and Sep 23) and a large double bottom bull flag (Aug 4 and Sep 23).
They view the recent move (Sept 30) as a retest of the prior low (Sept 23), and want the pullback to lack follow-through selling, forming a higher low. So far, this is the case.
They want a retest of the August high, even if it only forms a lower high.
They must create follow-through buying above the 20-day EMA to increase the odds of the market trading higher.
The bears got a deep pullback and a breakout below the tight trading range (Sep 23), but the move lacked sustained follow-through selling.
They then got a small second leg sideways to down leg to retest the Sept 23 low, and the move formed a higher low (Sep 30) so far.
They see the current move as a pullback and want the 20-day EMA to act as resistance. They want the market to form a double top bear flag with the Sept 26 high.
They need to create strong follow-through selling below the 20-day EMA to increase the odds of a reversal.
Production for Oct should be down.
Refineries' appetite to buy remains decent.
Export: Oct export remains to be seen.
For today (Thursday, Oct 2), traders will see if the bulls can create more follow-through buying, closing above the 20-day EMA.
Or will the market test near the 20-day EMA but stall and trade lower instead?
Andrew

1/10/25 Can Bears Get More FT Selling or Start to Stall?
Tuesday’s candlestick (Sept 30) was a bear bar closing in its lower half with a prominent tail below.
In our last report, we stated that traders would observe whether the bears could create strong follow-through selling, testing near the Sept 23 low, or if the move would lack follow-through selling and instead be followed by a reversal above the 20-day EMA.
The market continues to trade slightly lower, and the bears got some follow-through selling.
The bulls view the recent move (Sep 23) as a deeper two-legged pullback and want a reversal from a large double bottom bull flag (Aug 29 and Sep 23).
They want the pullback to lack follow-through selling, forming a higher low.
They see the current move (Sept 30) as a retest of the prior low (Sep 23), and want it to form a higher low.
They want a retest of the August high, even if it only forms a lower high.
They must create follow-through buying above the 20-day EMA to increase the odds of the market trading higher.
The bears got a deep pullback and a breakout below the tight trading range, but the move lacked sustained follow-through selling.
They want at least a small second leg sideways to down leg to retest the Sept 23 low.
So far, the second leg sideways to down is still a higher low (Sep 30).
They need to create strong follow-through selling to increase the odds of retesting the Sept 23 low.
Production for Oct should be down.
Refineries' appetite to buy remains decent.
Export: Sept: export +9% per ITS.
The monthly candlestick closed as a bear bar in its lower half with a prominent tail below.
There is a 5-bar bull microchannel on the monthly candlestick indicating persistent buying. There may be buyers below the first pullback.
For tomorrow (Wednesday, Oct 1), traders will see if the bears can create more follow-through selling testing near the Sept 23 low.
Or will the move start to stall at a higher low, followed by a reversal above the 20-day EMA in the weeks ahead instead?
Andrew
