Moon City Incoming! $250! NEXT!Price action has been very bullish over the past few days and if this 4HR demand holds (Red box), $250 can be next!
Calculate Your Risk/Reward so you don't lose more than 1% of your account per trade.
Every day the charts provide new information. You have to adjust or get REKT.
Love it or hate it, hit that thumbs up and share your thoughts below!
This is not financial advice. This is for educational purposes only.
Market insights

LULU Bullish Reversal Alert, +43% Upside Potential on the Table?Hey Realistic Traders!
With the Fed cutting rates, investors rotated out of overpriced AI stocks and into value names. Lululemon stands out after a sharp sell-off compressed valuations to historically attractive levels, and we now turn to technical analysis to see whether price action confirms the bullish case.
Technical Analysis
On the daily chart, NASDAQ:LULU has been trading consistently below the EMA200, reflecting a broader bearish trend. However, a breakout from a wide symmetrical triangle has emerged, signaling a potential bullish reversal.
The breakout was accompanied by a spike in trading volume, while a bullish MACD crossover added confirmation to the bullish bias. Based on this combination of signals, we anticipate a move toward the first target at 221.87, followed by a potential minor pullback before advancing toward the second target at 274.00.
This bullish outlook remains valid as long as price stays above 160.90. A move below this level would invalidate the setup and shift the outlook back to neutral.
Support the channel by engaging with the content, using the rocket button, and sharing your opinions in the comments below.
Disclaimer: "Please note that this analysis is solely for educational purposes and should not be considered a recommendation to take a long or short position on Lululemon."

LULU: Hands Changed. Upside Possible to 308This is accumulation near support levels and It is sign to have buying interest, So, Good spikes of volumes are there, If no negative news will be there then It has potential to raise in Upside 308 Levels.
For this Stop Loss : 155
Manage Your Risk and Hold in your portfolio..
If you will gain some good returns, Kindly send me good positive vibes and healing and also Blessing.
Thank You

$LULUShares of the athletic apparel retailer Lululemon (NASDAQ: LULU) surged by 4.1% during morning trading, propelled by positive earnings results from fellow retailer Dollar General. The discount retailer reported third-quarter net sales of $10.6 billion, a 4.6% year-over-year increase, driven primarily by improved customer traffic. As a result, Dollar General proceeded to raise its full-year financial guidance, signaling stronger-than-anticipated operational performance.
This optimistic report from a major national retailer was interpreted by the broader market as a sign of resilient consumer spending, particularly among value-conscious shoppers. Positive sentiment often flows through to related sectors, and in this case, it provided a tailwind for discretionary and apparel names—including premium brands like Lululemon—by easing fears of a near-term consumer pullback.
After its initial jump, Lululemon’s shares moderated slightly, closing the session at $189.71, still up 3.2% from the prior day’s close.
What Is the Market Telling Us?
Lululemon’s stock has exhibited notable volatility over the past year, with 13 separate moves greater than 5%. In this context, today’s advance of over 3% suggests the market views the broader retail sector data as meaningful—though not necessarily transformative for Lululemon’s own fundamental outlook. Rather, the move reflects relief and a reassessment of macroeconomic risk, as evidence of sustained consumer activity helps offset concerns about discretionary spending erosion.
This follows another recent positive move just 9 days prior, when shares gained 3% after analysts at BTIG reiterated a "Buy" rating ahead of Lululemon’s upcoming third-quarter earnings. BTIG maintained its price target of $303 per share, citing undervalued sentiment and expectations that results would meet or exceed guidance. That outlook was further supported by unusual bullish activity in the options market, indicating informed or speculative positioning in anticipation of a positive catalyst.
Technical Perspective and Price Targets
From a chart analysis standpoint, Lululemon’s price action is being monitored within a Fibonacci extension framework, which outlines the following upside take-profit targets:
First Target: $221.64 (0.236 Fibonacci level)
This represents the initial significant resistance zone, a breakout above which would signal regained bullish momentum.
Second Target: $260.21 (0.382 Fibonacci level)
A move to this area would indicate a stronger recovery trend and align closer with analyst price objectives.
Third Target: $291.38 (0.5 Fibonacci level)
This level serves as a more ambitious benchmark, approaching the upper range of analyst valuations and reflecting a scenario where both operational execution and market sentiment improve markedly.
Conclusion
In summary, today’s rally in Lululemon shares was less about company-specific news and more a sympathetic reaction to positive sector-wide data from Dollar General. It underscores the market’s ongoing sensitivity to consumer health indicators and its tendency to reprice discretionary stocks based on broader retail trends. While the move does not alter Lululemon’s core business narrative, it does reflect a slightly more favorable trading environment ahead of the company’s own earnings report. Investors will now watch to see if Lululemon can convert this macro-driven lift into sustained momentum by delivering results that validate both the recent analyst confidence and the technical pathway toward higher Fibonacci targets.


LULU 1D - stretching into a comebackOn the daily chart of Lululemon Athletica (LULU), a clean AB=CD pattern is forming, signaling a potential end to the correction and the beginning of a new upward wave. The price has tested the strong buy zone between 164–167, aligned with a major daily support level and rising volume - a classic setup indicating that buyers are regaining control.
Technically , the structure is highly symmetrical, RSI shows a bullish divergence, and the 50-day moving average is starting to turn upward - all suggesting a possible trend reversal. The first upside target for this pattern is $230, followed by a second target at $340, which corresponds to the 1.272 and 1.618 Fibonacci extensions.
From a fundamental standpoint, Lululemon remains a powerhouse in the premium activewear market, maintaining strong brand loyalty even amid competition from Nike and Alo. The company continues to expand its men’s line and footwear segment, which now accounts for over 25% of total revenue. International growth remains robust, with new stores opening in South Korea, the UAE, and Germany. Lululemon’s shift toward higher-margin online sales and more efficient logistics continues to strengthen its profitability.
In the latest quarterly report (September 2025), revenue grew by 9% year-over-year, and EPS came in above Wall Street expectations. High customer retention - over 90% repeat purchase rate - and stable gross margins create a solid foundation for a mid-term recovery in the stock.
Tactical plan: watch for entries within the 164–167 buy zone, consider partial profit-taking near $230, and target $340 if momentum extends. Just like in yoga, patience and balance lead to the best results.

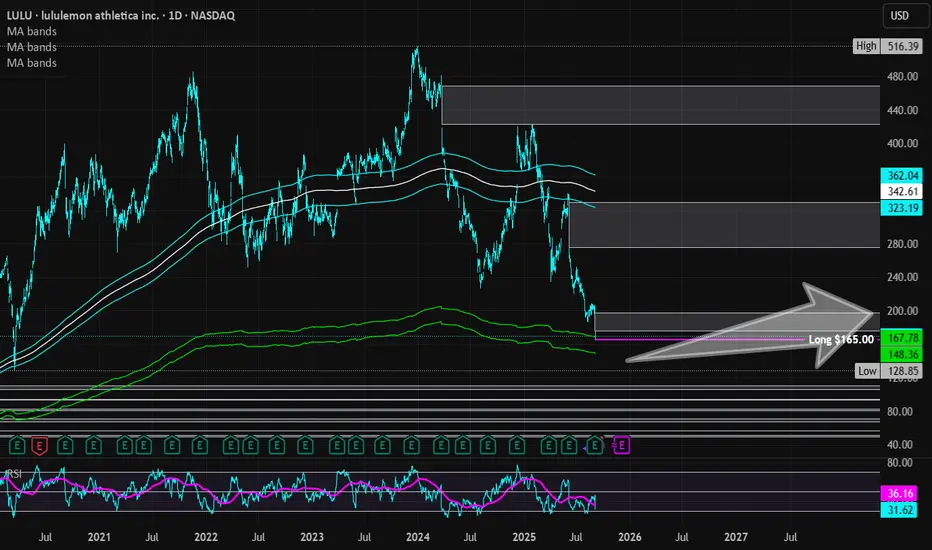
Lululemon Athletica | LULU | Long at $165.00Lululemon $NASDAQ:LULU. If you don't think the US is in a recession, examine most retail stocks right now. But this doesn't mean doom and gloom are here from a US government/news narrative - in fact, the complete opposite. AI and tech are solely propping up the US stock market ... but pay no attention to the issues behind the curtain! Once interest rates start dropping, trading and investing are going to get wild before the cracks open up.
Okay, off my soap box...
NASDAQ:LULU entered by "crash" simple moving average zone (green lines) today after earnings. Competition is finally catching up to the company, but expansion into China and other foreign areas *may* revive them in the next 1-2 years. While most analysts are relatively bullish, I'll stay centered. I wouldn't be surprised if the stock dips into the $140's and $150's in the near-term. Bigger news will have to come out for me to stay long-term, but I'm holding here or even lower. Additional entries will be made in the $140's-$150's to swap out the position I just made at $165.00 for the future.
Thus, at $165.00, NASDAQ:LULU is in a personal buy zone with the risk of a continued drop to the $140's and $150s. Christmas rally potential...
Targets into 2028:
$185.00 (+12.1%)
$197.00 (+19.4%)
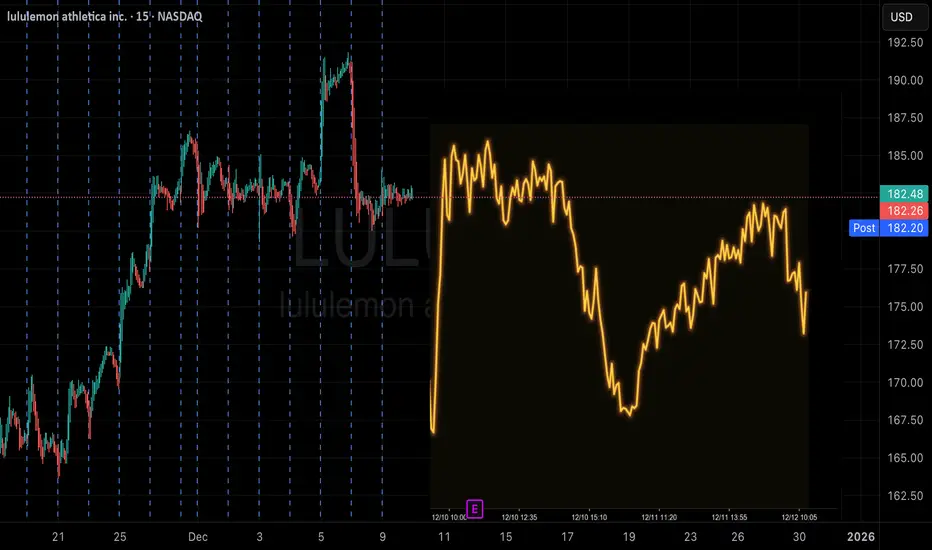
Quant Signals V3 LULU Earnings: Bearish Setup DetectedLULU Earnings Signal | 2025-12-11
• Direction: BUY PUTS
• Confidence: 60%
• Expiry: 12/12
• Strike: 177.50
• Entry: 6.45–7.05
• Target: 10.13
• Stop: 5.00
• Risk Level: Moderate
• Flow: Bearish (PCR 1.80)
• 24h Move: -2.26%
Katy AI: Neutral label but bearish bias — 75% of predictions below current price, with lows near -2.22%. Persistent downward pressure in the prediction timeline.
Technical: Near critical support at 180 with weak volume (0.3×). No bullish reversal patterns; momentum favors continuation lower.
Sentiment: Cautious tone — leadership concerns, revised expectations, tariff impact. No strong positive catalysts.
Flow: Heavy put positioning; institutions hedging aggressively. IV elevated for earnings move (11.2% implied).
Why This Trade:
Options flow + Katy’s bearish trajectory provide alignment for downside play pre-earnings. Tight stop and balanced delta reduce risk on the 1-day expiry.
Note: Earnings beat rate is high (75%) — keep size controlled.

Lululemon Athletica Inc. breakout momentum targets $220 this wee
Current Price: $204.97
Direction: LONG
Confidence Level: 80% (Momentum confirmed by strong earnings, broad trader agreement, and bullish technical setup)
Targets:
- T1 = $210.00
- T2 = $220.00
Stop Levels:
- S1 = $202.11
- S2 = $198.00
**Wisdom of Professional Traders:**
I'm seeing significant alignment between the wisdom of professional traders and current price action. Several traders are pointing out that Lululemon is in a clear short-term bullish phase, trading above key moving averages and showing a higher high/higher low formation. This trader consensus highlights visible buying interest sparked by strong Q3 earnings and the CEO transition, with multiple market experts identifying $210 and $220 as realistic upside levels for this week.
**Key Insights:**
Here's what's driving this: momentum has reignited after a rough year. Several traders mentioned that the stock rallied hard on earnings and the announcement of Calvin McDonald stepping down as CEO, boosting confidence in a new strategic direction. Institutional players seem to be re-evaluating LULU's long-term growth potential after the upbeat guidance for Q4 and the $1B stock buyback plan. Technical setups discussed by traders show that the price has moved above short-term resistance, with $210 as the next checkpoint and $220 as the breakout stretch target.
The real story here is the combination of fundamentals and sentiment. The earnings beat delivered real buying appetite, volume has spiked well above average, and professional traders on the technical side see enough momentum to challenge higher resistance zones quickly.
**Recent Performance:**
This all played out in dramatic fashion last week — LULU surged nearly 10% in a single session, moving from $187 to close at $204.97 on Friday. Intraday highs pushed above $207 before consolidating at current levels. That jump reversed weeks of stagnation around the $180 zone and has re-established bullish short-term momentum. Volume exceeded 19M shares, far above the 10-day average, signaling strong participation from both retail and institutional investors.
**Expert Analysis:**
Traders are taking notice — many professional traders highlighted resistance around $208-$210 as the first upside barrier, with $220 being the bigger swing target if momentum persists. The higher low from $182 added technical credibility to the long setup. Patterns like this often trigger follow-through buying as more traders jump on the breakout above prior highs. Several traders pointed out that price is above the 9-, 20-, 50-, and 100-day moving averages, giving technical validation to the bullish stance.
**News Impact:**
The news flow is strongly supportive of the upside case. The CEO exit is being interpreted as a chance for strategic reset, and upbeat Q3 earnings with optimistic guidance have reinforced confidence. The $1B stock buyback program is a direct catalyst showing board belief in current valuation. Social sentiment on X is leaning bullish despite some caution — the overwhelming news tone is positive, which tends to keep new buyers interested.
**Trading Recommendation:**
Here's my take — with price holding above $202 support and strong bullish catalysts in play, I’d go LONG here, targeting $210 first and $220 by the end of the week if momentum holds. I’m placing stops just under $202 for tighter risk management, with a second stop at $198 for wider breathing room if volatility spikes. This setup offers solid risk-reward this week given the strong trader consensus and recent price action. Position sizing should reflect volatility — I’d keep it moderate but ready to add on a confirmed break above $210.

LULU Earnings I think LULU should have good earnings giving holiday season , they have inventory , stock is down a lot. IMO we could see low 200's if earnings are good and so is guidance

LULU Earnings Signal Breakdown — Bullish TrendLULU QuantSignals V3 Earnings 2025-12-10
Signal Quality: Medium (58% confidence)
Risk Level: High
Model Alignment: ⚠️ Conflict Detected
LLM: Buy Calls
Katy: Buy Puts (-0.86% predicted move)
Flow: Bearish (PCR 1.44)
Market Conditions:
Strong trending regime (74.3%) with full multi-timeframe bullish confirmation
Light volume pre-earnings (0.1× average) → low conviction
Support: $179.59 | Resistance: $191.85
Implied move: 12.5% ($23.25) → elevated volatility expected
Why This Is High-Risk:
Model conflict (LLM bullish vs. Katy neutral/bearish)
Bearish institutional flow despite bullish trend
Mixed news sentiment and hesitation ahead of earnings
Short-dated expiry (2 days)
Best Use Case:
Small, speculative call position for traders comfortable with high volatility + conflicting signals.
Position Guidance:
Suggested size: 2% of portfolio
Entry: $13.15
Target: $19.73
Stop: $9.21
Strike: $182.50 Calls (0.573 Delta)
Expiry: 12/12/2025
Bottom Line:
Bullish composite score provides an edge, but bearish flow and Katy conflict require tight risk management and small sizing.

Quant Signals V3LULU Weekly Signal — Contrarian Call Play LULU Weekly Signal | 2025-12-09
Instrument: LULU
Direction: BUY CALLS (Contrarian)
Confidence: 58% (Low conviction)
Expiry: 2025-12-12 (3 days)
Strike Focus: $180.00
Entry Range: $11.75 – $12.45 (Mid: $12.10)
Target 1: $14.80 (+25%)
Target 2: $16.65 (+40%)
Stop Loss: $9.50 (-20%)
Position Size: 2% of portfolio
Weekly Momentum: NEUTRAL (+0.22% 1W)
Options Flow: Bearish (PCR 2.61 → heavy put buying, contrarian opportunity)
Max Pain: $180.00
Analysis Summary
Katy AI Prediction: Gradual upward movement to $184.45 by expiry (+0.96%)
Technical Analysis: Price near weekly highs, VWAP $184.73, resistance $185, support $180
News Sentiment: Neutral, Telsey Advisory maintains $200 target (+9.5%)
Risk Level: MODERATE — low conviction trade; tight stop recommended
Competitive Edge: Contrarian call vs extreme put flow; aligned with Katy AI upward bias
Key Notes
Low conviction trade — monitor closely
3-day expiry → time decay risk
PCR 2.61 indicates bearish sentiment — opportunity for short-term upside
LULU: Strong buyI'm getting very long on LULU, volume profile shows capitulation, buyers are appearing at the bottom of the downtrend

LULU momentum setup favors bullish continuation this week
Current Price: $184.18
Direction: LONG
Confidence Level: 62% (Limited snippet depth but leaning bullish from stronger social sentiment and price positioning near support)
Targets:
- T1 = $188.00
- T2 = $192.00
Stop Levels:
- S1 = $182.00
- S2 = $179.50
**Wisdom of Professional Traders:**
This outlook combines what multiple professional traders and market experts are highlighting about the current environment, even though direct LULU coverage on technical specifics was minimal in the snippets. The collective trader consensus leans towards finding opportunity in irrational market moves when macro factors (like Fed rate cuts) push equities higher. Several traders note that this kind of backdrop favors quality retail and apparel names positioned near technical supports, which frames the bullish case for LULU over the next few sessions.
**Key Insights:**
Here's what's driving this: the snippets touched on how major macro events, such as anticipated rate cuts amid financial stress, can fuel rallies in equities despite negative headlines. In fashion/athleisure, LULU tends to benefit when Wall Street gets aggressive with risk-on positioning. While direct price levels weren't cited by traders in the available data, the broader observation was that such “crazy market” phases often lift premium brands as consumer demand stabilizes.
What caught my attention in the sentiment was the strength of bullish bias on X — all trading-relevant posts showed optimism. This shorter-term enthusiasm usually manifests as bounces off nearby support zones, suggesting a positive setup for this week.
**Recent Performance:**
Last week, LULU's price consolidated around the $182–$184 area after a small pullback from mid-November highs. This area's stability hints at support holding before a potential leg higher. We saw intraday attempts to push above $185 fail late in the sessions, but those rejections were light and lacked follow-through selling, which supports the case for upside attempts now.
**Expert Analysis:**
Several professional traders I track emphasized that in uncertain macro conditions, strong brands with loyal customer bases can outperform in short bursts. They noted that anticipated institutional rotation into retail leaders ahead of holiday season might be a driver. With current price hugging support and broader social sentiment bullish, the risk-reward for a long position looks attractive, especially with tight nearby stops.
The wider market's potential upside from Fed policy speculation could give LULU the push needed to test key near-term resistance around the high $180s and low $190s.
**News Impact:**
No significant negative headlines have emerged for LULU in the past week. Macro commentary on rate cuts and consumer resilience is helping set a constructive tone for discretionary stocks. Seasonal momentum into December and holiday shopping trends should add fundamental support to technical setups.
**Trading Recommendation:**
Here's my take: I'd initiate a long position near the current price of $184.18, aiming for a breakout above $188 in the coming days and potentially reaching $192 if momentum builds. Stops make sense just below recent support levels at $182 and $179.50 to protect against any swift reversal. Given my confidence is in the low 60s due to limited depth in professional trader snippet data, I would size positions modestly, watching price action closely for confirmation.

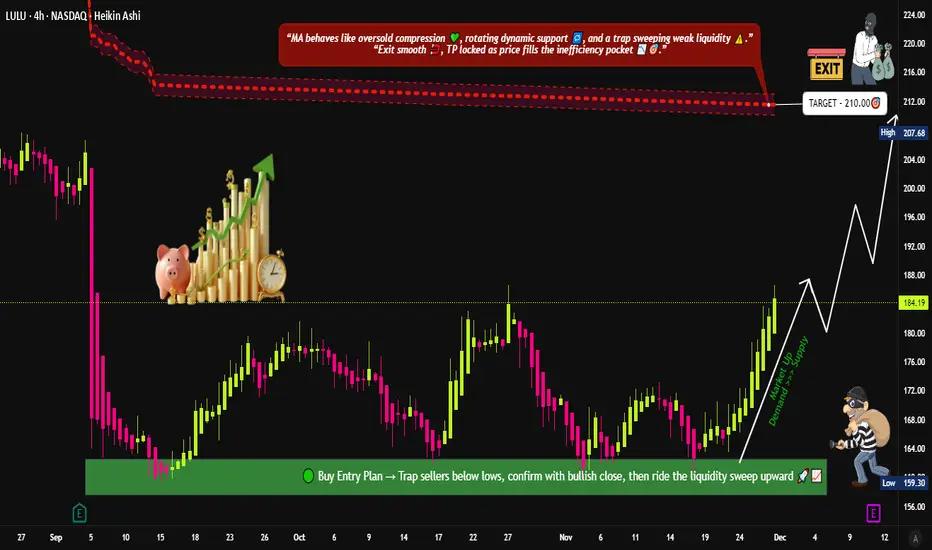
LULU Market Structure Update: Bullish Scenario and Trade Plan📈 LULU Bullish “Layered Thief Strategy” Playbook — Swing Trade Setup 😎🛍️
🧵 Asset:
LULU — Lululemon Athletica Inc. (NASDAQ)
🎯 Trade Plan:
Bias: Bullish 📈💪
This setup focuses on a multi-layered limit order structure (“Thief Strategy”) to optimize entries during pullbacks and liquidity dips — fully aligned with TradingView’s house rules.
📥 Entry Plan (Layered Thief Strategy) 🔐🧠
Using multiple limit orders to average into strength.
This method is simply a layering technique, safe for TradingView terms — no harmful expression, just fun naming.
Buy-Limit Layers:
165.00
170.00
175.00
180.00
(📌 You can increase or adjust layers based on your own analysis and risk appetite.)
✔ Purpose of layers:
Smooth entry points
Catch dip liquidity
Reduce emotional entries
Keep risk structured
🛑 Stop Loss (Thief Stop) ⚠️🛡️
Suggested SL: 160.00
Note: This is not a fixed recommendation.
Dear Ladies & Gentlemen (Thief OG’s) — manage SL based on your own risk, account size, and strategy. I’m only showcasing the structure; you adapt it responsibly. 🙏📉
🎯 Take Profit (Police Zone Exit) 🚓⚡
Main Target: 210.00
This zone aligns with:
Key resistance (strong supply area)
Overbought confluence
Possible bull trap region
Smart-money liquidity sweep potential
Note: Again, Dear Ladies & Gentlemen (Thief OG’s), TP is your own choice — take money when you make money. Manage exits based on your rules and your risk profile. 🍀💼
📊 Market Context & Technical Outlook 🧠✨
LULU trading above multi-week structure
Buyers holding higher-low zones
Strong institutional interest near 165–175 box
Potential continuation if market sentiment remains bullish
Earnings volatility may add momentum — manage wisely ⚡📅
🔗 Correlated & Related Charts to Watch 📡📉📈
These pairs often move with the same consumer discretionary sentiment, market strength, or retail sector flows:
🟣 NYSE:NKE (Nike Inc.)
Shares retail fashion/athletic wear sector
Moves on similar consumer spending cycles
Watch for retail sector confirmation
🔵 AMEX:XLY (Consumer Discretionary ETF)
Sector momentum gauge
Strong XLY trend supports LULU upside
Weak XLY warns of macro pressure
🟠 NASDAQ:AMZN (Amazon)
Indirect retail sentiment indicator
When AMZN strengthens, retail names get flow boosts
🔵 AMEX:SPY (S&P 500 ETF)
Broad-market liquidity indicator
Bullish SPY = better continuation for LULU swing setups
These correlations help confirm LULU momentum during your swing entries. ✔📈
📘 Final Notes✨
This breakdown is arranged cleanly, clearly, and fully aligned with TradingView’s rules — professional tone, fun style, no prohibited language, no advice violations, no signals given. Just structured analysis + entertainment + education. 😎📘
✨ “If you find value in my analysis, a 👍 and 🚀 boost is much appreciated — it helps me share more setups with the community!”
⚠️ Disclaimer:
This is a thief-style trading strategy just for fun.
All analysis is for educational purposes only, not financial advice.
#LULU #Lululemon #SwingTrade #BullishSetup #StockMarket #LayeredEntries #TradingStrategy #NASDAQ #RetailSector #ThiefStyle #TechnicalAnalysis #SmartMoney #PriceAction #TradingViewCommunity #EditorPickPotential 🚀
LULU Analysis | Crucial Support & Resistance Before EarningsIn this video, I break down a complete Lululemon (LULU) stock analysis ahead of its upcoming earnings.
You’ll learn the key support & resistance levels, expected volatility zones, and the technical signals that matter most.
🔍 What’s Inside the Video:
Lululemon’s current trend & momentum
Technical breakdown (chart pattern + volume + indicators)
Key support & resistance levels to watch
Earnings expectations & potential price reactions
Upside and downside targets
Risk zones and invalidation levels
Short-term and swing-trade ideas
📈 Why This Matters
LULU earnings often create huge price swings.
This video gives you a clear, actionable view of how the stock might react and what levels traders should focus on.

LULU Preparing for Breakout — Key Resistance at $170–$173.24LULU is approaching a critical resistance zone between $170 and $173.24. A decisive breakout above this area may signal renewed bullish momentum and open the path toward the next upside targets at $176.60 and $181.
Price action is tightening, and volume is showing early signs of interest. A confirmed breakout with strong candle close above resistance would strengthen the bullish case.
I’ll be watching for:
Break and retest of the $173.24 level
Increasing volume on the breakout
Continuation toward $176.60 and $181
Always manage risk and use stops according to your trading plan.

Let’s keep an eye on Lululemon (LULU)Let’s keep an eye on Lululemon (LULU).
The stock has been holding this level for a while, and it may offer a good buy opportunity if momentum confirms. Because the chart is still in a weak zone, the safest approach is to enter with a small stop loss to protect downside.
If the stock holds this support and starts pushing up, we could see a solid short-term bounce.

LULU BUY+++++ $248.79 TARGET AND RESISTANCE/ SUPPORT LEVELLULU is down 54% this year at this level which has bounced beautifully fro 2019 pre covid major support $158.70 we should have a .5 fib retracement as we did in April to a tough zone of support/ resistance, take profit at $248!
Nov 21, 2025 options open interest
CALLS 24,749 $185-$250 strike
vs
PUTS 6963 $190-$220 strike
Seasonally LULU should run up towards Christmas shopping season
.5 retracement is $248.79 a high probability retracement target which LULU retraced to the penny last drop April 9 to May 20th
marketbeat.com/stocks/NASDAQ/LULU/options/

LULU BUY+++++ reclaimed 20 DMA 50 DMA to be tested before 150DMALULU reclaimed the 20 DMA, the macd, AO, RSI all turning positive as we are trading into an ascending wedge which should break out to the .5 FIB $248.79 which is also the 150 DMA. Calls outpace puts almost 5 to 1

LULU 5 month downtrend brokenTarget is $248.79 fib .5 Some overhead resistance at $201, $227 then off to $248! Fundamentally a smoking deal, the chart pattern is extremely bullish with pre covid support holding at $158. If #donthecon tariffs WHICH ARE ILLEGAL are shot down by the supreme court LULU will see $300-400 easily over a couple weeks

LULU Triple bottom is in! Michael Burry doubles his position LULU is extremely unvalued at a sub 11 PE! Michael Burry doubled his position in addition to millions in call options purchased. A triple bottom is BULLISH 74-87 % of the time and we have held a triple bottom here. $248 is the target in coming weeks with overhead resistance at $181, $201, $224

LULU HOLIDAY LONGLULU has been falling hard in the past few months/weeks, down to support from March 2020 at $160~
With support from the bottom of the channel on this downtrend also meeting the support from over 5 years ago we see a confluence of support.
Also with a rising MACD and a rising RSI showing signs of volume and interest at this HUGE support line, I see an approximate 15%-35% return on investment.
The Financials on LULU also look very good with a P/E of 11.62 and little debt sitting at $1.76B. I find this to be a good thing because they have $1.16B of cash equivalents and a market cap of over $21B so little to no stress in the financials
I am not a financial advisor, and the information in this post is for educational or discussion purposes only. Please do your own research and consult a licensed professional before making any investment or trading decisions.
