US NAS 100Preferably suitable for scalping and accurate as long as you watch carefully the price action with the drawn areas.
With your likes and comments, you give me enough energy to provide the best analysis on an ongoing basis.
And if you needed any analysis that was not on the page, you can ask me with a comment or a personal message.
Enjoy Trading ;)
NDX trade ideas

US100: Short setup using fib levels from flash candleIG:NASDAQ m30 chart analysis: short action!!
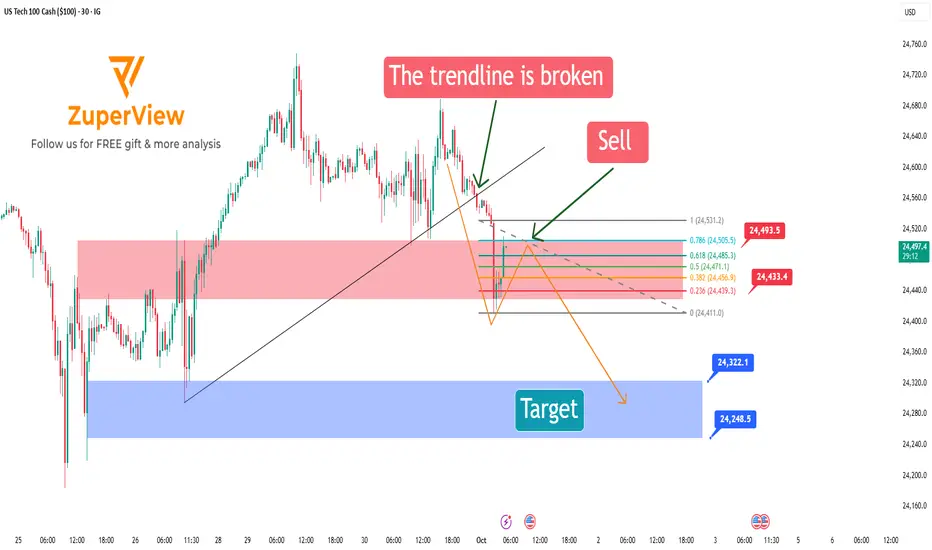
The chart signals a potential short opportunity after breaking the previous bullish structure and printing a strong bearish flash candle. The strategy focuses on shorting the pullback using fibonacci retracement measured from that candle.
🔺 1. Structure break and flash candle confirmation
The price broke below the rising trendline supporting the bullish move from sep 26 to sep 30.
Immediately after, a large bearish flash candle appeared — signaling strong selling pressure and a potential trend reversal.
This candle becomes the reference point for measuring the retracement and anticipating a continuation to the downside.
📏 2. Measuring fibonacci from the flash candle (high → low)
Apply fibonacci from the high to the low of the flash candle.
This technique identifies potential resistance zones within the context of that specific bearish move.
Key fibonacci levels to watch:
0.5: 24,472.0 | 0.618: 24,486.4 | 0.786: 24,506.9
🎯 3. Ideal entry zone: from 0.382 to 0.786
After a strong bearish flash candle, price often pulls back moderately before continuing lower.
The optimal short zone is between fibo 0.382 and 0.786:
This respects the integrity of the bearish impulse.
A retracement smaller than 0.382 may be too shallow to confirm a strong rejection.
A retracement beyond 0.786 might indicate loss of bearish momentum and invalidate the flash candle setup.
🎯 4. Bearish scenario and targets
If price reacts at the 0.382–0.786 zone and resumes downtrend, a potential ABC bearish correction forms:
A: Flash move down
B: Pullback to fib zone
C: Next impulsive leg down
Suggested take-profit levels:
🎯 Target 1: 24,322.1
🎯 Target 2: 24,248.5
🛡️ Stop-loss: above the flash candle’s high (around 24,533)
✅ Summary
After a structure break and a decisive bearish flash candle, us tech 100 is showing a clear bearish setup.
Using fibonacci measured from the high to low of the flash candle helps identify high-probability pullback zones.
📌 Entry zone: between 0.382 and 0.786 retracement — outside this range, the flash candle's power may be invalidated.
This is a momentum-following trade with defined entry, stop loss, and take profit zones.
Wait for confirmation from price action within the fib levels before entering.
Please like and comment below to support our traders. Your reactions will motivate us to do more analysis in the future 🙏✨
Harry Andrew @ ZuperView
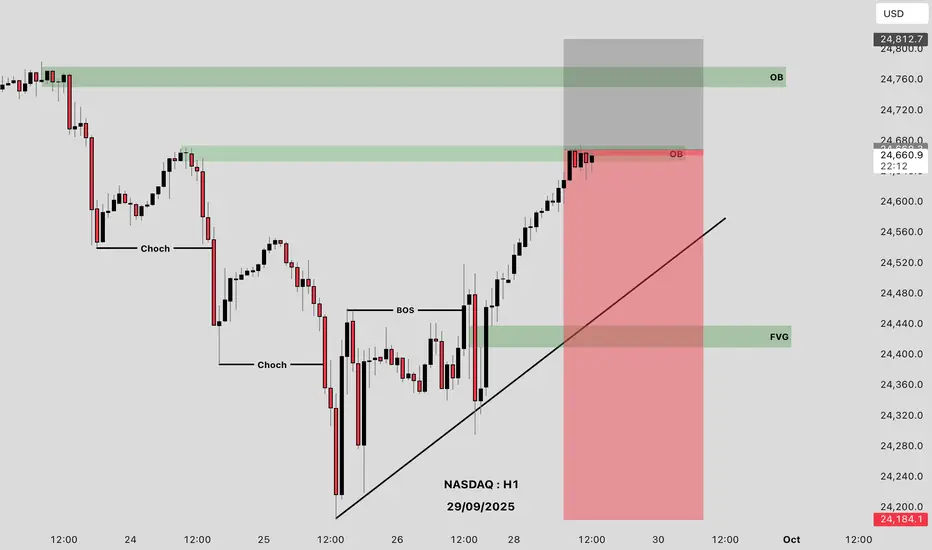
NASDAQ H1 OUTLOOKLets Nasdaq Sell
Reasons
Bearish Order Block
Who Is With Me Comment Your Opinion
Good Luck Guys
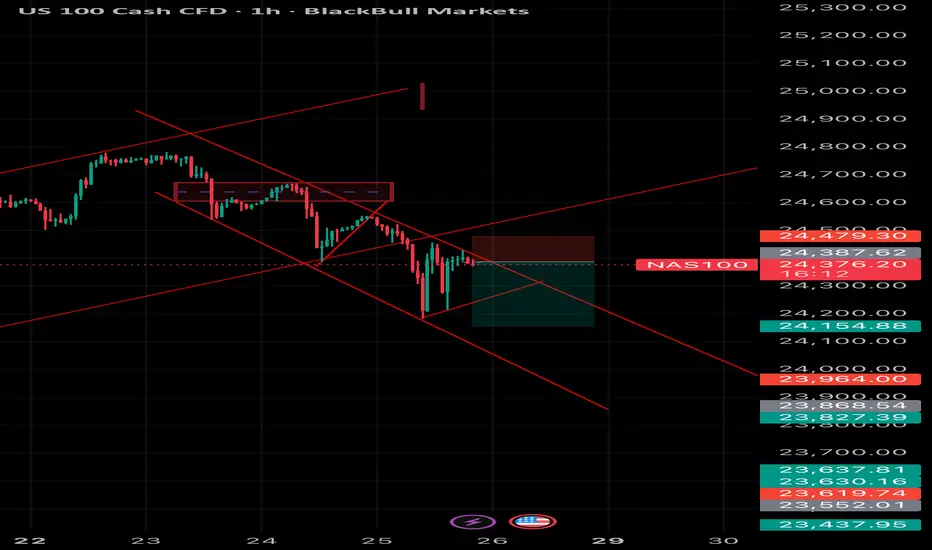
NAS100 Technical Analysis 1 Hour Chart📉 NAS100 Technical Analysis (1H Chart)
NAS100 is trading around 24,374 and continues to respect a strong descending channel, signaling bearish momentum.
• Trend: Price rejected the previous supply zone (24,470 – 24,500) and failed to break above resistance, confirming sellers are still in control.
• Entry Zone: The retest of broken support turned resistance around 24,387 – 24,479 shows bearish rejection with downside continuation likely.
• Target Levels:
• First target: 24,154 (mid-channel support)
• Next target zone: 23,960 – 23,827 (lower channel support)
• Invalidation: A clean 1H close above 24,500 would invalidate this bearish structure and could trigger a corrective move higher.
👉 Short-term bias remains bearish while under 24,500 with room for continuation toward 24,150 – 23,900.
NAS100 - TRADER EDGE
🎯 KEY PIVOT ZONE
🟧SUPPLY ZONE: 24,480 - 24,520
Multiple session POCs clustered in this range
Highest volume VRVP node concentration
Critical resistance where price is currently struggling
📊 PRICE TARGETS
UPSIDE TARGETS ⬆️
T1: 24,650 - 24,700
T2: 24,750 - 24,800
DOWNSIDE TARGETS ⬇️
T1: 24,350 - 24,400
T2: 24,250 - 24,300
⚡⚡ EDGE - HIGHEST PROBABILITY PLAY
Short from 24,480-24,520 supply zone targeting 24,350+ with stop above 24,550
🔍 KEY CONFIRMATION SIGNALS
✅ Rejection at current supply zone with volume
✅ Break below 24,450 support with momentum
✅ Volume expansion on downside moves
📈 TRADE SETUP
🔴PRIMARY BIAS: BEARISH
Short Setup from Supply Zone:
Entry: 24,480 - 24,520 (on rejection/weakness)
Stop Loss: Above 24,550
Target 1: 24,350 - 24,400
Target 2: 24,250 - 24,300
Risk/Reward: 1:4+ ratio
🔄 BIAS FLIP CONDITIONS
🟢TURNS BULLISH IF:
Clean break above 24,550 with strong volume
Hold above 24,520 on any pullback attempt
Volume expansion above pivot zone indicating fresh buying
⚡Then Target:
24,650 - 24,700 (first)
24,750 - 24,800 (extension)
⚠️ RISK MANAGEMENT
Max Risk: 40 points per position
Position Size: Adjust to 1-2% account risk
Time Stop: End of 4-hour session if no movement
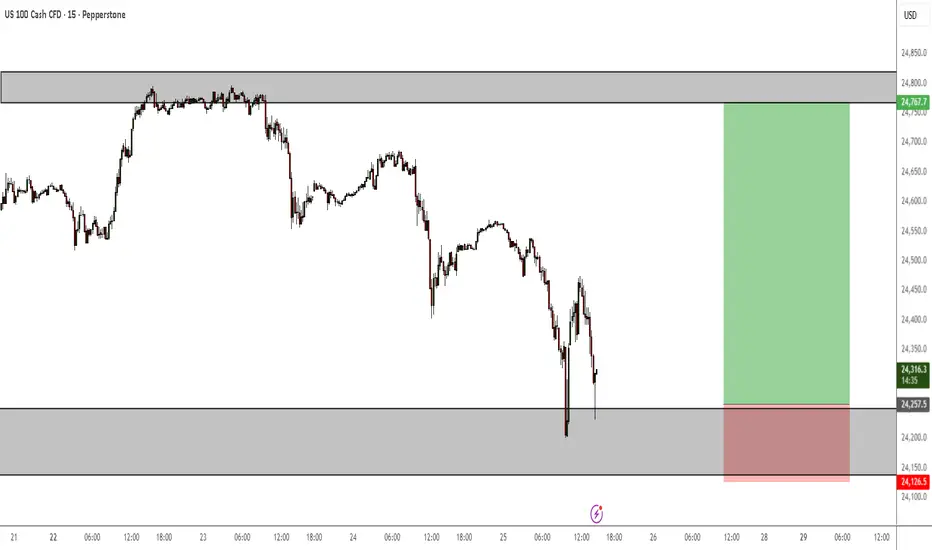
US100 M30 – Sideway at the Top - Short OpportunityThe CAPITALCOM:US100 index has experienced a strong upward move on the 30-minute chart, pushing price to a new high around the 24,800 – 24,850 zone. However, recently, price has been moving sideways within a narrow range, forming a consolidation phase near this key resistance area. This sideways action signals a potential short-term correction or trend reversal.
📉Technical Analysis:
Current Sideways Zone: Price is consolidating between approximately 24,800 and 24,850, repeatedly testing this resistance but failing to break through decisively.
Key Support Level: The 24,650 – 24,700 zone is acting as critical support, holding price during this consolidation.
Support Break Signal: A close below the 24,650 – 24,700 support range would confirm the start of a downtrend and signal a likely bearish move.
📊 Trading Plan
Sell on Support Break: If price closes below the 24,650 – 24,700 support zone, consider entering a short position targeting the next strong support area near 24,400 – 24,350 .
Sell on Retest of Sideways Zone:
After breaking support, if price pulls back to retest the sideways zone (24,800 – 24,850) and shows bearish rejection signals (e.g., pin bar, bearish engulfing), this provides a good opportunity to enter or add to short positions.
⚠️Risk Management:
Stop-loss: Place above the sideways resistance area, around 24,860 – 24,870 , to avoid false breakouts.
Take profit: Consider partial profit-taking near 24,650 – 24,700 and final targets around 24,400 – 24,350.
Wait for Confirmation: Avoid entering trades without clear support breaks or bearish rejection signals to minimize risk.
Please like and comment below to support our traders. Your reactions will motivate us to do more analysis in the future 🙏✨

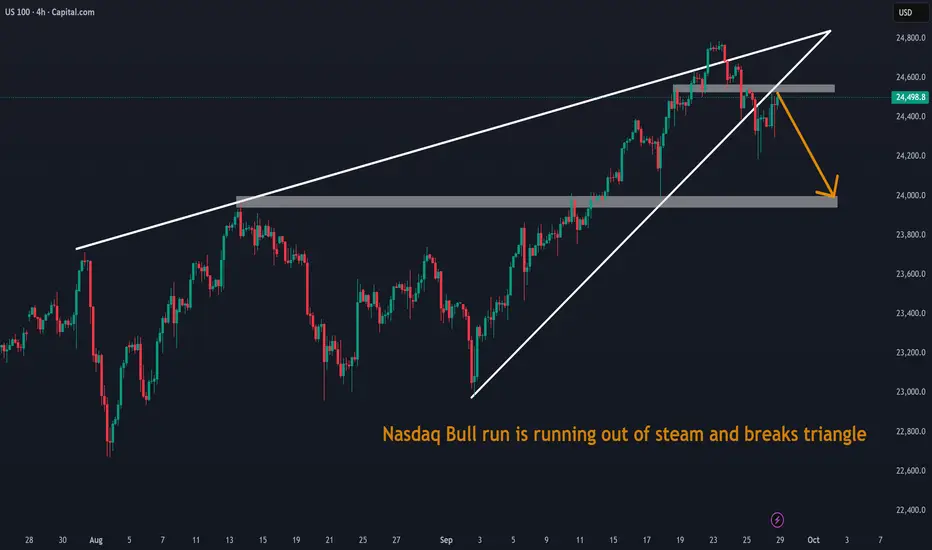
Nasdaq Bull run is running out of steam and breaks triangleNasdaq Bull run is running out of steam and breaks triangle.
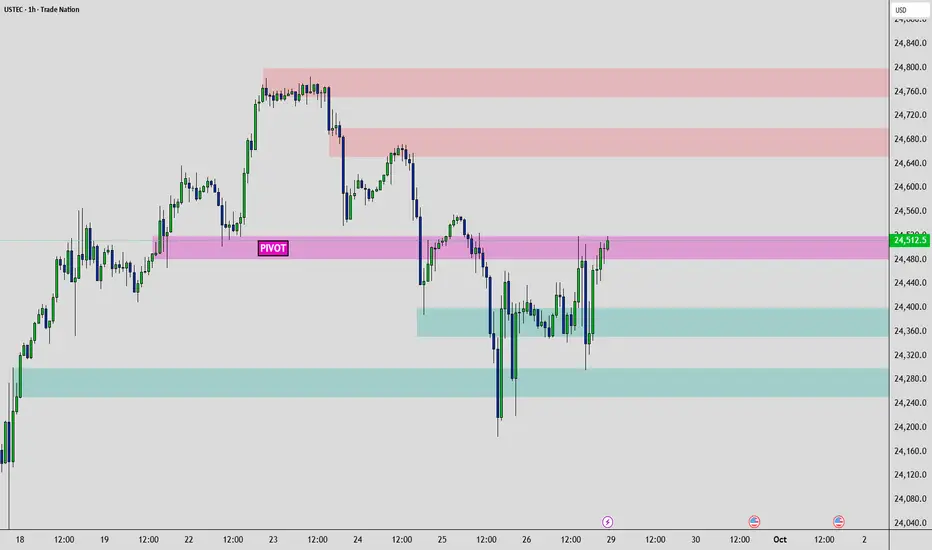
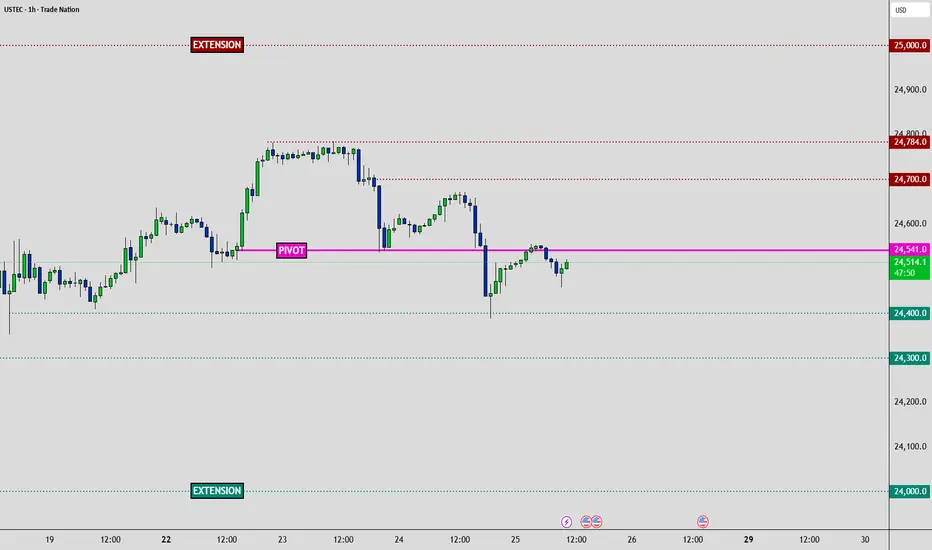
USTEC - 2 Day Traders Edge📈Technical:
MARKET BIAS: Neutral (consolidating at HVN pivot, high-rate sensitivity)
PIVOT ZONE: 24,541 (Exact HVN level)
🥇 Traders Edge - Actionable & Tactical
TRADE SETUPS:
🟧 Risk Warning: Core PCE surprise = 200+ point moves
🟧 Special Risk: High beta to rate moves via PCE
↕️ Bias Flip: Break below 24,400 (bearish) | above 24,700 (bullish)
🟢Long Setup:
• Entry above Pivot | Stop 24,450 | TP: 24,650 | 24,750 | 24,850 - Extended Breakout
🔴Short Setup:
• Entry below 24,400| Stop Above Pivot | TP: 24,300 | 24,000 - Extended Breakdown
🎯KEY LEVELS:
• Strong Resistance: 24,700 | 24,784
• Strong Support: 24,400 | 24,300 | 24,100 | 24,000
🎯PRICE TARGETS:
• Bullish Path: 24,700 → 24,784 → 25,000 (Extended breakout)
• Bearish Path: 24,400 → 24,300 → 24,000 (Extended breakdown)
🚨HIGH-IMPACT EVENTS (48H): (NY Time Zone)
• Sep 25 | 08:30 GDP Q2 Final: 3.3% vs -0.5% → Growth supports tech multiples
• Sep 26 | 08:30 Core PCE MoM: 0.2% vs 0.3% → TECH RATE SENSITIVITY
• Sep 26 | 08:30 Personal Spending: 0.5% vs 0.5% → Tech demand proxy
• Sep 26 | 10:00 Michigan Sentiment: 55.4 → Growth stock appetite
🛑 MASTER RISK EVENT
🟧Friday September 26 | 08:30 (NY Time Zone)
🟧 Core PCE Price Index (MoM) - Forecast: 0.2% vs Previous: 0.3%
🟧 Critical Impact: Fed's preferred inflation gauge determines rate path and USD strength
• Gold: Collapse risk if hot print
• Equities: Rate repricing volatility
• Sectors: Tech rotation sensitivity
⚠️ RISK MANAGEMENT PROTOCOL
• Reduce position sizes before Friday 08:30 EDT
• USD strength reversals impact Gold heavily
• Tech high beta to rate repricing
• Month-end flows amplify volatility
________________________________________
Analysis based on Session Volume POC clusters and HVN methodology
NAS100 - TRADER EDGE🎯 KEY PIVOT ZONE
SUPPLY ZONE: 24,580-24,620
➡️3 POC lines cluster with dense VRVP node creating resistance ceiling
➡️High-volume consolidation area with multiple rejections
➡️Price currently AT pivot zone - decision point
📊 PRICE TARGETS-
UPSIDE TARGETS ⬆️
T1: 24,680-24,710
T2: 24,740-24,780
DOWNSIDE TARGETS ⬇️
T1: 24,400-24,440
T2: 24,280-24,320
⚡💎⚡ EDGE - HIGHEST PROBABILITY PLAY
Short from 24,580-24,620 rejection targeting 24,400-24,440 then 24,280-24,320
🔍 PRE-ENTRY CONFIRMATION SIGNALS
✅ Price reaches 24,590+ with bearish rejection candlestick (long wick/engulfing)
✅ Lower high formation below 24,620 with momentum shift
✅ Volume spike on rejection candle confirming seller presence
📈 TRADE SETUP
🔴PRIMARY BIAS: BEARISH
Short Setup:
Entry: 24,590-24,610 after confirmations
Stop Loss: 24,655
🎯Target 1: 24,400-24,440
🎯Target 2: 24,280-24,320
Risk/Reward: 1:3.3 / 1:6.2
🔄 BIAS FLIP CONDITIONS
🟢TURNS BULLISH IF:
Clean break and 2H close above 24,630
Volume expansion on breakout (1.5x average)
Retest of 24,600-24,620 holds as support
Then Target:
🎯24,680-24,710
🎯24,740-24,780
⚠️ RISK MANAGEMENT
Max Risk: 60 points per contract
Position Size: Risk 1-2% account per trade
Time Stop: Only trade within NYSE's peak volume segments

NASDAQ100 HIGH PROBABILITY SETUP SOON!!!🚨 NAS100 HIGH PROBABILITY BUY SETUP 🚨
* Here We Can See Clearly The Next Potential Moves For US100 Coming Hours/Days.
* Keep Your Eyes Close On Your Trading Positions.
* Happy PIP Hunting Traders.
FXKILLA.

US NAS100Preferably suitable for scalping and accurate as long as you watch carefully the price action with the drawn areas.
With your likes and comments, you give me enough energy to provide the best analysis on an ongoing basis.
And if you needed any analysis that was not on the page, you can ask me with a comment or a personal message.
Enjoy Trading ;)

NAS100 Pullback and Liquidity Sweep in H4 Demand. Time to LongNQ has given a nice deep pullback into H4 demand. Time to pull the trigger.
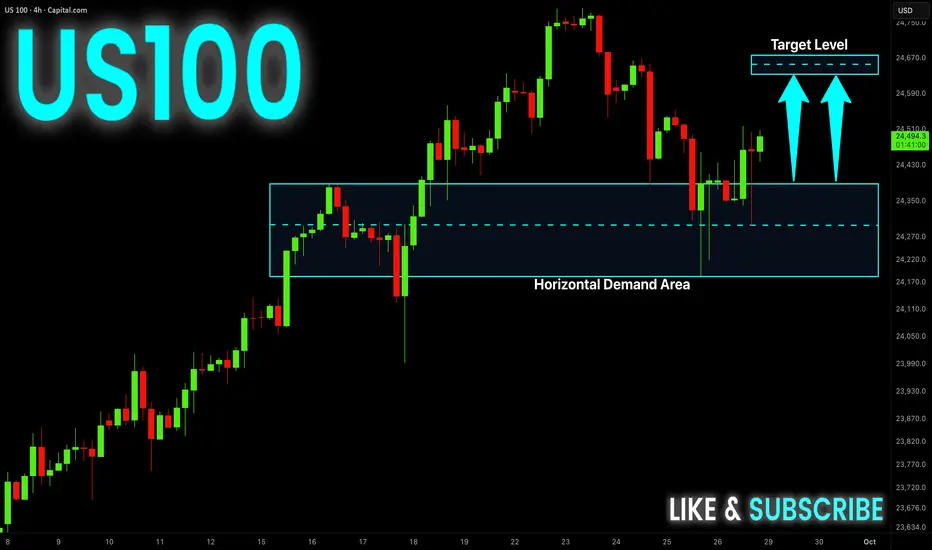
US100 Will Keep Growing! Buy!
Hello,Traders!
US100 Price reacts from the horizontal demand area, shifting order flow bullish. SMC structure favors upside with liquidity targets set at 24,670 zone. Time Frame 4H.
Buy!
Comment and subscribe to help us grow!
Check out other forecasts below too!
Disclosure: I am part of Trade Nation's Influencer program and receive a monthly fee for using their TradingView charts in my analysis.
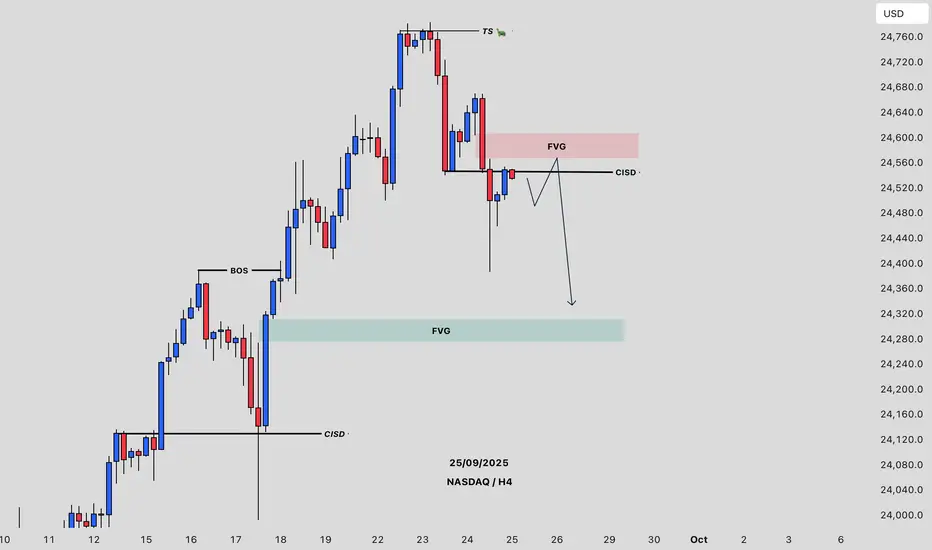
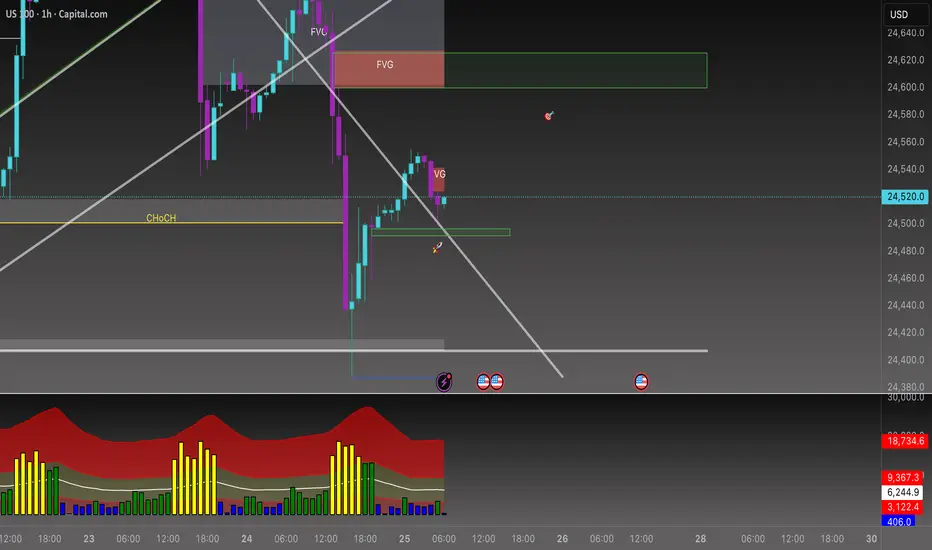
Beyond the Chart - NAS100 Through Technicals & FundamentalsNAS100 has just completed its move into the Discount PD Array zone I highlighted yesterday. On the 1H timeframe, I pointed out the prevailing bearish trend and marked this area as a key target. Once price tapped the zone, sellers lost momentum and buyers stepped in, shifting market control.
Now we’re seeing an inverse Z formation, with a Fair Value Gap (FVG) and a Breaker Block (BB) cutting across the structure. If buyers step in again, as they did in the earlier PD Array, my upside target will be 24,580.
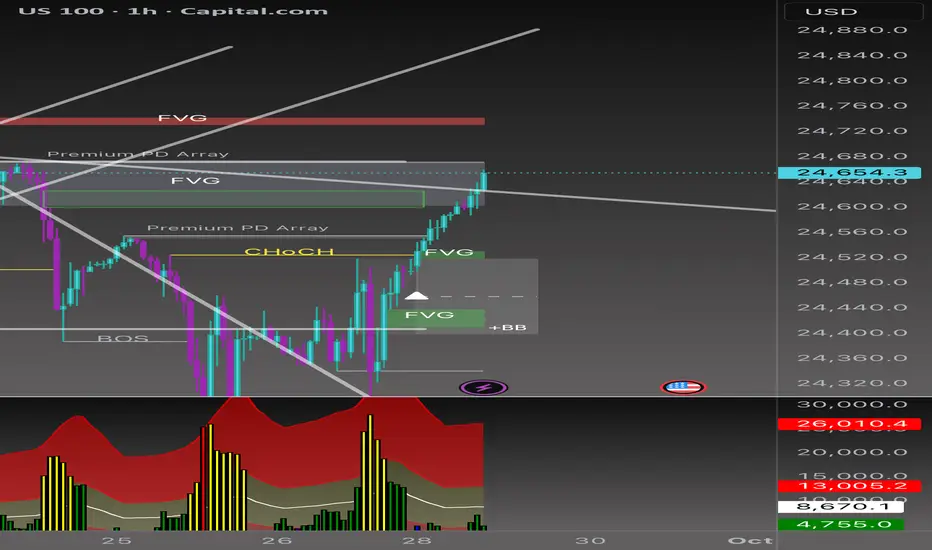
Beyond the Chart - NAS100 Through Technicals & FundamentalsThe trendline I drew last week played out perfectly. Price has carved out a fresh trend on the lower timeframe and is breaking to the upside. But the real confirmation comes only if the FVG is fully filled and we get a strong bullish close above 24,700.
NASDAQ Daily Analysis 📊
👉Hold above 24,500 – 24,520 → BUY targeting 24,700 (upper FVG). Break & hourly close above 24,700 → room to push toward 24,850 – 24,900.
👉24,700 – 24,750 → strong SELL zone (Premium PD Array + FVG overlap). First downside target: 24,400 – 24,350.
⚡️Bottom line:
• Bullish case→ If inflation comes in lower and the Fed takes a softer tone → buyers could step in and push levels higher.
• Bearish case → If data runs hot and the Fed signals more tightening → selling pressure kicks in, and your short levels become key.
NAS100We looking for buying opportunities as the market is now in a continuous momentum to the upside resulting in buying opportunities|30 MIN TIMEFRAME

US100: Bullish Momentum Pauses at Resistance4H Technical Outlook
All-Time High Barrier
The all-time high overhead is a clear psychological resistance. Chasing longs directly into this level is not attractive from a risk/reward perspective. Only a confirmed breakout and acceptance above would open “uncharted territory” and establish fresh bullish momentum.
Zone 1: Overhead Supply / Yesterday’s High
This area marks an immediate supply pocket, coinciding with yesterday’s high. Price action has shown hesitation here, and buyers are struggling to establish acceptance above. As long as price remains capped under this zone, it serves as a short-term sell area. A clean breakout and consolidation above would invalidate the supply and potentially trigger continuation toward the all-time high at 24,754.
Zone 2: Key Intraday Demand / Yesterday’s Low
This zone represents the first meaningful demand layer below spot price. Yesterday’s low aligns with intraday consolidation, making it a pivot area where responsive buyers could step back in. If bulls defend this zone, it may form the base for another push higher. A decisive break below, however, would shift near-term control back to sellers and expose deeper liquidity pockets.
Zone 3: High-Impact Demand Area (4H structure)
This is a more significant demand zone where aggressive buyers previously absorbed heavy selling and initiated the latest upward leg. If tested again, it could attract strong dip-buying interest. Failure to hold this zone would represent a structural breakdown on the 4H chart and likely accelerate downside momentum toward lower liquidity pools.
The sentiment around the Nasdaq100 is cautious and slightly bearish at the moment. Macro risks dominate the narrative, with the looming U.S. government shutdown creating uncertainty and threatening to delay key economic data releases. At the same time, consumer confidence has weakened, signaling softer demand ahead, while interest rate policy remains uncertain.
On the positive side, the tech and AI boom continues to provide structural support, but valuations are stretched, and many traders are positioning defensively. Technically, the index is consolidating below resistance, with support levels in focus.
Overall, the market remains supported by long-term growth themes, but near-term sentiment is clouded by macro headwinds and the risk of a deeper pullback.

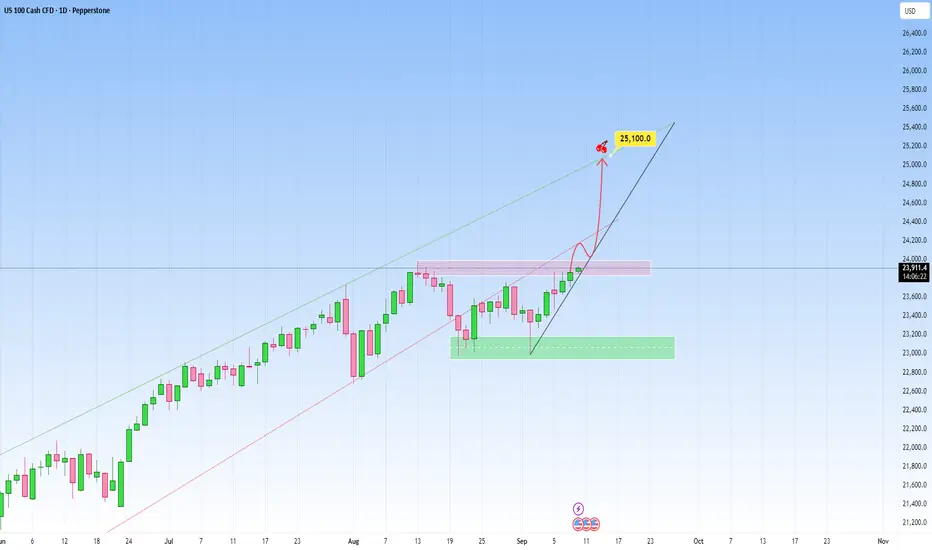
NAS100 Outlook: Recent rise has been steady!Market context on NAS100 remains bullish clearly. The most recent move saw a steady recovery, heading towards the upper boundary of the newly projected channel. And this right here is another great opportunity to get involved.
The market is likely in the early stages of a new impulsive leg to the upside right here.
We could also have short-term consolidation or pullback, then a continuation toward the upper boundary but I believe the latter is more plausible.
My target will be at 25,100.
USNAS100 – Powell Caution Keeps Nasdaq in Tight RangeUSNAS100 – Overview
Futures tied to the S&P 500 and Nasdaq edged slightly higher on Wednesday as investors weighed measured comments from Fed Chair Jerome Powell and looked ahead to key U.S. economic data later this week.
Powell acknowledged that asset prices appear highly valued, while maintaining a cautious tone on the labor market. He avoided taking sides between Fed officials calling for deeper cuts to support jobs and those urging restraint to avoid inflation risks, emphasizing instead the delicate balancing act between growth and price stability.
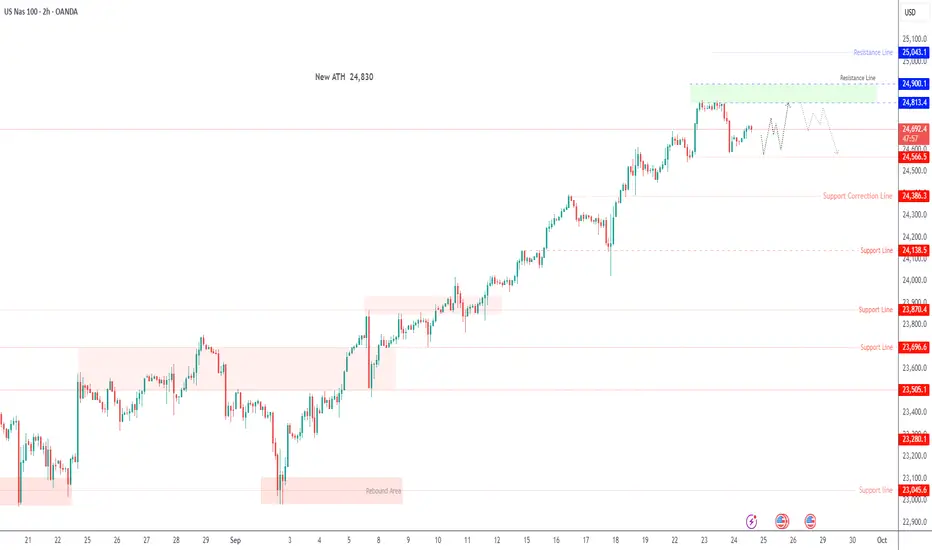
📊 Technical View
The Nasdaq100 is showing range-bound price action, with consolidation likely to continue until a clear breakout occurs.
Bearish Scenario:
Price is expected to test the resistance zone around 24,810 before pulling back toward 24,560.
🔻 A confirmed 15-min close below 24,560 would expose deeper supports at 24,380 → 24,140.
Bullish Scenario:
A decisive break above 24,900 would invalidate the bearish setup and open the way toward 25,040.
An hourly close above 24,900 would confirm renewed bullish momentum.
Key Levels
Pivot: 24,660
Resistance: 24,810 – 24,900 – 25,050
Support: 24,560 – 24,380 – 24,150
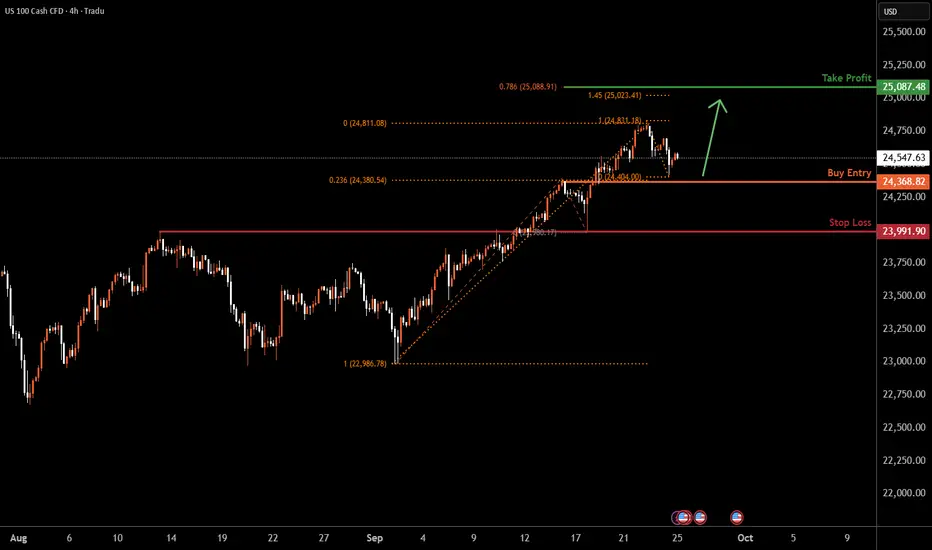
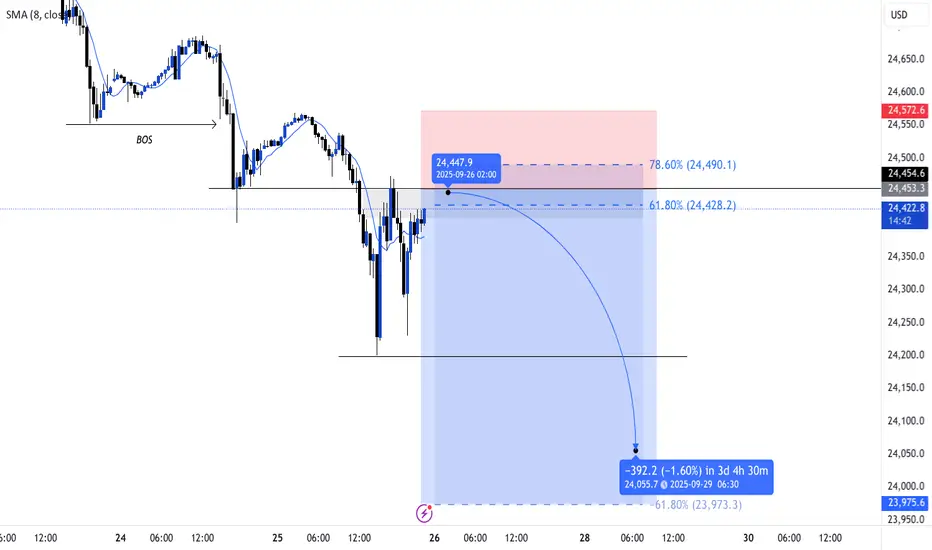
NAS100 H4 | Bullish momentum to extend?NAS100 is falling towards the buy entry at 24,368.82, which is a pullback support that aligns with the 23.6% Fibonacci retracement and could bounce from this level to the upside.
Stop loss is at 23,991.90, which is an overlap support.
Take profit is at 24,087.48, which aligns with the 78.6% Fibonacci projection and the 161.8% Fibonacci extension.
High Risk Investment Warning
Trading Forex/CFDs on margin carries a high level of risk and may not be suitable for all investors. Leverage can work against you.
Stratos Markets Limited (tradu.com ):
CFDs are complex instruments and come with a high risk of losing money rapidly due to leverage. 65% of retail investor accounts lose money when trading CFDs with this provider. You should consider whether you understand how CFDs work and whether you can afford to take the high risk of losing your money.
Stratos Europe Ltd (tradu.com ):
CFDs are complex instruments and come with a high risk of losing money rapidly due to leverage. 66% of retail investor accounts lose money when trading CFDs with this provider. You should consider whether you understand how CFDs work and whether you can afford to take the high risk of losing your money.
Stratos Global LLC (tradu.com ):
Losses can exceed deposits.
Please be advised that the information presented on TradingView is provided to Tradu (‘Company’, ‘we’) by a third-party provider (‘TFA Global Pte Ltd’). Please be reminded that you are solely responsible for the trading decisions on your account. There is a very high degree of risk involved in trading. Any information and/or content is intended entirely for research, educational and informational purposes only and does not constitute investment or consultation advice or investment strategy. The information is not tailored to the investment needs of any specific person and therefore does not involve a consideration of any of the investment objectives, financial situation or needs of any viewer that may receive it. Kindly also note that past performance is not a reliable indicator of future results. Actual results may differ materially from those anticipated in forward-looking or past performance statements. We assume no liability as to the accuracy or completeness of any of the information and/or content provided herein and the Company cannot be held responsible for any omission, mistake nor for any loss or damage including without limitation to any loss of profit which may arise from reliance on any information supplied by TFA Global Pte Ltd.
The speaker(s) is neither an employee, agent nor representative of Tradu and is therefore acting independently. The opinions given are their own, constitute general market commentary, and do not constitute the opinion or advice of Tradu or any form of personal or investment advice. Tradu neither endorses nor guarantees offerings of third-party speakers, nor is Tradu responsible for the content, veracity or opinions of third-party speakers, presenters or participants.