NDX trade ideas
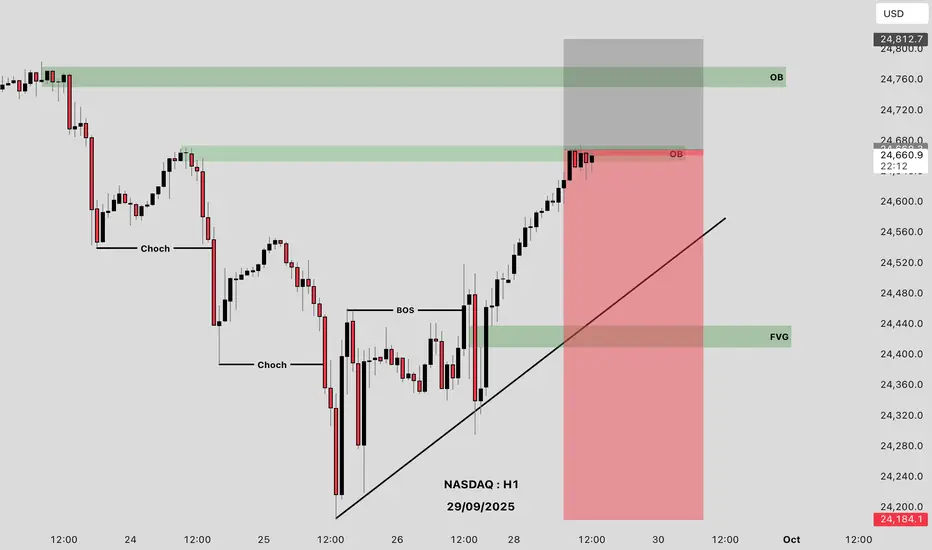
NASDAQ H1 OUTLOOKLets Nasdaq Sell
Reasons
Bearish Order Block
Who Is With Me Comment Your Opinion
Good Luck Guys
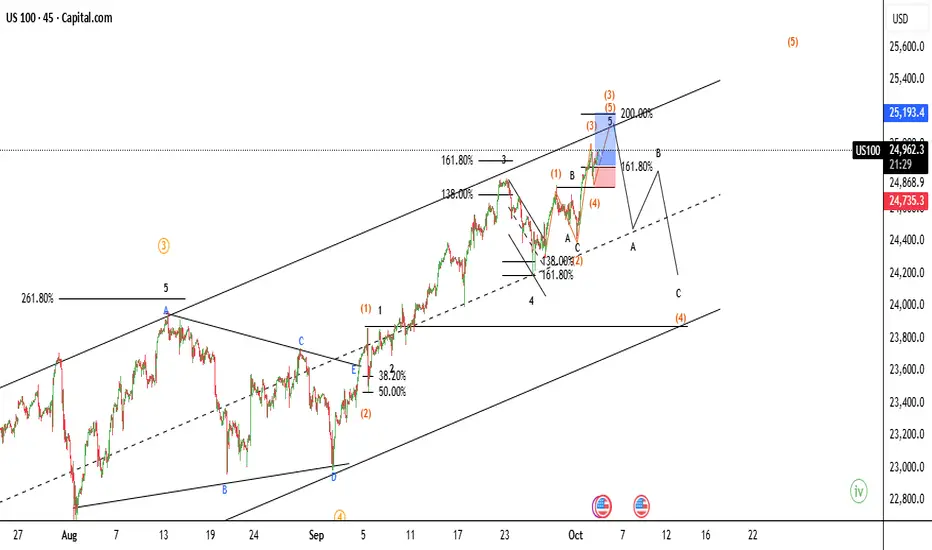
NAS100We have completed a major Wave 3, and we are now in a corrective Wave 4. The entry zone with targets has been identified, and the final target will be at the new historical highs of 25,200.

NAS100 - Updated Trader EdgeI will appreciate some feedback please🙏
🎯 KEY PIVOT ZONE
BREAKOUT LEVEL: 24,780.0-24,840.0
➡️Massive HVN cluster (6+ stacked bars) with 3 POC convergence at right edge of VRVP
➡️Untested high-volume zone at all-time high area, no meaningful price rejection history above
➡️48.4 points above current price - price approaching breakout territory
📊 PRICE TARGETS
UPSIDE TARGETS ⬆️
🎯T1: 24,780.0-24,840.0 (Breakout through primary HVN)
🎯T2: Breakout continuation into discovery above 24,900.0
DOWNSIDE TARGETS ⬇️
🎯T1: 24,360.0-24,420.0 (Primary Demand)
🎯T2: 24,180.0-24,240.0 (Secondary Demand)
⚡💎⚡ EDGE - HIGHEST PROBABILITY PLAY
Long from 24,680.0-24,720.0 pullback zone targeting breakout through 24,780.0-24,840.0
then continuation above 24,900.0
🔍 PRE-ENTRY CONFIRMATION SIGNALS
✅ Strong bullish momentum on approach to 24,780.0 with volume expansion
✅ Break above 24,780.0 with conviction or successful retest of 24,720.0 as support
✅ Continuation candles closing above 24,800.0 confirming breakout strength
📈 TRADE SETUP
🟢PRIMARY BIAS: BULLISH-BREAKOUT
Long Setup:
🆗Entry: 24,680.0-24,720.0 on pullback
OR
🆗Entry: 24,780.0+ on breakout confirmation
Stop Loss: 24,640.0
🎯Target 1: 24,840.0-24,880.0
🎯Target 2: 24,960.0+
Risk/Reward: 1:2.0 / 1:3.5
🔄 BIAS FLIP CONDITIONS
🔴TURNS BEARISH IF:
✅Rejection at 24,780.0-24,840.0 with strong bearish engulfing and close back below 24,720.0
✅Break and hold below 24,640.0 with accelerating downside momentum
✅Failed breakout creating lower high below 24,760.0 with distribution
⚡Then Target:
🎯24,360.0-24,420.0
🎯24,180.0-24,240.0
⚠️ RISK MANAGEMENT
Max Risk: 80 points from entry to stop
Position Size: Risk 1-1.5% of capital on breakout plays
Time Stop: Exit by end of session if no follow-through above 24,800.0
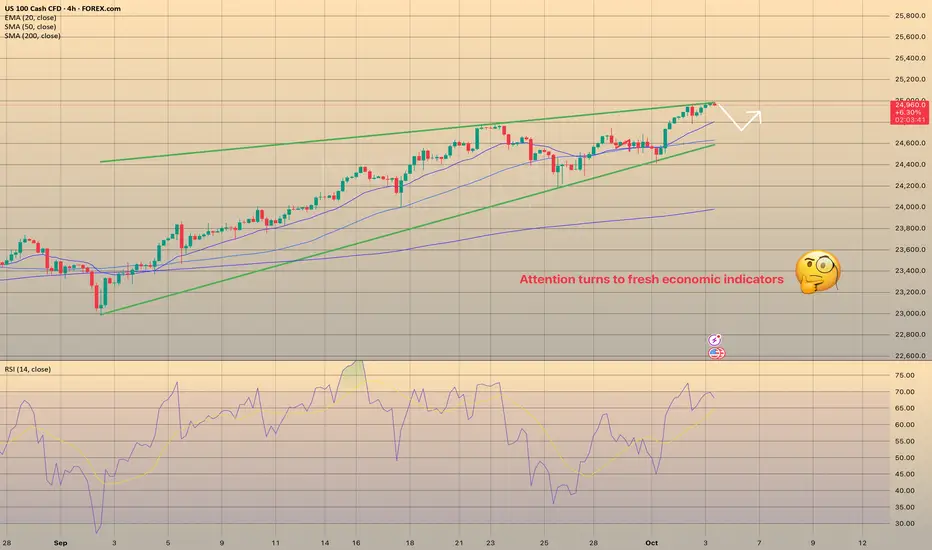
NAS100 - Stock Market Awaits Employment Data!The index is above the EMA200 and EMA50 on the four-hour time frame and is in its long-term ascending channel. If the upward momentum decreases, we can expect a correction to the demand range and buy Nasdaq in that range with an appropriate reward for the risk.
According to reports released over the weekend, UBS stated that there is a 93% probability of the U.S. economy entering a recession this year. This figure implicitly suggests that the country may already be in recession, though some analysts remain skeptical of such a direct conclusion. UBS’s projection is based on indicators such as personal income, consumption, industrial production, and employment.
The bank warned that the U.S. economy has reached “historically troubling levels,” though no outright collapse has yet occurred. Analysts at UBS described the economy as “weak, soft, and fragile,” while noting that a definitive declaration of recession has not been made.
In the United States, an official declaration of recession is the responsibility of the Business Cycle Dating Committee at the National Bureau of Economic Research (NBER), which typically makes such calls with a lag of 6 to 18 months after the recession has started. Their assessment relies on revised data covering GDP, employment, income, sales, and production, and they generally avoid premature decisions.
In the meantime, policymakers and markets tend to act on real-time indicators such as GDP estimates, jobs data, yield curve signals, and credit spreads. In practice, traders react more strongly to price movements than to formal definitions of recession.
Separately, Michael Feroli, chief U.S. economist at J.P. Morgan, dismissed Fed board member Steven Miran’s call for cutting rates to 2.5% or lower. The bank has maintained its forecast for gradual 25-basis-point cuts, targeting a range of 3.25% to 3.5% by early next year.
A potential Supreme Court case involving Fed board member Lisa Cook has also emerged as a “wild card,” since a ruling against her could undermine the positions of other members as well. J.P. Morgan has warned that politicization of the Federal Reserve would leave the institution more vulnerable to pressure from a Trump administration on monetary policy.
The U.S. dollar remained relatively strong this week, as investors continued to parse the Fed’s less-dovish stance. While the latest dot plot showed policymakers aligned with the market on two additional rate cuts this year, the median dot for 2026 pointed to only one more 25-basis-point reduction. By contrast, markets still expect as many as three cuts next year.
However, following Chair Jerome Powell’s cautious tone on Tuesday—emphasizing that the Fed must continue balancing the competing risks of elevated inflation and a weakening labor market—investors scaled back some of their bets.
Inflation risks remain significant. The OECD highlighted this week that the full effects of tariff hikes are still unfolding. What supports Powell’s cautious approach is that, despite signs of labor market weakness, the Fed’s own forecasts remain relatively optimistic, with economic activity showing resilience. The Atlanta Fed’s GDPNow model projects 3.3% growth for Q3.
Although last week’s inflation data failed to dampen market optimism for rate cuts—and equities continued their rally—the focus in the coming week will shift back to labor market conditions.
The week begins Monday with pending home sales data. On Tuesday, the JOLTS job openings report and the consumer confidence index will be released. Wednesday brings private-sector employment data from ADP, followed by the ISM Manufacturing PMI. On Thursday, weekly jobless claims will be published as usual.
All of these releases will build up to Friday’s critical nonfarm payrolls (NFP) report, widely seen as the market’s ultimate test.Investors will closely monitor whether recent labor market weakness persists, and whether the Fed can move another step toward a rate cut at the October meeting. Finally, the ISM Services Index will provide a more comprehensive picture of U.S. economic health.
Ahead of the jobs data, traders may also take note of remarks from several Fed officials, including Vice Chair Jefferson, New York Fed President Williams, Atlanta Fed President Bostic, Chicago Fed President Goolsbee, and Dallas Fed President Logan. The ADP and NFP releases on Wednesday will likely provide the first snapshot of September labor market performance.


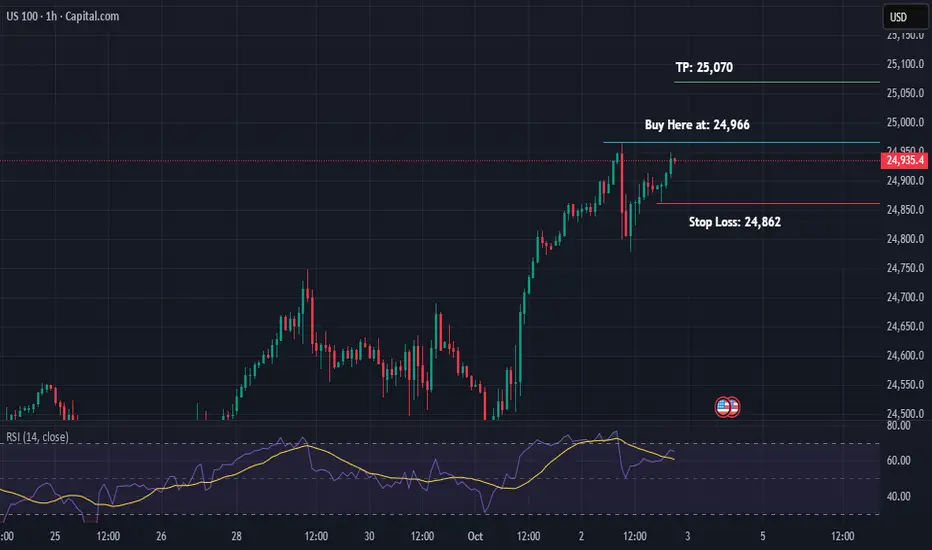
US100 Buy-Stop, Bullish Trend Continues...US100 is showing strong Bullish Trend on Daily Timeframe. The 4H and 1H timeframes are also showing Bullish momentum.
We can easily take a 1:1 Long trade here. Although there are important news events today, but in my opinion, this trade could be concluded by that time. Let's see how it goes.
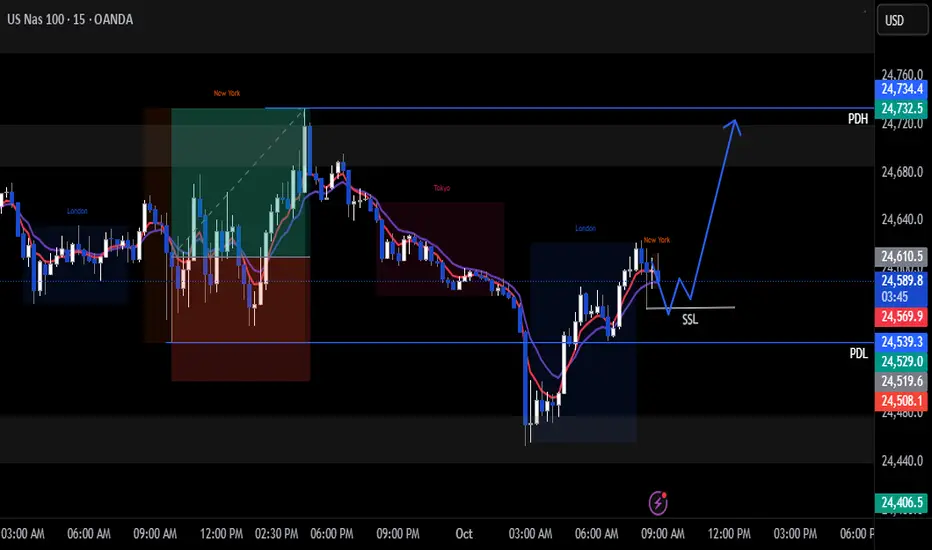
Nas100 Trade Set Up Oct 1Price swept PDL in London session and pushed up so i am bullish today once price sweeps internal SSL to target PDH
www.tradingview.com
Possible Nasdaq shorts Looking for shorts on Nasdaq for a day trade- 15min time frame possible movement

NAS LONGLongs on NAS below daily key level and h4 crt low, pirce broke weekly key level and retested forming a OTE and true maket structure shift from m15 timeframe. expecting to reverse back to reach the weekly key level high and h4 crt target.

US100 Expected Growth! BUY!
My dear friends,
Please, find my technical outlook for US100 below:
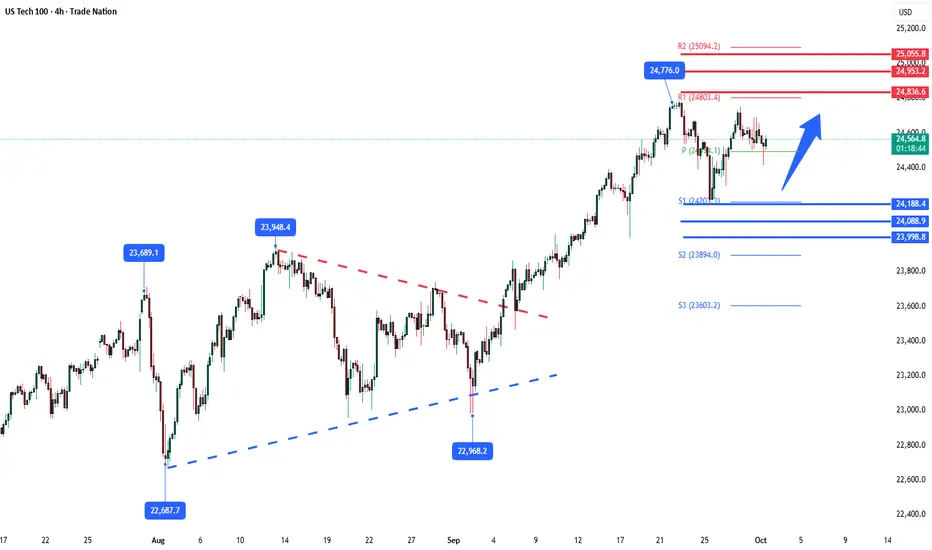
The price is coiling around a solid key level - 24770
Bias -Bullish
Technical Indicators: Pivot Points High anticipates a potential price reversal.
Super trend shows a clear buy, giving a perfect indicators' convergence.
Goal - 24845
Safe Stop Loss - 24731
About Used Indicators:
The pivot point itself is simply the average of the high, low and closing prices from the previous trading day.
Disclosure: I am part of Trade Nation's Influencer program and receive a monthly fee for using their TradingView charts in my analysis.
———————————
WISH YOU ALL LUCK
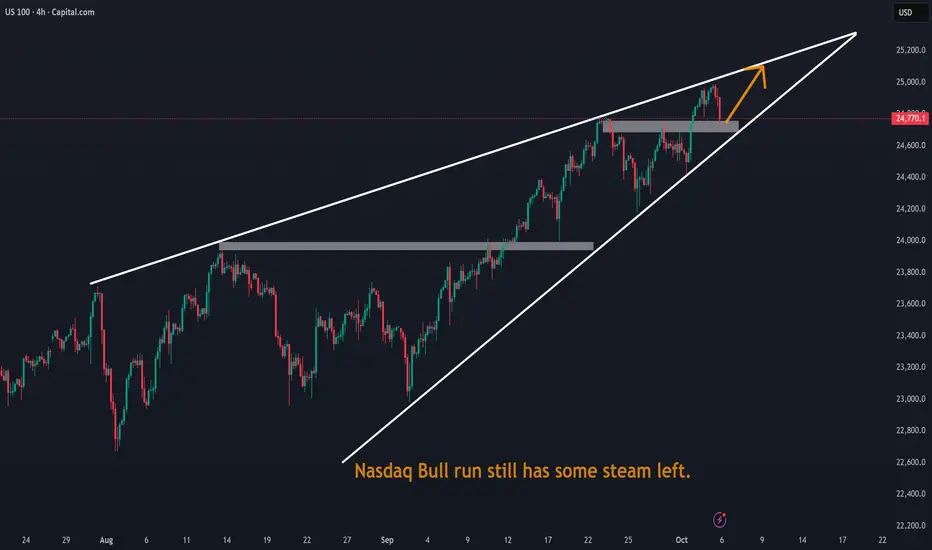
Nasdaq Bull run still has some steam left.Nasdaq Bull run still has some steam left. It appears that Tarrif war has almost no significant effect on US economy as per economist expectations.
Exness: The Convergence of Tech GiantsThe initial phase of the artificial intelligence (AI) rebound was driven by narrative and momentum; merely being associated with AI was enough to push up valuations. Now, we are entering a more mature phase where investors will demand tangible results and will penalize specific strategic missteps or unmitigated risks.
Although the AI theme remains dominant, news from specific companies is now triggering significant and differentiated reactions. For example, Apple is adjusting its entire AR/VR strategy due to product-specific difficulties, while Meta is grappling with an existential regulatory battle unrelated to its AI development. This differentiation means the market is beginning to distinguish between "AI beneficiaries" and "AI players who need to prove themselves."
Simply being among the "Magnificent Seven" is no longer enough; companies must now demonstrate their ability to navigate their unique challenges—be they competitive, regulatory, or operational.
Therefore, the next phase of the Nasdaq 100's performance will depend on how these individual giants execute their specific strategies, making company-level analysis more critical than ever.
NVIDIA's AI Empire: Solidifying the Moat or Building a House of Cards?
Nvidia recently announced a strategic cooperation intent, planning to invest up to $100 billion in OpenAI. This investment is closely linked to the deployment of at least 10 gigawatts of Nvidia systems, aimed at supporting OpenAI's next-generation AI infrastructure, with the first phase using its Vera Rubin platform by 2026. This is not just an investment; it's a self-reinforcing business cycle. Nvidia provides funding to OpenAI, and OpenAI then uses these funds to purchase Nvidia's core products (GPUs, networking systems), thereby effectively securing a large and long-term order channel, injecting strong momentum into both parties' revenue growth.
However, this arrangement has also drawn critical perspectives, arguing that it constitutes "The Infinite Money Glitch." Analysts have compared it to Cisco Systems' practices during the dot-com bubble, when Cisco provided funding to telecom companies to purchase its routers, a strategy that amplified the subsequent market collapse.
The risk is that Nvidia may be artificially inflating its own demand, which would make it very vulnerable if the AI capital expenditure boom slows down or OpenAI's business model encounters problems.
This investment can also be seen as a defensive move, aimed at preventing OpenAI from developing its own custom chips or deepening its cooperation with competitors like Broadcom, with whom OpenAI has already signed a $10 billion order.
Apple's Pragmatic Shift: From Vision to Sight
Recent reports confirm that Apple is pausing its planned overhaul of the Vision Pro headset to reallocate resources and accelerate the development of AI-powered smart glasses. The logic behind this strategic shift is that the Vision Pro, launched in February 2024, has struggled to maintain sales momentum due to its high price of $3,499, physical weight, and limited content ecosystem, leading to waning consumer interest.
This shift is a pragmatic admission by Apple that the path to the mass market lies in a different product form factor. According to the new roadmap, Apple is reportedly developing at least two models: a simpler display-less version (N50) that connects to the iPhone, and a more advanced version with an integrated display that directly competes with Meta's products. The development timeline is being accelerated, with a possible release as early as next year.
This strategic shift is less about abandoning spatial computing and more about finding a viable mass-market vehicle to counter its "AI laggard" label and establish a new, Apple-controlled AI platform.
Despite the launch of "Apple Intelligence," Apple is still widely considered to be playing catch-up in the generative AI field compared to Google and OpenAI.
Meta's Ambitious: Software to hardware while defending the core.
In this race, Meta is clearly in the lead. It has collaborated with Ray-Ban to launch multiple generations of smart glasses, and has introduced the $800 Ray-Ban Display, its first consumer model with a built-in screen. They are setting the pace, forcing Apple to react. However, at the same time, Meta's core advertising business is facing unprecedented and escalating legal attacks in the EU. This includes a €550 million lawsuit filed by over 80 Spanish media organizations, accusing it of unfair competition; similar lawsuits exist in France; and its "consent or pay" model faces fundamental challenges under GDPR and the Digital Services Act (DSA).
Meta's aggressive push in smart glasses and the metaverse is not just a pursuit of new growth, but a strategic necessity driven by the existential threat to its underlying advertising business model. Meta's primary revenue and profit engine – personalized advertising based on user data – is facing fundamental, systemic challenges in one of its largest markets (the EU). This regulatory pressure creates a powerful incentive for it to develop new platforms (such as smart glasses operating systems) where Meta can control the ecosystem, set data collection rules, and build new, diversified revenue streams (e.g., hardware sales, AR app stores).
Therefore, succeeding in this new hardware race is not only an offensive growth strategy, but also a crucial defensive move to reduce the company's reliance on a business model that is increasingly untenable from a regulatory perspective.
Microsoft's Quiet Restructuring for the Future of its AI Center
Microsoft has undergone a major internal reorganization to strengthen its focus on AI. This includes the appointment of Judson Althoff as CEO of the commercial business, a move explicitly aimed at allowing CEO Satya Nadella to focus on high-level technical work in AI, data center architecture, and product innovation. Meanwhile, the company has for the first time since 2018 unified its Windows engineering division under one leader, Pavan Davuluri. The clear goal is to accelerate the realization of Windows as an "Agentic OS" – an AI-driven operating system that can proactively perform tasks for users.
Microsoft's strategy is fundamentally different from Apple's and Meta's. Instead of chasing new consumer hardware categories, Microsoft is doubling down on its existing enterprise and operating system strongholds, deeply integrating AI into the fabric of its core products to increase user engagement and drive consumption within its ecosystem. Recent news from Microsoft is not about novel gadgets, but about organizational structure and a long-term operating system vision. The changes in commercial leadership are to optimize the sales process for AI-enhanced enterprise services (such as Azure AI and Microsoft 365 Copilot). The changes in Windows are to redefine the core PC experience in the age of AI.
This is a lower-risk, more defensive strategy. They are not trying to create a new market from scratch, but rather are using AI to fortify their existing multi-trillion-dollar enterprise and consumer software moats. The measure of Microsoft's success will not be hardware sales units, but rather Azure consumption growth, Copilot subscription numbers, and increased enterprise license value.
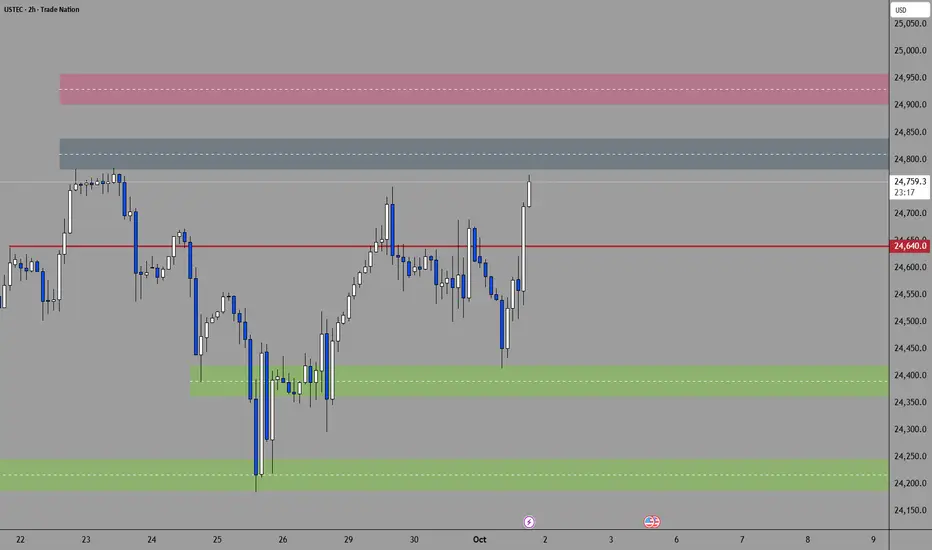
USTEC reached the 100% Fibonacci Extension at around 24955 before retracing. The index awaits a potential breakout from the range of 24800-24955.
If USTEC breaks above 24955, the index may test the 161% Fibonacci Extension at around 25265.
Conversely, returning below 24700-24800 may lead to a retest of EMA21 and the channel’s lower bound.
Combining the above analysis, the performance of the Nasdaq 100 index will be the ultimate resultant force of these competing powers. This ecosystem is interconnected: Nvidia's ability to execute its large-scale infrastructure construction is the foundation for the AI ambitions of companies like Microsoft and Meta. The success of Apple's and Meta's hardware battle will define the next major consumer computing platform and create new ecosystems. Microsoft's solid position in the enterprise sector provides a stabilizing force, while Meta's regulatory battles in Europe remain the most significant idiosyncratic risk facing a major component of the index.
This is not a prediction, but a guide to what matters most in the coming quarters:
For Nvidia: Track gross margins for its Blackwell and upcoming Vera Rubin platforms and any comments on pricing power. Watch for any official regulatory investigations initiated by the US or EU regarding its partnership with OpenAI and its ecosystem impact.
For Apple and Meta: Sales data in the first 6-12 months after the launch of any new smart glasses, and more importantly, user engagement metrics will be crucial. The quality and capability of Apple's revamped Siri (Project Linwood) upon full release will be a key leading indicator of its AI competitiveness.
For Meta (EU): Rulings in media lawsuits in Spain and France will be key (the trial in Spain is scheduled for October 2025). Any decision invalidating the "consent or pay" model would force a fundamental restructuring of its European operations and could have significant financial implications.
For the Macro Environment: Monthly non-farm payroll reports are key data points. A sustained trend below expectation would significantly increase the probability of a recession and could outweigh the positive sentiment from potential interest rate cuts, shifting market focus from valuation support to fundamental earnings risk.
By Eric Chia, Financial Market Strategist at Exness
NSDQ100 Key Trading Levels Key Support and Resistance Levels
Resistance Level 1: 24835
Resistance Level 2: 24950
Resistance Level 3: 25055
Support Level 1: 24190
Support Level 2: 24090
Support Level 3: 24000
This communication is for informational purposes only and should not be viewed as any form of recommendation as to a particular course of action or as investment advice. It is not intended as an offer or solicitation for the purchase or sale of any financial instrument or as an official confirmation of any transaction. Opinions, estimates and assumptions expressed herein are made as of the date of this communication and are subject to change without notice. This communication has been prepared based upon information, including market prices, data and other information, believed to be reliable; however, Trade Nation does not warrant its completeness or accuracy. All market prices and market data contained in or attached to this communication are indicative and subject to change without notice.
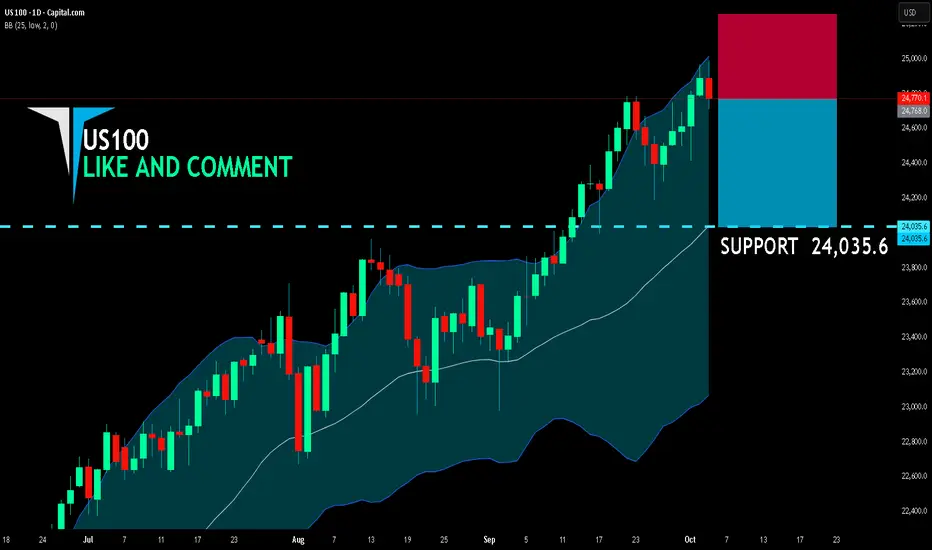
US100 BEST PLACE TO SELL FROM|SHORT
US100 SIGNAL
Trade Direction: short
Entry Level: 24,768.0
Target Level: 24,035.6
Stop Loss: 25,254.9
RISK PROFILE
Risk level: medium
Suggested risk: 1%
Timeframe: 1D
Disclosure: I am part of Trade Nation's Influencer program and receive a monthly fee for using their TradingView charts in my analysis.
✅LIKE AND COMMENT MY IDEAS✅

$nas updateGot taken out as of late!!!
No problem 😉
Here’s the get back on steroids!!!!
We shouldn’t see $24,535 at this point. This plays low end & MAX!!!!
Targets from the original post remains steady and I will be cloning that same profile for a second setup this week.
The current cycle of $25,335 is begging for candles & I’m looking to run this over with leverage!!!!!
$24,702 is crucial to p.a this week and will definitely make a jump on targets if sustained above on closures.
Therefore, first profile presented…
Three points for layering:
-$24,714, 659 & 610..
Again, $24,535 should be clear with that last low, BUT I am willing to allow a 4h closure if we price there.
$25,653.8 is the extension for full targets!!
Blessings to all!!!
Let’s put on another great week! 😎🫶🏽

US100 Price signalling renewed buying momentum.The USNAS100 index gained 11.24 points (+0.04%), closing at 24,690. The index has formed a new bullish consolidation range after the close and has also broken out above the previous support zone, signalling renewed buying momentum.
Technical Outlook:
Major U.S. stock indexes bounced back from early session lows on Wednesday following weaker-than-expected data. Additionally, upcoming private payroll data on Friday could lead to increased market volatility and stronger price reactions.
If the price continues to hold above the breakout zone and remains in bullish territory, we could see the index push toward the 25,001 resistance level in the near term.
You may find more details in the chart.
Trade wisely Best of Luck.
Ps; Support with like and comments for better analysis Thanks.

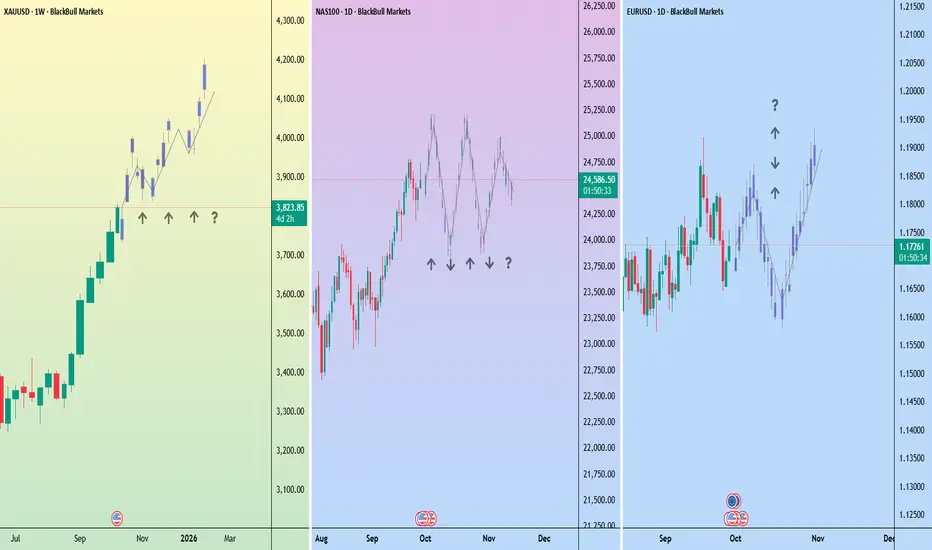
Positioning for a government shutdown: gold, Nasdaq 100, EURUSDUnless Congress can reach an agreement before 1 October, the federal government will shut down. The last major shutdown, during President Trump’s first term, lasted 34 days.
Markets are already weighing the risks of plummeting confidence in the US and its currency and disruptions to the release of important economic data. For traders, this can create volatility and opportunity across major asset classes.
Gold
Gold often benefits from political and fiscal uncertainty. If a shutdown occurs, safe-haven flows could push the metal higher.
Nasdaq 100
The Nasdaq 100 has been sensitive to swings in sentiment around government stability and interest rate expectations. A shutdown could amplify volatility. Traders should be mindful of potential gap moves at the weekly open if negotiations falter over the weekend.
EUR/USD
A shutdown that undermines confidence in U.S. fiscal management could weigh on the EUR/USD in the short term. However, Europe faces its own economic issues, potentially keeping the pair range-bound for now.
Wall Street extends record run as Shutdown delays key data, Fed Wall Street extends record run as Shutdown delays key data, Fed in Focus
U.S. stocks closed at record highs on Oct. 2, led by tech, with futures extending gains the next day. Optimism is supported by expectations of Fed rate cuts, though the government shutdown—now in its third day—has delayed key data, including nonfarm payrolls, leaving traders reliant on weaker private labor surveys.
With official releases on hold, ISM and S&P Global PMI data will carry added weight, while Fed officials’ speeches could sway rate-cut bets. While momentum points to weekly gains, the rally remains fragile as political gridlock, hawkish commentary, or profit-taking could trigger volatility.
Market Implications:
Supportive factors: Tech sector strength, softer labor signals, and rate-cut expectations.
Risks: Prolonged shutdown delaying visibility on economic conditions, potential hawkish Fed commentary, and profit-taking at record levels.
Outlook: If momentum holds, the S&P 500, Dow, and Nasdaq are positioned to close the week higher, though volatility is likely to remain elevated until greater policy clarity emerges.
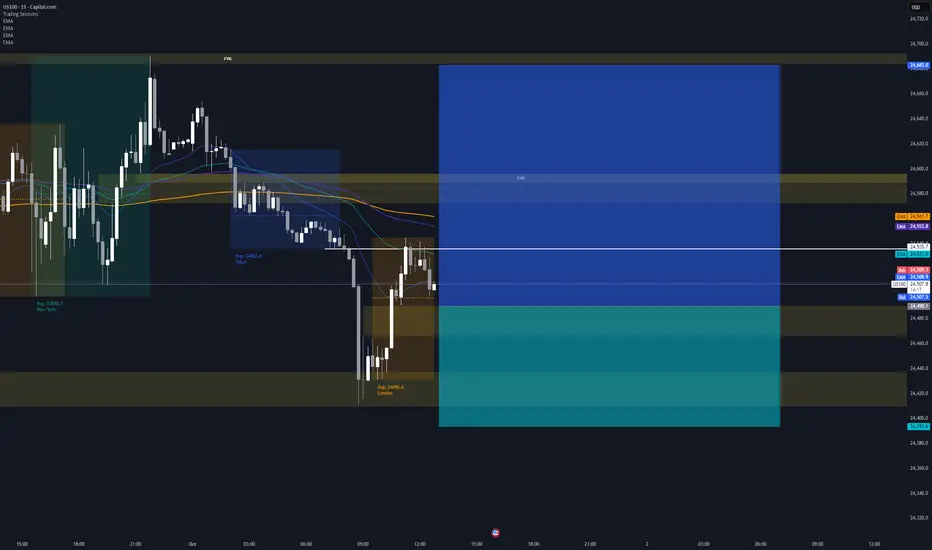
US NAS 100Preferably suitable for scalping and accurate as long as you watch carefully the price action with the drawn areas.
With your likes and comments, you give me enough energy to provide the best analysis on an ongoing basis.
And if you needed any analysis that was not on the page, you can ask me with a comment or a personal message.
Enjoy Trading ;)

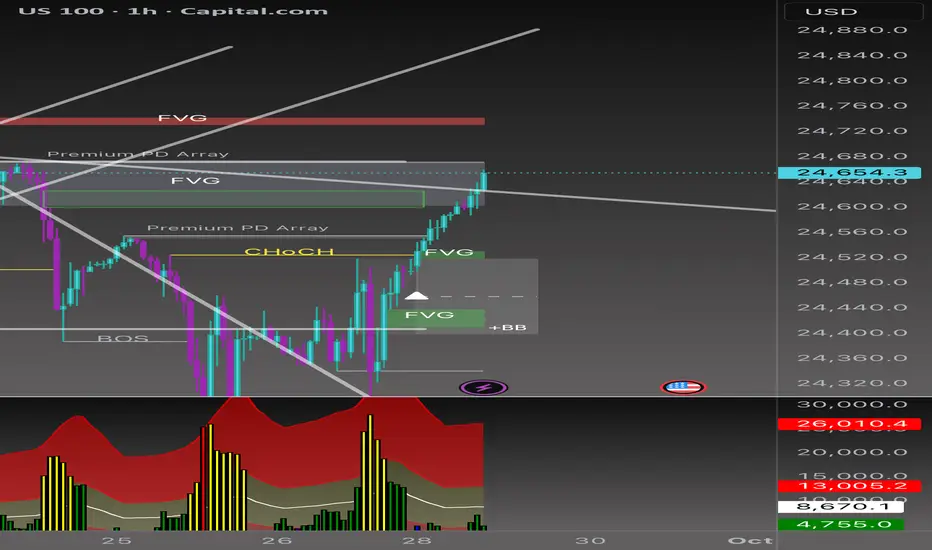
Beyond the Chart - NAS100 Through Technicals & FundamentalsThe trendline I drew last week played out perfectly. Price has carved out a fresh trend on the lower timeframe and is breaking to the upside. But the real confirmation comes only if the FVG is fully filled and we get a strong bullish close above 24,700.
NASDAQ Daily Analysis 📊
👉Hold above 24,500 – 24,520 → BUY targeting 24,700 (upper FVG). Break & hourly close above 24,700 → room to push toward 24,850 – 24,900.
👉24,700 – 24,750 → strong SELL zone (Premium PD Array + FVG overlap). First downside target: 24,400 – 24,350.
⚡️Bottom line:
• Bullish case→ If inflation comes in lower and the Fed takes a softer tone → buyers could step in and push levels higher.
• Bearish case → If data runs hot and the Fed signals more tightening → selling pressure kicks in, and your short levels become key.