NSDQ100 The Wek Ahead, Key Trading LevelsKey Support and Resistance Levels
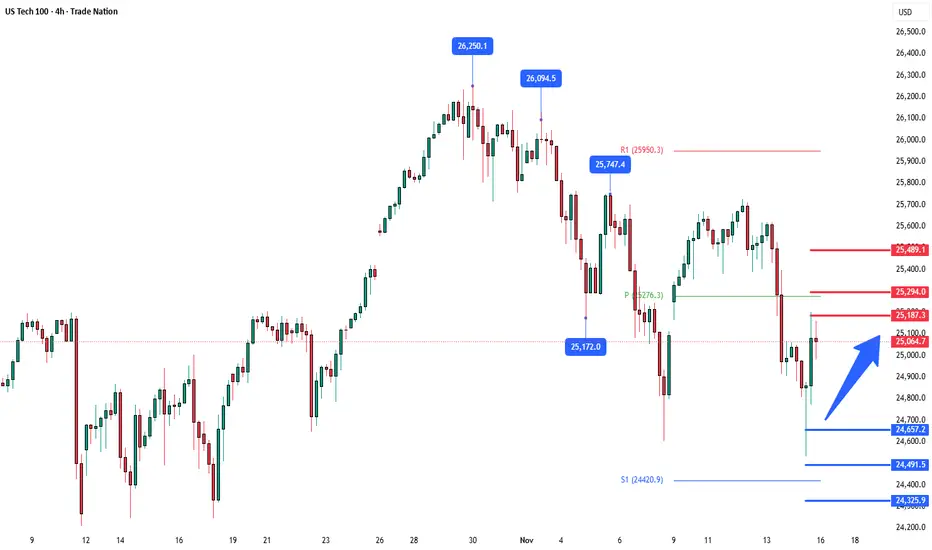
Resistance Level 1: 25180
Resistance Level 2: 25300
Resistance Level 3: 25500
Support Level 1: 24655
Support Level 2: 24490
Support Level 3: 24330
This communication is for informational purposes only and should not be viewed as any form of recommendation as to a particular course of action or as investment advice. It is not intended as an offer or solicitation for the purchase or sale of any financial instrument or as an official confirmation of any transaction. Opinions, estimates and assumptions expressed herein are made as of the date of this communication and are subject to change without notice. This communication has been prepared based upon information, including market prices, data and other information, believed to be reliable; however, Trade Nation does not warrant its completeness or accuracy. All market prices and market data contained in or attached to this communication are indicative and subject to change without notice.
Trade ideas

Still Selling USTEC????🔥 USTEC – Who’s Still Riding the Sells?
Posted my sell idea this morning…
Who’s still holding with me? 👇
Market followed beautifully — patience pays.
Let me know if you caught the move or are still in the trade. 💬📉

Nasdaq Short: Peak Confirmed; Bear Market ConfirmedIt is now clear that the bull market ended on 30th Oct and that we have already seen the first completed wave down for Nasdaq that unfolded in clear 5-wave structure. The sub-waves also showed clear 5-wave structure themselves.
We are currently in a wave 2 retracement that is facing the first real support-turned-resistance. However, take note that wave 2 can technically go all the way up to the start of wave 1 without invalidating the idea. So look out for reversal signal or confirmation before you short.

Is this OTE or the beginning of a bear market?Is this OTE or the beginning of a bear market?
ICT OTE Theory defines the .62 retracement of a given range as the Optimum entry for the continuation of the bullish trend. Seeking Liquidity above the previous high.
We can compare this to the supply and demand theory using SMA 10 20 50. The moving averages indicate. Price currently sits below the value area between the 10 and 20 and has reacted off the 50.
Which put us in No mans land.
the 10 & 20 being above the 50 indicate the a bullish Bias.
If we are going bearish then we want to see the 10 & 20 below or crossing the 50 and price below the 50. This would be a strong setup and signal to go short. with price targets of 24224 & 22683.
HTF analysis : The M,W,D charts are still extremely bullish.
Current Sentiment: You tube videos and News reports are warning of a reversal and/or short term bearish move lower.
My Conclusion: WE are Bullish until proven differently. Next week will either support my conclusion or prove otherwise. So Stay flat and/or hedge your current positions to protect yourself the market response.

US NAS 100 BIG FALLPreferably suitable for scalping and accurate as long as you watch carefully the price action with the drawn areas.
With your likes and comments, you give me enough energy to provide the best analysis on an ongoing basis.
And if you needed any analysis that was not on the page, you can ask me with a comment or a personal message.
Enjoy Trading ;)

Nasdaq Towards New All Time High, Buy-Stop TradeNasdaq bounced back upward after testing its support. Now going up, likely to make a new ATH.
We can take a 1:1 Buy trade here.

NAS100 H1 | Bullish Bounce off Key SupportNAS100 is falling towards our buy entry at 24,841, which is a swing low support level that aligns with the 161.8% Fibonacci extension level.
The stop loss is at 24,664, which is a swing low support level, while the take profit is at 25,102, which is a pullback resistance level.
Stratos Markets Limited (tradu.com/uk ):
CFDs are complex instruments and come with a high risk of losing money rapidly due to leverage. 68% of retail investor accounts lose money when trading CFDs with this provider. You should consider whether you understand how CFDs work and whether you can afford to take the high risk of losing your money.
Stratos Europe Ltd (tradu.com/eu ):
CFDs are complex instruments and come with a high risk of losing money rapidly due to leverage. 70% of retail investor accounts lose money when trading CFDs with this provider. You should consider whether you understand how CFDs work and whether you can afford to take the high risk of losing your money.

NASDAQ INDEX (US100): Time to Recover
US100 index dropped yesterday, as I predicted.
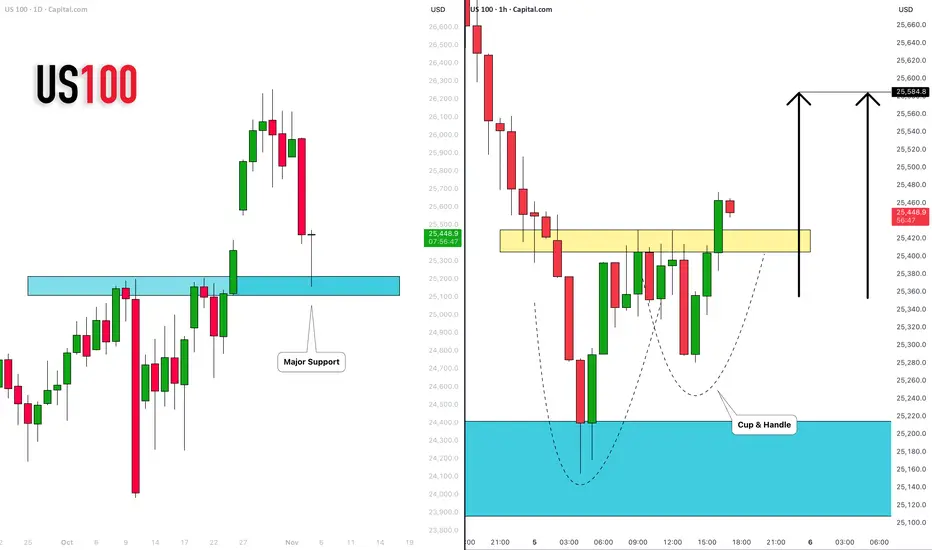
The market is recovering now, after a test of a major daily support cluster.
A formation of a cup & handle pattern on that and a breakout of its neckline
indicate a strong buying pressure.
With a high probability, the market will rise and reach 25580 level soon.
❤️Please, support my work with like, thank you!❤️
I am part of Trade Nation's Influencer program and receive a monthly fee for using their TradingView charts in my analysis.
Nasdaq: Sharp tech drop sets up critical support testNasdaq slid 2% yesterday in its sharpest tech-led drop since late summer—are we looking at a healthy correction, or could there be a deeper move ahead?
Caution returned to tech stocks as AI valuations and a handful of Big Tech earnings disappointed. The broader market also retreated, with traders watching for the next move from both the Fed and the earnings calendar.
Key drivers:
AI and semiconductor leaders like Nvidia, AMD, and Palantir led the selloff as investors questioned how much further the AI trade can run.
Hawkish remarks from multiple Fed officials raised doubts about any imminent rate cuts, even after the recent 25bp cut, fuelling profit-taking in volatile growth names.
Top Wall Street banks cautioned about stretched valuations, warning a 10–20% correction was possible as positioning remains crowded in mega caps.
Technically, the Nasdaq is pulling back from historic highs, testing median channel support with RSI retreating toward neutral. Key resistances are near 25500 and 25750, with support showing at 25200 and then under 25k.
Stay nimble and respect the potential range between 25450 and 25870 as pivotal for the next Nasdaq swing. Wait for strong resistance confirmation, but don’t ignore bounce risk if earnings and data surprise to the upside.
This content is not directed to residents of the EU or UK. Any opinions, news, research, analyses, prices or other information contained on this website is provided as general market commentary and does not constitute investment advice. ThinkMarkets will not accept liability for any loss or damage including, without limitation, to any loss of profit which may arise directly or indirectly from use of or reliance on such information.

US100 is in a strong uptrend and continues to set new highsUS100 is in a strong uptrend and continues to set new highs.
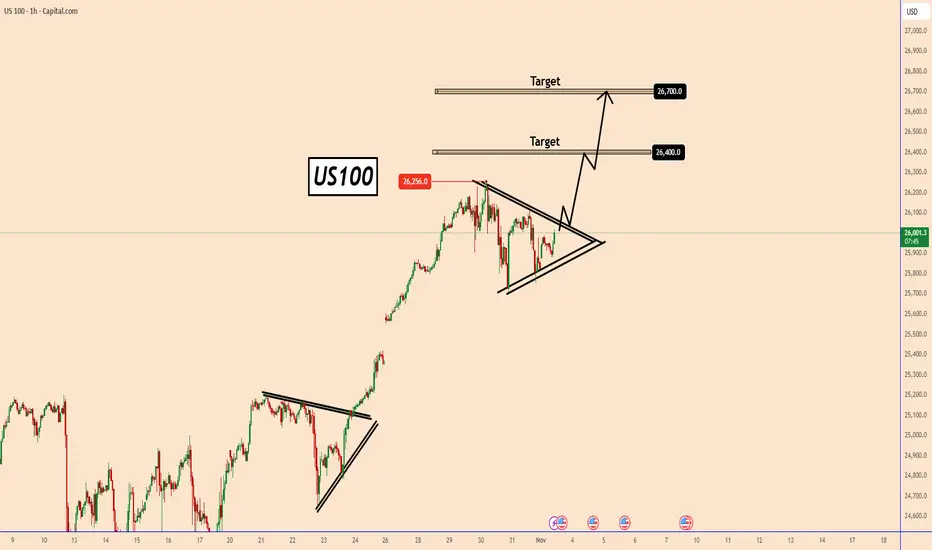
An all-time high was set last week near 26256, and there is a good chance that US100 will continue to rise.
The price is rallying again and once it moves above the triangle, another uptrend could begin.
Comments from the FED that they may cut rates further in the coming months are supporting the indices by raising hopes and the upward momentum is linked to the booming economy
Key targets:
26400 and 26700
You may find more details in the chart!
Thank you and Good Luck!
❤️PS: Please support with a like or comment if you find this analysis useful for your trading day❤️
NASDAQ Channel Up still stands buy needs a pull-back.Nasdaq (NDX) reached the top of its 5-month Channel Up and got rejected. It completed a +9.59% rise from the last 1D MA50 (red trend-line) bottom (Higher Low for the pattern), similar to the previous Bullish Leg.
The maximum a Bullish Leg has increased by inside this pattern is +10.87%. As a result, either now or just above it, the pattern would require a technical pull-back. The most usual buy signal is on its 4H MA200 (orange trend-line) and the most effective when the 4H RSI breaks below its oversold (30.00) barrier.
Our next Buy Zone is within the 0.382 - 0.5 Fibonacci retracement range.
-------------------------------------------------------------------------------
** Please LIKE 👍, FOLLOW ✅, SHARE 🙌 and COMMENT ✍ if you enjoy this idea! Also share your ideas and charts in the comments section below! This is best way to keep it relevant, support us, keep the content here free and allow the idea to reach as many people as possible. **
-------------------------------------------------------------------------------
💸💸💸💸💸💸
👇 👇 👇 👇 👇 👇

US100 – 1H Demand Zone Bounce | Bullish Reversal SetupTechnical Outlook
Price tapped into a clean 1H demand block.
Early bullish reaction from intraday support.
Potential retracement targets: 25,800 → 26,200
Setup invalid if price closes below 25,270
💰 Trade Plan (Example)
Entry: 25,380–25,400
Stop Loss: Below 25,270
Take Profit: 26,200
🧠 Bias: Bullish (Short-term bounce expected)
🎯 Focus on confirmation candle or structure break above 25,600 for momentum continuation.
#US100 #NASDAQ100 #Indices #TradingView #TechnicalAnalysis #PriceAction #SmartMoneyConcepts #SwingTrade #StockMarket #IndexTrading

US100 Reversal Map – Hull MA + Heikin Ashi Confirmation🧠 US100 / NASDAQ100 Profit Pathway Setup — The Thief’s Bullish Escape Plan! 💰🚀
📊 Market Bias: Bullish (Day Trade Setup)
The Thief Trader has spotted a golden pathway in the NASDAQ100 (US100)!
Here’s the breakdown of the plan — straight from the thief’s vault 🕵️♂️📈
🎯 Plan Overview
Bias: Bullish continuation confirmed
Technical Confirmation:
✅ Double Pullback on Hull Moving Average
✅ Retest Zone successfully defended
✅ Heikin Ashi Bullish Doji signaled a trend reversal confirmation
💡 Momentum is shifting upward — the trend has officially changed!
💎 Entry Strategy (Layered Thief Style)
The Thief Strategy applies a layered entry method — multiple buy limits to average into strength.
📥 Buy Limit Layers:
25,300
25,400
25,500
25,600
(Traders can adjust or add more layers based on risk appetite and confirmation zones.)
🛡️ Stop-Loss Setup
This is the Thief SL @ 25,100
⚠️ Note to Thief OG’s:
I’m not recommending my SL as your SL — always customize risk and secure your own bag. Manage your position with discipline and independence! 💼
🎯 Take-Profit Zone
Target: 26,200
🚨 The Police Barricade Zone acts as a strong resistance — overbought levels spotted and potential bull trap alert!
Kindly exit with profit before the officers arrive. 😎
⚠️ Note: Profit-taking is at your discretion. Book and Run!
📈 Related Pairs to Watch (Correlation Insight)
NASDAQ:NDX / CAPITALCOM:US100 / NASDAQ:QQQ : All mirror NASDAQ movement.
SP:SPX / AMEX:SPY : Often correlate with NASDAQ’s momentum (watch divergence for clues).
TVC:VIX : If volatility spikes, expect pullbacks on tech-heavy indices.
TVC:DXY : A weak dollar often fuels US100 bullish legs — keep an eye on it.
NASDAQ:AAPL / NASDAQ:MSFT / NASDAQ:NVDA : Leading drivers of NASDAQ — if they pump, the index follows. 💪
🧩 Key Insights
Hull MA alignment confirms momentum shift.
Retest + bullish Heikin Ashi Doji = market reversal confirmation.
Layered entries give flexibility in volatile intraday conditions.
Dynamic risk management is key — never marry a position.
✨ “If you find value in my analysis, a 👍 and 🚀 boost is much appreciated — it helps me share more setups with the community!”
#US100 #NASDAQ100 #ThiefTrader #DayTrading #IndexTrading #HullMA #HeikinAshi #LayeredEntries #TechnicalAnalysis #TradingSetup #PriceAction #MarketReversal #TradingCommunity #BullishPlan #SmartMoneyFlow #TradeIdeas #ThiefStrategy

Lower CPI Data – But Don’t Be Fooled by “Good” Inflation Numbers
Summary:
Markets cheered on lower CPI data, but the optimism might be misplaced. A softer inflation print gives the FED more flexibility, yet it also reduces the urgency for two rate cuts this year — something traders had already priced in.
Logic:
CPI came in weaker → short-term bullish sentiment.
But the real driver of rates is not CPI alone — it’s the balance between inflation and growth.
With inflation easing and economic activity still stable, the FED doesn’t need to cut twice in 2025.
Futures market (CME FedWatch) was pricing two cuts, which means that optimism is already priced into NASDAQ valuations.
Scenario Outlook:
If CPI remains stable and growth holds → only one cut or delay, not two.
That means tech valuations might need to reprice lower, especially high beta names.
NASDAQ could revisit support around 17,000–17,200 before finding balance again.
Trading View:
Watch for rejection near 18,000–18,200 (overextension after CPI rally).
Short-term bias: bearish / correction mode.
Long-term bias: still bullish, but needs valuation reset.
NAS100 SELL SIGNALWait for price to reach AOI & wait for rejection. Go on lower timeframes to confirm CHOCH. Wait for a signal of sellers coming in (bearish engulfing - maybe) then enter SELLS.

NAS100 1500 pips secured!Set up played out perfectly, breaking structure to during London session, sweep BSL, followed by internal IFVG to target 1500 pips

NAS100 Trade Set Up Nov 7 2025Price remains bearish so i will only looking for sells either after price sweeps internal BSL or London highs BSL before looking for 1m-5m IFVG/CISD to take sells to lower SSL levels

Nasdaq’s Battle at the Golden Support!On the NASDAQ 100 (NDX) chart, the index has pulled back after a strong rally to around 26,000, now testing a critical support zone near 25,000–25,200. This area is technically significant because it aligns with three key factors:
1. The main ascending trendline (blue line)
2. The 50-day moving average
3. A previous horizontal support level
In the short term, if the index holds above 25,000 and forms a bullish reversal candle, it could rebound toward the next resistance around 26,200–26,500. The stop loss for this bullish scenario would be a confirmed breakdown below 24,800.
However, if the price drops below 24,800 and stays there, a deeper correction toward 23,800–24,000 becomes likely — which aligns with the lower boundary of the medium-term channel.
From a long-term perspective, as long as the index trades above its 50-day moving average (currently around 20,300), the primary trend remains bullish, with potential upside targets between 27,000 and 28,000.
In short, this current zone represents the dividing line between trend continuation and a medium-term correction for the Nasdaq 100.

NasdaqBullish nasdaq as price went to restest the strong demand zone ans respected the price zone. Now more bullish momentum expected till our initial resistance.

US NAS 100Preferably suitable for scalping and accurate as long as you watch carefully the price action with the drawn areas.
With your likes and comments, you give me enough energy to provide the best analysis on an ongoing basis.
And if you needed any analysis that was not on the page, you can ask me with a comment or a personal message.
Enjoy Trading ;)

USNAS100 | Bearish Bias Holds Below 26,180 Ahead of Key DataUSNAS100 – MARKET OUTLOOK | Testing Pivot Zone, Awaiting Breakout 🇺🇸
The NASDAQ 100 is testing the pivot zone at 26,095–26,180, with momentum still bearish as long as it trades below this range.
🔽 Below 26,180: Bearish bias toward 25,890 → 25,700 → 25,340.
🔼 Above 26,180: Bullish reversal toward 26,500 → 26,850.
Pivot Zone: 26,095–26,180
Support: 25,890 · 25,700 · 25,350
Resistance: 26,320 · 26,500 · 26,850
USNAS100 remains bearish below 26,180, but a confirmed break above this level could signal the start of a new bullish leg.

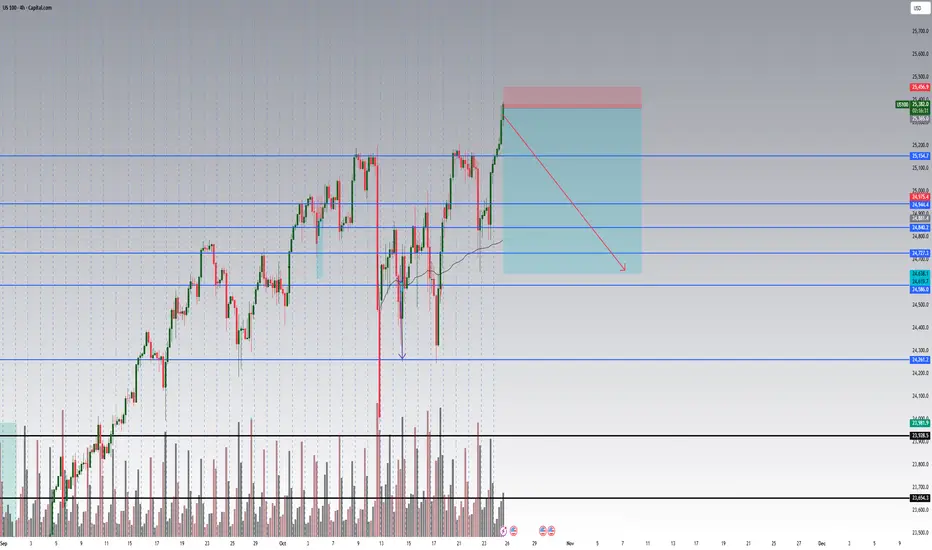
Nasdaq slides as volatility growsNasdaq was pushed down to the local support area, as the sentiment for the stock market has worsened due to a certain degree of deleveraging for stocks and investors moving to safety.
VIX (S&P 500 volatility index) has climbed above 20, which pushes the market’s volatility expectations higher and may trigger nervous reactions for tech stocks. The longest duration of downswings for Nasdaq is about 15-17 days, which allows us to project the downward move to a longer time period, with a further development of the bullish pullback, as shown at the chart.
Don't forget - this is just the idea, always do your own research and never forget to manage your risk!
