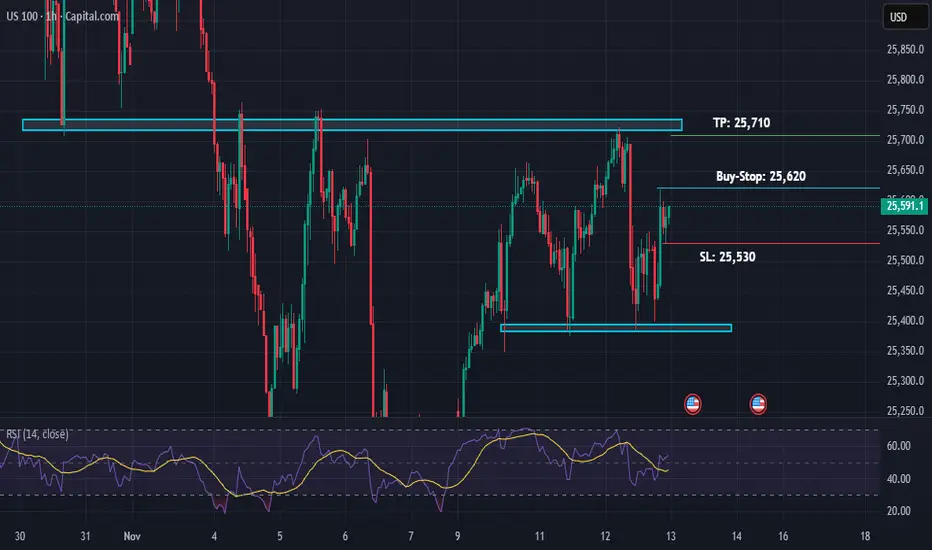
US100 Buy Trade within RangeUS100 has bounced back from its support and is now going to test the resistance. We can take a 1:1 long setup within this range.
Trade ideas
Institutional Zones Marked – Key Levels for Today 13 NovSharing the key price areas where the market previously showed strong institutional activity.
These levels highlight zones of interest based on structure, volume presence, and reaction points.
The chart marks:
• Potential buying zones
• Potential selling zones
• Reaction areas where liquidity was taken or mitigated
This is shared for market study and educational observation.
Price may react differently depending on volatility and session behaviour — always wait for confirmation from structure.
Not financial advice.

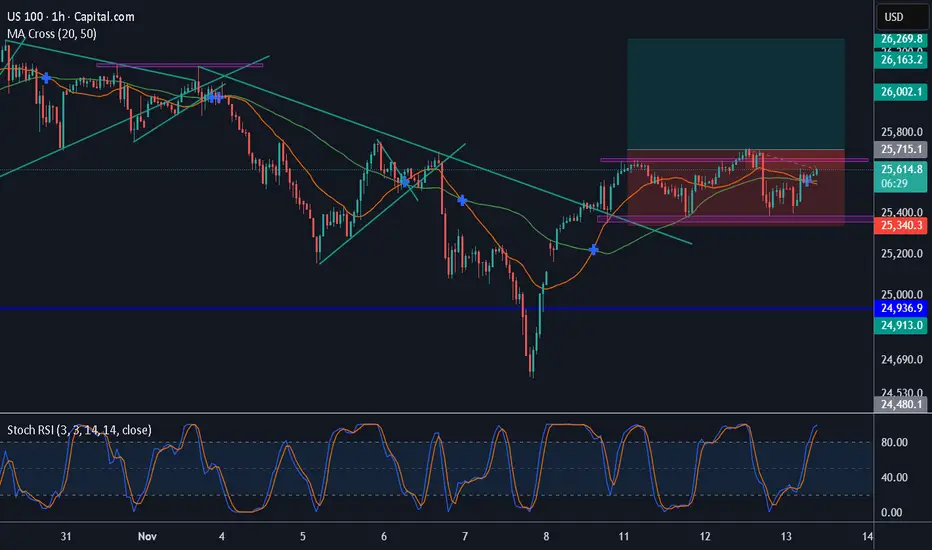
Trendline Break and double bottom The price has broken out of a bearish trendline followed by 2 pullbacks that formed a double bottom pattern and now the price looks to make a higher high and continue long
WE ONLY TRADE PULLBACKS
Comment your thoughts
USTEC - Shorts - In the money!!!!🔥 USTE/15 — Morning Sell Trades Explained (Who Caught These With Us?)
This morning our system printed two clean SELL signals — both highlighted on the chart.
📉 Sell #1 — Momentum Flush
Price tapped into a short-term premium zone and immediately rejected.
Our system triggered the orange SELL candle right at the top of the move.
Within minutes, momentum collapsed and delivered a clean downside push.
📉 Sell #2 — Premium Retrace + Rejection
After the first drop, price pulled back into our sell zone again.
The system flagged a second SELL opportunity (again marked in orange).
The rejection was instant — textbook continuation setup.
Both entries respected the exact rules of the system:
✔️ Trend alignment
✔️ Premium pricing
✔️ Momentum shift
✔️ Clear rejection candle
No guessing. No emotion. Just execution.
💬 Who caught these sells with us today?
Drop a comment below if you took the trades — or if you’re testing the system and saw the same signals!

NASDAQ IS BEARIcHcheck out this , on the higher time frame the price seems to be bearish and the market couldn't puch higher than the previous Lower high , so we expect the market to rebalance after grabbing enough liquidity

NAS100: Threshold Analysis & Decision FrameworkNAS100: Threshold Analysis & Decision Framework | November 12
Reference Point: 25,625 | 08:45 UTC+4
MARKET PREMISE
The Nasdaq 100 has stabilized within a confined bandwidth, presenting traders with a defined set of bifurcated outcomes. The micro-structure reveals a market in the midst of accumulation, where directional bias remains contested between competing institutional flows.
TECHNICAL ASSESSMENT MATRIX
Primary Trend (Dow Theory Lens): Uptrend remains intact; lower-bound support at 25,500 preserves bullish structure. Failure to maintain this floor signals potential regime shift.
Pattern Development: A Symmetrical Triangle is in formation across the 1H/4H timeframes. Contraction suggests breakout imminent—directional confirmation required.
Elliott Wave Interpretation: Wave IV consolidation underway. Upon completion, Wave V upleg anticipated toward fresh resistance territories.
Harmonic Configuration: Potential bearish Bat pattern exists if price recedes; conversely, completion of bullish Crab pattern supports upside continuation above 25,750.
INDICATOR CONFLUENCE TABLE
| Indicator | Timeframe | Status | Signal |
|-----------|-----------|--------|--------|
| Ichimoku Kumo | 4H | Price-Kumo Contact | Neutral-to-Bullish |
| RSI(14) | 4H | ~50 Median | Energy Stored |
| VWAP Proximity | Intraday | At Fair Value | Equilibrium |
| EMA(50) Stack | 1H | Bullish Alignment | Support Intact |
| Bollinger Squeeze | 30M | Band Tightening | Volatility Expansion Pending |
OPERATIONAL TRADE MATRIX
Bullish Engagement (Primary):
- Activation: Hourly close above 25,700 (Triangle apex breakout)
- Entry Coordination: 25,720–25,750
- Protective Stop: 25,580
- Profit Sequencing: 25,900 (T1) → 26,150 (T2)
- Risk-Reward Ratio: 1:2.4
Bearish Contingency (Secondary):
- Activation: Sustained close below 25,500 (Foundation breach)
- Entry Coordination: 25,480–25,450
- Protective Stop: 25,650
- Profit Sequencing: 25,250 (T1) → 25,000 (T2)
- Risk-Reward Ratio: 1:1.8
GANN TEMPORAL OVERLAY
Key cyclical windows on the 4D chart suggest consolidation resolution within the 12–15 hour window. Volume profile at the 25,650 level indicates potential liquidity pool; breakouts through this zone warrant heightened position management.
TRADE DIRECTIVE: Await breakout confirmation with concurrent volume expansion. Triangle compression suggests potential catalytic move. Disciplined position-sizing essential given binary outcome structure.
NASDAQ Long ConfirmationsShould price pullback to dig deeper into the highlighted support, look for long confirmations.

HELPFUL SUPPORT AND RESISTENCE INDICATORS & FVGI find these helpful and free as support and resistence thought id share

HELPFUL SUPPORT AND RESISTENCE INDICATORSI find these helpful and free as support and resistence thought id share
Close callWas waiting for this setup, everything ready, then price just left me behind, anyone in this?

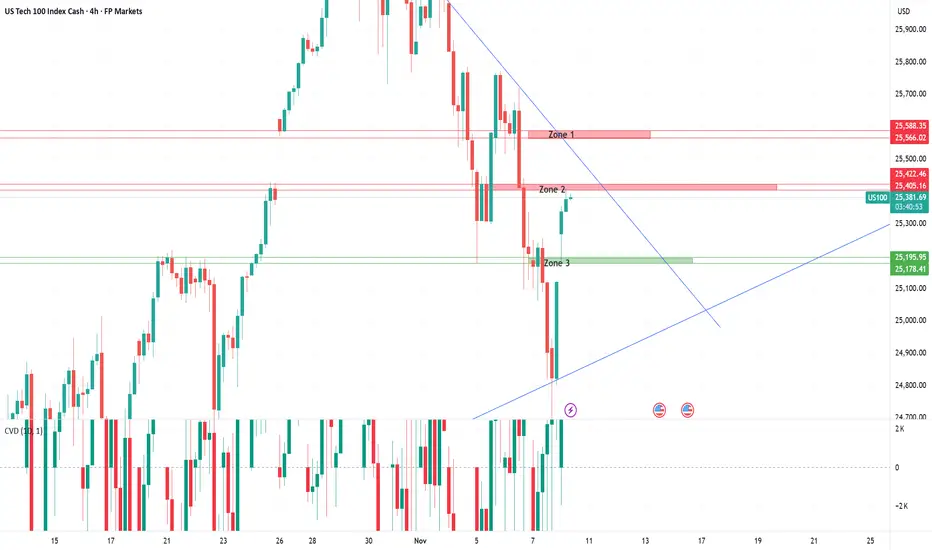
US100 – Trading within a battle of supply and demandUS100 – 4H Technical Zone Analysis
Overall, it remains challenging to define high-probability trading zones in the current environment. Price action is taking place near all-time highs, where volatility is elevated and historical reference points are limited. With sentiment shifting rapidly on macro headlines and thin data visibility, traders should treat each reaction zone with caution and focus on confirmation rather than anticipation.
Zone 1: Former Demand Turned Resistance
This area previously attracted strong buying interest, but sellers have since regained control, forcing price back below the level. The zone now acts as a clear resistance area where supply is likely to re-emerge. A confirmed rejection here would reinforce short-term bearish structure, while a clean break and hold above could signal that buyers are reclaiming dominance.
Zone 2: Minor Reaction Zone / Potential Supply Area
This zone represents a less-defined reaction area where a previous price gap formed, suggesting potential for renewed selling pressure if price revisits it. However, given the lack of strong historical structure, traders should approach this zone with caution and look for clear confirmation before positioning around it.
Zone 3: Former Supply Turned Support
This level previously acted as a ceiling where sellers pushed price lower before a decisive breakout occurred. Since that move, the area has flipped into a supportive base, marking the first meaningful demand zone beneath current price. As long as price holds above Zone 3, the broader structure remains constructive; a confirmed break below would indicate that buyers are losing control.
Macro Overview
The Nasdaq-100 continues to trade near record highs, supported by a mix of resilient economic data, easing inflation pressures, and improving global risk sentiment. The broader tone remains constructively bullish, though investors are increasingly aware that the rally is being sustained more by optimism than by hard data.
Last week’s key drivers included renewed progress in U.S.–China trade talks and a strong set of tech earnings, which reinforced confidence in the growth and AI-led segments of the market. Softer-than-expected inflation readings added fuel to the rally by reviving expectations of potential Fed rate cuts in early 2026. However, policymakers have since pushed back on those assumptions, warning that rate reductions are not guaranteed and that the central bank will remain data-dependent.
At the same time, the ongoing partial U.S. government shutdown continues to delay key macro releases such as employment and CPI reports, leaving both investors and policymakers with limited visibility. This data vacuum makes markets unusually sensitive to headlines and Fed commentary.
Personal Account vs Prop firm TradingHere’s where a lot of traders miss the point.
Prop firms sound good on paper — funded accounts, big leverage, short-term payout structure. That’s attractive to retail and newer traders. But let’s be honest — true SMC traders see deeper.
A prop firm is a classroom. A personal account is freedom.
⚖️ Prop Firms:
• Beginner-friendly, structured, and can help build discipline early.
• But they come with strict rules — max drawdown, time limits, no weekend holds, no high-impact news trading.
• These rules can kill genuine SMC plays, because Smart Money often holds setups that develop midweek and deliver through Friday.
• Some prop firms even close trades automatically during volatile pullbacks — meaning your well-timed institutional entry could be cut off early.
Prop firms test you on rule-following, not market mastery.
💼 Personal Accounts:
• You control risk, timing, trade management, and exposure — full freedom.
• You can hold trades through the weekend, manage partials your way, and let multi-day structures complete.
• You can size positions sustainably — not recklessly, but with intent — and manage equity growth over time.
• It demands mastery, discipline, and emotional control — but that’s the essence of becoming a true trader, not a funded participant.
“Prop firms build discipline. Personal accounts build legacy.”
🧭 My Take:
I respect prop firms — they have their place. But I’m a personal account believer.
Why? Because Smart Money Concepts require freedom to express trade ideas dynamically, without artificial restrictions.
A true SMC trader isn’t trying to pass a challenge — he’s trying to understand and move with the market.
Prop firms serve the student. Personal accounts serve the master.
✍️ Closing Statement
“The real education starts when you stop testing history and start studying live footprints.
Prop firms can train your discipline, but personal mastery is built when your decisions shape your own equity.
Trading is not about probabilities — it’s about reading precision, cause, and intent. That’s the Smart Money way.”

NASDAQ 100-15m Bullish Setup/RiskyChartStructure Breakdown:
Liquidity Sweep: The equal lows taken out near 25,050 indicate engineered liquidity collection.
Displacement: Bullish impulse broke short-term structure, confirming buyers stepping in.
Fair Value Gap (FVG): The shaded blue zone marks the imbalance target where price may rebalance before deciding next direction.
Target Zone: 25,420–25,450 (FVG midpoint / supply area)
Invalidation: A clean 15m close below 25,050 would invalidate bullish bias.
Setup Type: Liquidity Sweep + Displacement + FVG Target
Entry Idea: Buy within the discount range (gray zone) after bullish confirmation
Take Profit: 25,420
Stop Loss: Below 25,050
Risk–Reward: ≈ 1:3 potential

US100 FREE SIGNAL|SHORT|
✅US100 is pushing towards the premium supply zone and after a liquidity sweep above short-term highs we will expect continuation toward the next downside inefficiency as sell-side liquidity gets targeted on Monday!
—————————
Entry: 25,115.5$
Stop Loss: 25,200$
Take Profit: 24,900$
Time Frame: 3H
—————————
** SHORT🔥
✅Like and subscribe to never miss a new idea!✅

US Tech 100 (1H) Trade PlanUS Tech 100 (1H) Trade Plan
Price has completed a clean sweep of sell-side liquidity and is now showing strong displacement toward the upside. The recent break in structure confirms short-term bullish intent.
If price returns to the fair value gap or discount zone, I’ll look for confirmation to enter in alignment with the intraday bullish flow.
My first target remains the internal liquidity zone, and the potential extended target is the previous day’s high where buy-side liquidity rests.

nas100🔹 Overall Outlook and Potential Price Movements
In the charts above, we have outlined the overall outlook and possible price movement paths.
As shown, each analysis highlights a key support or resistance zone near the current market price. The market’s reaction to these zones — whether a breakout or rejection — will likely determine the next direction of the price toward the specified levels.
⚠️ Important Note:
The purpose of these trading perspectives is to identify key upcoming price levels and assess potential market reactions. The provided analyses are not trading signals in any way.
✅ Recommendation for Use:
To make effective use of these analyses, it is advised to manually draw the marked zones on your chart. Then, on the 15-minute time frame, monitor the candlestick behavior and look for valid entry triggers before making any trading decisions.

NAS100 Rejection last 4H candle# 📊 NAS100 (SPOT NASDAQ100) Rejection TECHNICAL ANALYSIS 🎯
## Week of November 10-14, 2025 | Intraday & Swing Trade Setup
Close Price: 25,121 | Entry Point: November 8, 2025, 12:54 AM UTC+4 💹
---
## 🔍 EXECUTIVE SUMMARY - MULTI-TIMEFRAME PERSPECTIVE
The Nasdaq-100 index exhibits a compelling convergence of technical signals across all analyzed timeframes. Elliott Wave structure suggests we're navigating wave cycles with potential breakout scenarios emerging through harmonic pattern confirmations. Bollinger Bands are contracting, indicating volatility consolidation before directional expansion. RSI readings across 5M-1H timeframes show overbought extremes transitioning to neutral zones, creating premium entry opportunities for disciplined traders. Volume analysis reveals institutional interest patterns correlating with Ichimoku Cloud positioning.
---
## 📈 TIMEFRAME-BY-TIMEFRAME ANALYSIS
### 5-MINUTE (Intraday Scalping) ⚡
Candle Pattern: Japanese candlesticks reveal micro-trend reversals with consecutive hammer formations suggesting buyer rejection zones. Evening Star patterns detected at resistance levels.
Elliott Wave: Sub-wave completion suggests wave 4 consolidation before wave 5 impulse move. Wave structure favors breakout traders targeting 25,280-25,420 resistance confluence.
Bollinger Bands: Middle band acts as dynamic support; lower band rejection patterns create high-probability short setups. Band squeeze indicating imminent volatility breakout.
RSI (14): Oscillating between 35-65 range—avoiding extremes. Divergences between price highs and RSI highs signal potential reversals at 25,180 and 25,240 levels.
Support & Resistance: Micro S/R zones at 25,095 | 25,140 | 25,180 | 25,220 | 25,280. Volume nodes clustered around 25,150.
VWAP: Price oscillating around session VWAP—each touch generates scalp opportunity. Aggressive traders fade upper band extremes.
### 15-MINUTE (Quick Swing) 🎢
Candlestick Analysis: Three-candle patterns emerging—flag continuation structures with potential for 60-80 pip breakouts. Engulfing bars confirming directional bias shifts.
Harmonic Patterns: Gartley Pattern formation detected—potential reversal zone (PRZ) at 25,165-25,195. Risk-reward ratio favorable at 1:2.5 for harmonic traders.
Wyckoff Theory: Accumulation phase evident with volume concentration and price consolidation. Distribution signs emerging—caution at resistance clusters.
Bollinger Bands: Band squeeze tightening—historical data shows 40-120 pip moves follow. Upper band resistance at 25,285; lower band support at 25,085.
Volume Analysis: Volume profile reveals point of control (POC) at 25,140—high-probability rejection zone. Volume surge required for breakout confirmation above 25,250.
Ichimoku Cloud: Price above cloud (bullish). Tenkan-sen at 25,205 acts as dynamic support. Kijun-sen (25,160) provides secondary support for pullback traders.
### 30-MINUTE (Intraday Swing) 🔄
Pattern Formation: Symmetrical Triangle formation with apex target at 25,290. Ascending triangle variant shows bullish bias—breakout above 25,270 targets 25,380-25,420 extension.
Dow Theory: Confirming higher highs & higher lows structure. Secondary trend remains bullish; pullbacks to moving average (EMA 20) present optimal entry zones.
RSI Divergence: Positive RSI divergence confirmed—price making lower lows while RSI forms higher lows at 42 level. Classic reversal setup targeting 25,260 minimum.
Exponential Moving Average: EMA 9 above EMA 21—bullish alignment. Price hugging EMA 9 (25,125) indicates strong intraday uptrend. EMA 50 (25,080) provides stop-loss anchor.
Support Zones: 25,080 (EMA 50) | 25,120 (EMA 9) | 25,160 (Kijun-sen) | 25,200 (Demand Zone)
Resistance Zones: 25,250 (Breakout trigger) | 25,290 (Triangle apex) | 25,350 (Weekly resistance)
### 1-HOUR (Core Swing Trade) 🎯
Elliott Wave Complete Picture: Primary trend shows potential Wave 3 completion near 25,350. Wave 4 correction (current consolidation) targeting 25,140-25,180 support zone. Wave 5 breakout anticipated—target: 25,450-25,520.
Pennant Pattern: Bullish Pennant formation within consolidation—breakout confirmation above 25,280 validates pattern. Minimum target: 25,450 (measured move from pole).
Bollinger Bands (1H): Upper band at 25,380 represents squeeze breakout target. Middle band (25,200) = bullish support. Lower band rejection creates risk-reward optimization point.
VWAP Daily: Price trading above VWAP—bullish gradient confirmed. Each hourly candle close above VWAP strengthens trend continuation probability. Rejection below VWAP = caution signal.
Volume Profile: Heavily traded at 25,150-25,180 (support) and 25,240-25,280 (resistance). Imbalances favor upside—low volume zone above 25,300 suggesting vacuum to fill.
Ichimoku Alignment: Price above Senkou Span A & B—cloud thickness indicates strong support. Chikou Span lag above candles = bullish confirmation. Cloud color shift (bullish green) reinforces uptrend.
Gann Theory: 45-degree angle trendline from swing low confirms rally angle. Resistance at 38.2% Fibonacci extension (25,280) precedes aggressive breakout phase.
### 4-HOUR (Swing Trade Foundation) 💼
Daily Chart Alignment: 4H timeframe shows potential Inverse Head & Shoulders pattern—right shoulder completing (current zone: 25,120-25,180). Breakout above 25,280 neckline targets 25,450-25,520 extension.
Wyckoff Accumulation: Institutional buying evident—small barometer move (SBM) triggers accumulation phase. Spring tests below support anticipated 25,080-25,100 zone.
RSI 4H: RSI at 54-60 range—neutral bullish. Still room for upside extension without extreme overbought. RSI above 70 targets 25,350+. Below 30 requires defensive posturing.
Cup & Handle Pattern: Potential bullish Cup formation completing—handle stabilization near 25,150-25,200. Breakout above handle (25,280) targets cup depth extension = 25,420.
EMA Ribbon: EMA 8, 13, 21, 50, 200 = bullish alignment. Compression and expansion cycles indicate momentum phases. Ribbon support at 25,120 = critical hold level.
Support Tiers 4H: 25,050 (structural) | 25,120 (EMA 8) | 25,160 (EMA 21) | 25,200 (demand cluster)
Resistance Tiers 4H: 25,280 (key breakout) | 25,350 (extension) | 25,420 (major target) | 25,500 (weekly projection)
### DAILY CHART (Swing Trade Thesis) 📅
Macro Elliott Wave: We're potentially in Wave 3 of a larger cycle—still room for aggressive expansion. Wave structure favors break of 25,350 targeting 25,500-25,650 daily close.
Double Bottom Recognition: Historical pattern shows Double Bottom formation near 25,000 support—confirmed breakthrough above 25,250 neckline triggered. Second target near 25,450-25,500.
Bollinger Bands Daily: Upper band at 25,480 = realistic daily target. Mean (25,200) = healthy pullback support. Band slope indicates volatility expansion—expect 250-400 pip daily ranges.
Volume Signature: Daily volume profile shows strong buying volume bar at 25,050-25,100 zone (institutional accumulation marker). Selling volume decreasing—demand controlling.
Ichimoku Daily: Cloud thickness growing—bullish trend strengthening. Cloud support around 25,150-25,200. Kumo Breakout anticipated—targets cloud top edge at 25,350-25,420.
Harmonic Analysis: Butterfly Pattern potential completion—PRZ at 25,280-25,320 suggests reversal zone OR breakout confirmation. Confluence amplifies probability.
Gann Angles & Fibonacci: 50% retracement (25,100) + 61.8% extension (25,420) = key reversal zones. Gann fan angles suggest 25,350-25,400 as structural resistance before continuation.
Key Daily Support: 25,000 (psychological/structural) | 25,050 (accumulation) | 25,140 (weekly midpoint) | 25,200 (demand zone)
Key Daily Resistance: 25,280 (breakout trigger) | 25,350 (extension) | 25,420 (measured move) | 25,500 (weekly target)
---
## 🎪 TRADING SETUP PLAYBOOK - NOV 10-14
### BULLISH SCENARIO (Probability: 72%) ✅
Trigger: 4H candle close above 25,280 + volume surge + RSI above 55
Entry Zone: 25,200-25,250 (with breakout confirmation)
Target 1: 25,350 | Target 2: 25,420 | Target 3: 25,500
Stop Loss: 25,120 (below EMA support)
Risk/Reward: 1:2.8 (excellent entry)
### BEARISH SCENARIO (Probability: 28%) ⚠️
Trigger: Daily close below 25,200 + volume increase + RSI divergence
Entry Zone: 25,280-25,300 (short setup)
Target 1: 25,200 | Target 2: 25,140 | Target 3: 25,050
Stop Loss: 25,350 (above resistance)
Risk/Reward: 1:2.1 (acceptable but lower probability)
---
## ⚠️ VOLATILITY & OVERBOUGHT/OVERSOLD CONDITIONS
Current Volatility Status: Moderate compression → Expect expansion soon
5M/15M: RSI in 40-65 range (neutral)—room for 25-40 pip moves
30M/1H: RSI near 55-60 (bullish bias, not extreme)
4H: RSI 54-62 range—still room to run without overbought
Daily: RSI 58-68 (approaching caution zone)—be defensive if daily RSI>75
Overbought Recognition Points:
Watch for RSI>75 combined with Band upper rejection + Ichimoku cloud top break fails. Take profits on technical extremes.
Oversold Setups:
RSI<30 on 1H + price below EMA 50 = high-probability bounce back to 25,200-25,250.
---
## 🎯 ENTRY & EXIT OPTIMIZATION
### OPTIMAL ENTRY TIMING
For Bullish Scalpers (5M): RSI bounce from 40-45 zone after Band lower touch = 15-25 pip scalp target
For Swing Traders (15M-30M): 15M candle close above 25,250 with 4H alignment = 60-120 pip swing target
For Core Swings (1H-4H): 4H pennant breakout above 25,280 on volume = 150-300+ pip target (hold 24-48 hours)
For Position Traders (Daily): Daily close above 25,350 = continuation play targeting 25,500-25,650 (hold 5-7 days)
### EXIT STRATEGIES
Take Profit Levels: 1. Fibonacci 38.2% = 25,280 | 2. Harmonic PRZ = 25,320 | 3. Daily Band upper = 25,420 | 4. Weekly target = 25,500
Stop Loss Placement: Below most recent swing low + 10 pips (risk management priority)
Trailing Stops: Activate at 25,350—trail with 40-50 pip buffer for 4H+ trades
Breakeven Exit: Move stops to entry after 1:1 risk/reward achieved—reduce emotional trading
---
## 🔔 REVERSAL & BREAKOUT RECOGNITION CHECKLIST
### REVERSAL SIGNALS TO WATCH:
RSI divergence (lower highs on price, higher lows on indicator)
Candlestick engulfing patterns at resistance/support zones
Volume breakdown (declining volume on breakout attempts)
Ichimoku Cloud rejection (price fails to penetrate cloud layer)
Harmonic pattern completion (Gartley/Butterfly PRZ exact hit)
Elliott Wave 5th wave failure (truncation pattern)
### BREAKOUT CONFIRMATION RULES:
Close beyond resistance on high volume (>20% volume increase)
RSI confirms breakout direction (above 55 for bullish, below 45 for bearish)
VWAP crosses align with directional move
Bollinger Band breakout with band expansion (squeeze release)
Multiple timeframe confluence (5M + 15M + 1H aligned)
Ichimoku Cloud break (price clears all clouds smoothly)
---
## 💡 WEEK FORECAST SUMMARY - NOV 10-14
Monday (10th): Consolidation continuation—watch for range break direction. European open volatility catalyst expected.
Tuesday-Wednesday: Breakout window opens—25,280 represents key decision point. Expect 150-250 pip daily moves.
Thursday: Potential pullback/consolidation after breakout (profit-taking). Support retest of 25,250-25,200.
Friday (14th): Weekly close pattern formation—extension run anticipated if above 25,350. Week target: 25,420-25,500.
---
## 📍 CRITICAL CONFLUENCE ZONES
25,080-25,100: Major support (accumulation zone, Wyckoff spring testing area)
25,140-25,180: Secondary support (EMA 9, Ichimoku, volume POC)
25,200-25,250: Entry zone (demand cluster, Cup handle support)
25,280-25,320: KEY BREAKOUT ZONE (all timeframe resistance, harmonic confluence)
25,350-25,420: Primary upside target (Elliott Wave 5, daily Band, measured move extension)
25,500+: Weekly resistance/extension target
---
## 🏆 RISK MANAGEMENT SUMMARY
✅ Never risk >2% account per trade
✅ Use 1:2+ risk/reward minimum on all entries
✅ Scale profits at 1:1 and 1:2 levels
✅ Maintain tight stops (10-15 pips on 1H trades)
✅ Avoid breakout FOMO—wait for close confirmation
✅ Respect daily support zones—psychological holds matter
---
## #TRADINGSETUP #NAS100 #TECHNICALANALYSIS #NASDAQ100
#ELLIOTTWAVE #HARMONICPATTERN #BREAKOUTTRADING #SWINGTRADER
#DAYTRADING #INTRADAY #FOREX #TRADING #ANALYSIS #TRADINGVIEW
#BOLLINGER BANDS #RSI #ICHIMOKU #VWAP #TRADINGSTRATEGY
#WYCKOFFMETHOD #GANNTHEORY #DOWTHEORY #TECHNICALS
#SUPPORTANDRESISTANCE #VOLUMEANALYSIS #OVERBOUGHT #OVERSOLD
---
Disclaimer: This analysis is educational only. Always conduct your own research and use appropriate risk management. Past performance ≠ future results. Trade at your own risk.
Analysis Created: November 8, 2025 | Valid Through: November 14, 2025

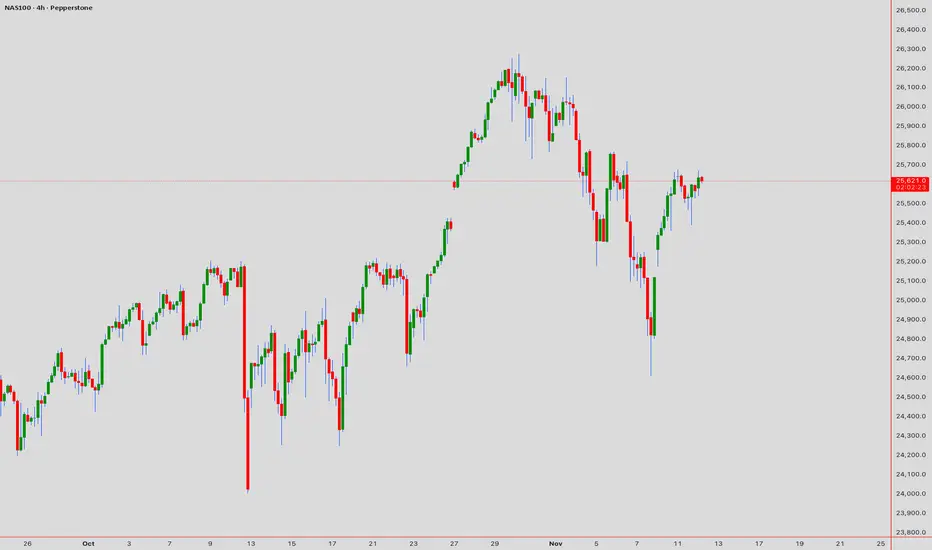
Nasdaq completed market cycle and bounced back from supportNasdaq completed market cycle and bounced back from support.

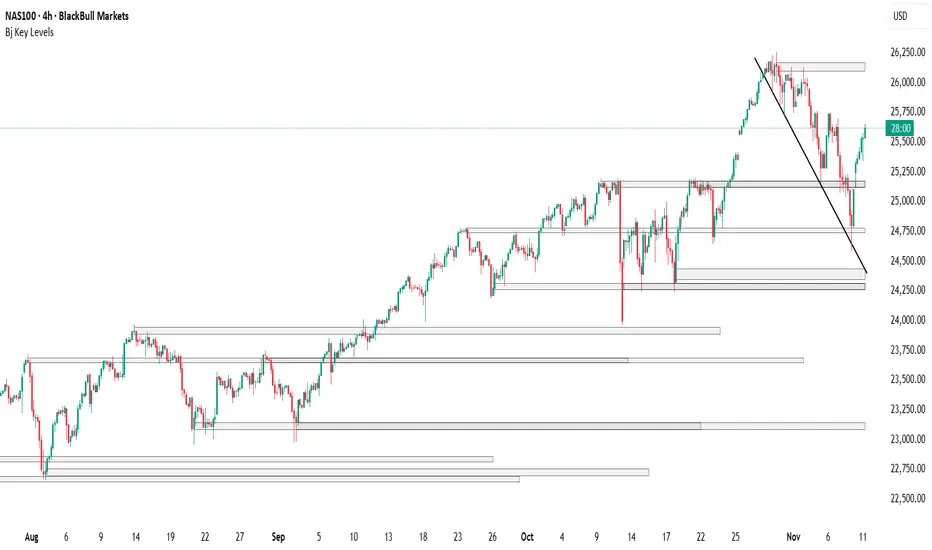
NAS100 - BullishNAS100 is bullish on 4H timeframe is currently bouncing from trendline support. Buying at current market price.

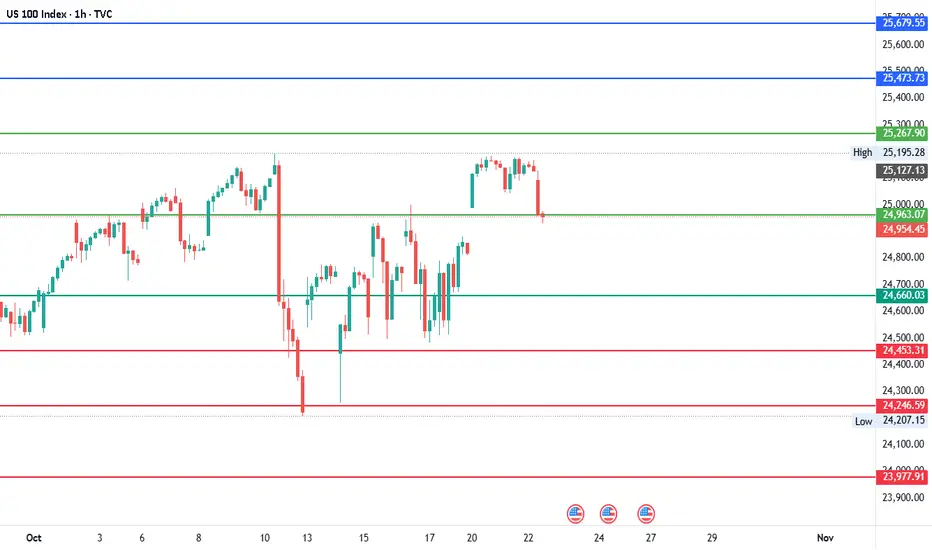
#NDQ - Short-term Range $26,216 - $23,709 | 1000 Points Move?Date: 22-10-2025
#NDQ - Current Price: $24,963.00
Pivot Point: $24,963.07 Support: $24,660.03 Resistance: $25,267.90
Upside Levels:
L1: $25,473.73 L2: $25,679.55 L3: $25,948.23 L4: $26,216.91
Downside Levels:
L1: $24,453.31 L2: $24,246.59 L3: $23,977.91 L4: $23,709.23
#TradingView #Nifty #BankNifty #DJI #NDQ #SENSEX #DAX #USOIL #GOLD #SILVER
NAS100 Trade Set Up Nov 7 2025Price remains bearish so i will only looking for sells either after price sweeps internal BSL or London highs BSL before looking for 1m-5m IFVG/CISD to take sells to lower SSL levels

Nasdaq Swing bullish setup4 hour
fibonacci Retracement 50% and 60%
1 hour
Wait for trend reversal
RRR 1:3 and hold for 1:5

NAS100 H4 | Bearish Reaction off FVGNAS100 is now rising towards our sell entry at 25,883, which aligns with the H4 Fair Value Gap and 71% Fibonacci retracement. We shall see how price reacts to this area after it breaks through the previous 2 swing high resistance levels.
The stop loss is at 26,167, which is a swing high resistance level, while the take profit is at 25,313, which is a swing low support level.
Once price reacts bearishly, do take note of the above swing low support level at 25,581 as well.
Stratos Markets Limited (tradu.com/uk ):
CFDs are complex instruments and come with a high risk of losing money rapidly due to leverage. 68% of retail investor accounts lose money when trading CFDs with this provider. You should consider whether you understand how CFDs work and whether you can afford to take the high risk of losing your money.
Stratos Europe Ltd (tradu.com/eu ):
CFDs are complex instruments and come with a high risk of losing money rapidly due to leverage. 70% of retail investor accounts lose money when trading CFDs with this provider. You should consider whether you understand how CFDs work and whether you can afford to take the high risk of losing your money.
