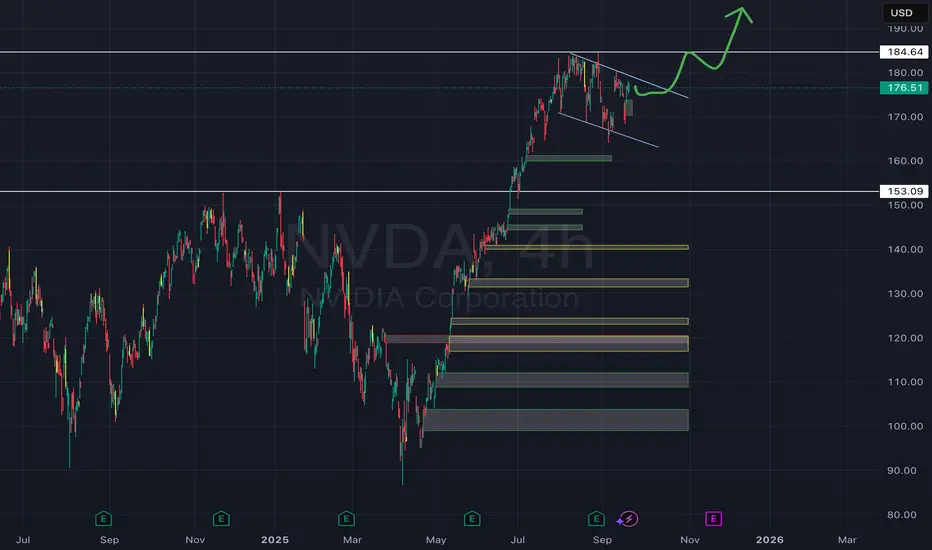
$NVDA İS BREAKİNG UPNASDAQ:NVDA After breaking downtrend line sometimes it is like a default move the retest previous downtrend. expecting to get more strengt in this area and test 184.50 ATH. This setup is one of my farovite one.
NVDA trade ideas

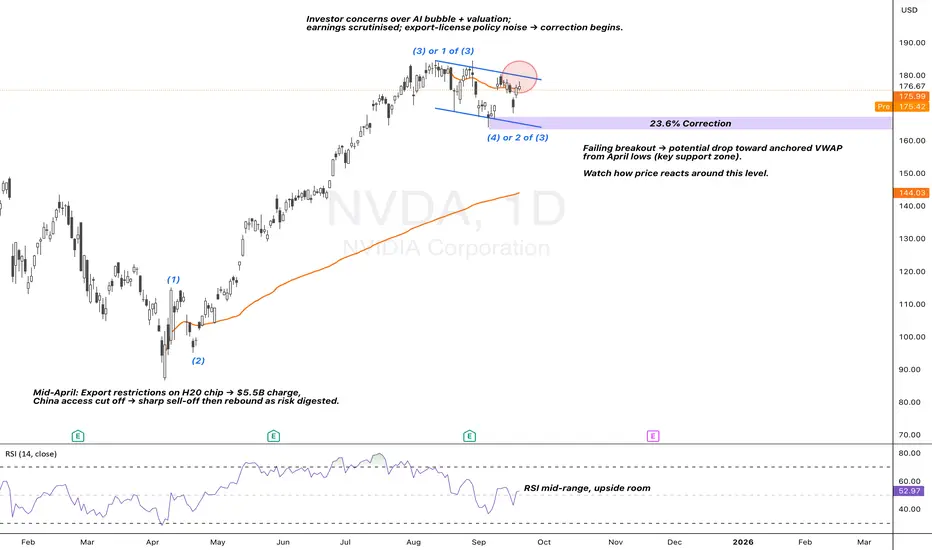
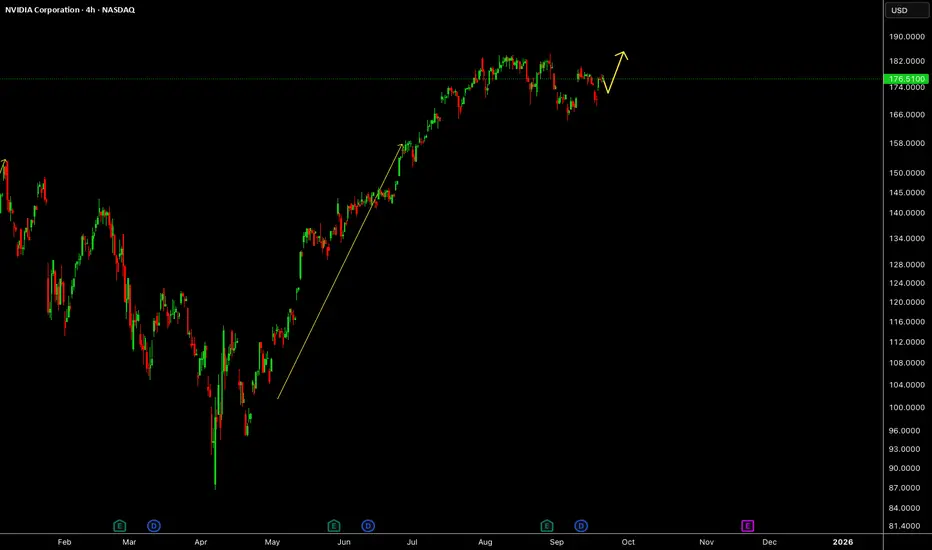
NVDA | Wave (3) in Play at Key Consolidation ZoneNVIDIA’s rally since April was powered by AI infrastructure demand and a rebound in risk sentiment after tariff and export-control concerns were digested. Strong hyperscaler capex and global AI partnerships reinforced the bottom-up story, while a broader tech bid lifted growth equities. Yet, the same catalysts pose risks: valuation stretch, regulatory noise, and questions on AI monetisation timelines leave room for volatility.
Technical Lens:
Price action suggests NVDA is tracking a larger wave (3). However, the sub-wave structure remains unproven, with only a shallow 23.6% retracement, leaving scope for further correction. Current consolidation sits at a decision point, supported by RSI, which remains mid-range with room to extend higher.
Scenarios:
If breakout holds: Momentum can carry into the next impulsive leg of wave (3), supported by structural demand.
If breakout fails: Price could rotate lower toward the anchored VWAP from April 2025 lows, a key support zone.
Catalysts:
Ongoing AI-driven hyperscaler spend and sovereign partnerships (upside).
Renewed U.S.–China export restrictions or capex digestion (downside).
Macro policy shifts and market positioning into year-end.
Takeaway:
This is a consolidation decision point within wave (3). Breakout = continuation, failure = correction toward April VWAP support.
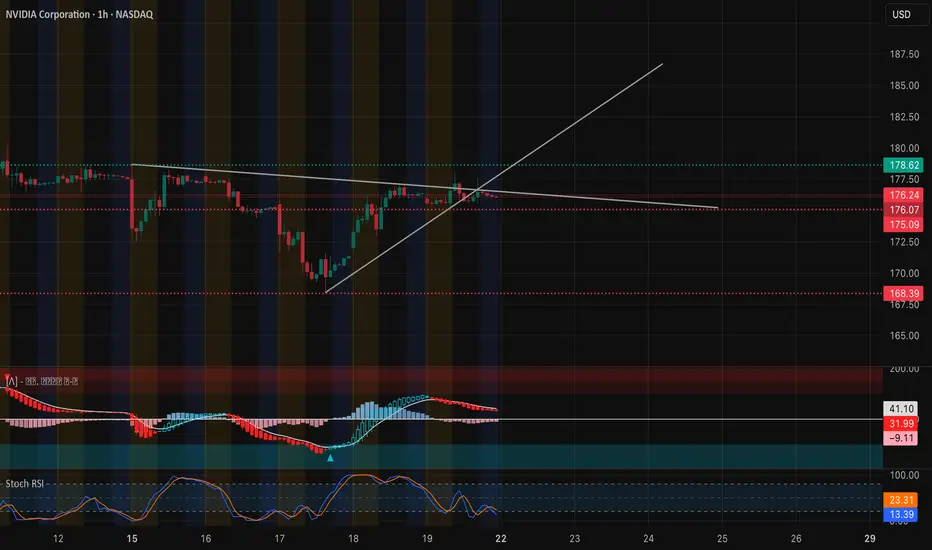
NVDA LONG TRADING PLANDivergence on 1H RSI. He is Making a Support there. So there is o much chance it will brake the HH. But i am my canceling my Main order. i will wait if at my Entry there is Divergence or any news then i will Short there. Question me i will answer.

Higher 4 longer.Bull flag here on the longer time framez should play out. Maybe chop sidewayz then push back to ATH. AI nerrative still strong n no reason 2 go heavy shortin this scam. If u short u better take ur money on those small downturnz cause trust me, they dont last!
$NVDA: The River Changes Course - A Mean Reversion IdeaThe Technical Landscape
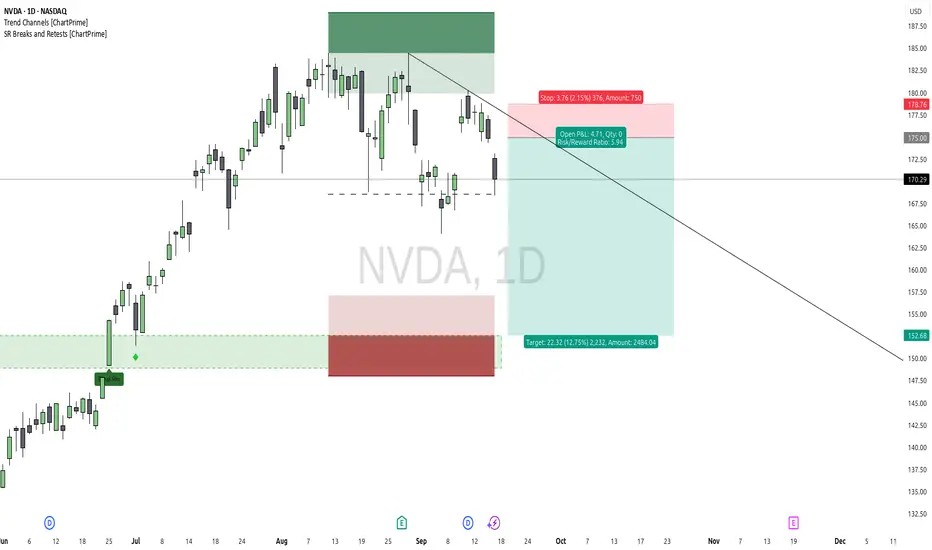
Our prior long setup on NASDAQ:NVDA was invalidated, providing us with the invaluable information that the bullish momentum has stalled. Following the Fed's announcement, the market's breath has changed. We now see a potential downtrend forming on the daily chart, with price creating lower highs and respecting a new descending trendline. The bears, who have been slumbering, appear to be waking up.
Instead of fighting this new current, we look to flow with it. The thesis is no longer about bullish continuation, but about a potential reversion to the mean. Price has a memory, and we are targeting a return to the scene of the previous major breakout, the demand zone around the $152 level. This is simply one piece of the puzzle, viewed without bias or ego.
The Philosophy - Listening When The Market Speaks
The trend is your friend, until it isn't. Our job is not to predict when the friendship will end, but to recognize when the dynamic has changed and act accordingly.
Our previous attempt at a long wasn't a failure; it was the market telling us, at a very small cost, that our hypothesis was incorrect for the current conditions. A limitless trader embraces this information with gratitude, for it protects us from the much greater cost of being stubborn. We are not "flipping" from bull to bear out of emotion. We are simply listening, adapting, and aligning with the price action that is presenting itself right now. Don't be a salmon, stubbornly fighting a new and powerful current. A limitless trader considers all outcomes, and right now, the path of least resistance appears to be pointing down.
An Illustrative Setup
Style: Short / Mean Reversion
Entry: An area of confluence around $175, near the descending trendline resistance.
Stop Loss: A defined stop above recent highs and trendline resistance at $178.75. If price breaks this level, our bearish thesis is invalidated.
Take Profit: Targeting the area of prior breakout, around $152.50.
Risk/Reward: Approximately 1 : 5.9
A safer, more conservative entry could be sought on a break and hold below the $168 support level, but always remember to manage your own risk based on your personal strategy.
Disclaimer: This is not financial advice. It is for educational and informational purposes only. Please conduct your own research and manage your risk accordingly.
$NVDA - $280 PT WEEKLY BULL FLAGStay Positioned with Nvidia's Weekly Bullish Chart. A Bull Flag is setting up with an imminent breakout. Long/Short Ratio is also very bullish at almost 60%. Price Target is $280. Remember Pole length of the flag = extended measured move at the breakout point of the flag.

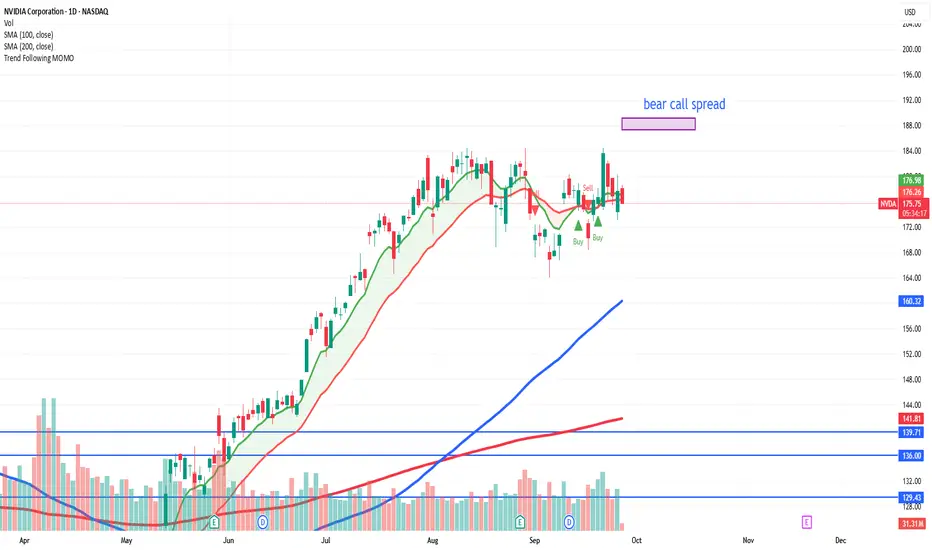
nvda bcs looks like exhaustion buying 4 days ago. Expecting NVDA to rest and consolidate with the market. Likely be able to btc this position for a small win in a week
if not, sideways action or bear action will turn this into a winner
$200 PTStrong move with Open AI investment announcement. Barely made a new 52 week high, looking for a strong continuation tomorrow; $200 price target as next milestone in price discovery.

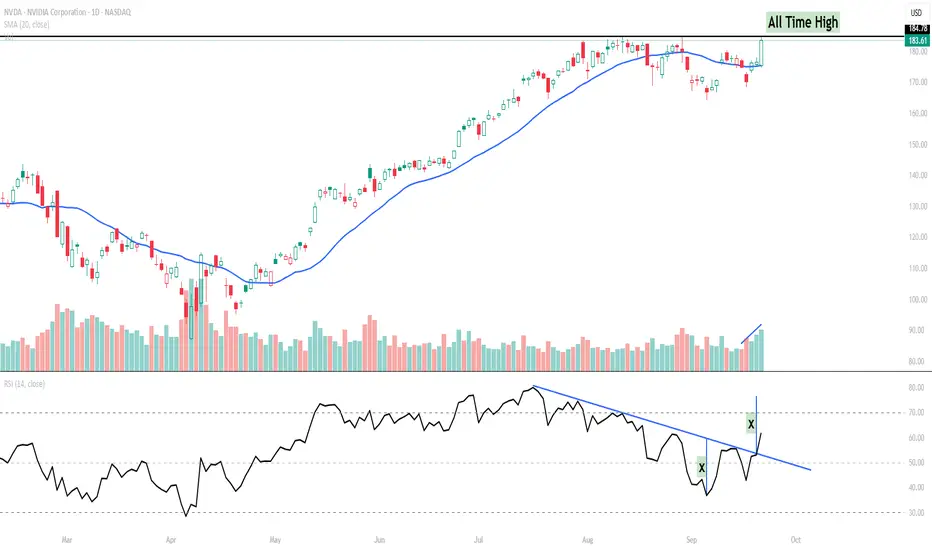
NVIDIA (NVDA) – RSI Trendline Breakout Signals Momentum Shift NVIDIA has staged a sharp move higher, reclaiming momentum after weeks of sideways-to-lower action. What makes this setup notable is not just the price, but the RSI trendline breakout.
Key Points:
RSI Trendline Breakout: The RSI broke above a descending trendline, suggesting momentum is shifting back in favour of buyers.
Volume Confirmation: The breakout coincided with a strong volume spike – often an early tell that institutions are stepping in.
Price Action: Price is now retesting the all-time high zone (~$184–185). A sustained close above this level could open the door for further upside.
Short-Term View: As long as NVDA holds above the $175–177 support zone, the bias remains bullish with potential for acceleration if RSI pushes toward the overbought zone.
Watchlist Levels:
Upside breakout trigger: $185+ (new all-time high)
Immediate support: $175
Momentum invalidation: Below $175
This is a classic case of how RSI trendline analysis can provide an early signal, often before price fully confirms the breakout.
Nvida BEAR n BULL idea. i'm bearish on nvida right now, this is my idea.
I'm really convinced that nvida will retest the support on old ath.
then go to the price target on green.

NVDIANVDIA has one more push up to take all time high.
Disclosure: We are part of Trade Nation's Influencer program and receive a monthly fee for using their TradingView charts in our analysis.
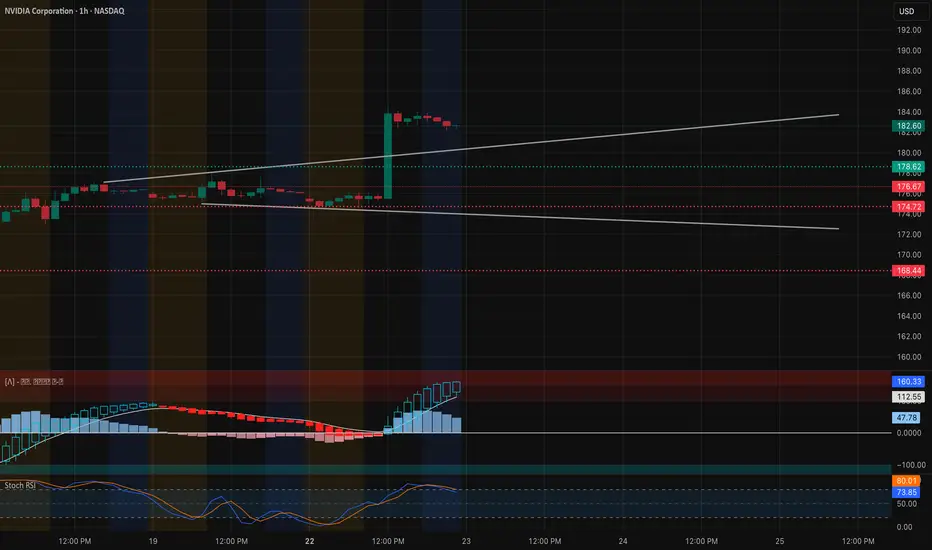
NVDA: Power Gap Push — Can Bulls Hold the 182 Zone? Sep 23Price Action & Setup (1-Hour Chart)
NVDA ripped early in today’s session, blasting through the mid-170s base and tagging 182–184 before cooling off. That surge printed a strong hourly impulse candle and left a shallow flag of lower highs, which often sets up the next leg if demand holds. Immediate intraday support sits around 178.6 and the breakout shelf at 176.6. Below that, 174.7 is a must-defend zone for bulls.
Momentum Check
MACD on the 1-hour flipped positive with expanding histogram but is flattening, signaling short-term digestion. Stoch RSI is still hot (near 80+), so a brief pullback to reset isn’t out of the question. Volume on the breakout was convincing, showing real participation, but follow-through volume on the flag is key.
GEX (Options Flow) Confluence
Gamma exposure backs the bullish case if 182.5 holds:
* Highest positive GEX / Call resistance: near 182.5
* 2nd Call Wall: ~185 (80% call concentration)
* 3rd Call Wall: ~190
* Put defense: 172.5 and 168.4
The dense call walls above mean that if NVDA stays pinned over 182.5, market makers may have to keep hedging upward, opening room toward 185 then possibly 190. A slip under 178–176 would instead drag toward the 172.5 put magnet.
Trading Plan
* Aggressive bull scalp: eye a break & hold above 182.6 → target 185 with tight stop under 180.8.
* Conservative entry: wait for a retest of 178.5–176.5 and a clean bounce before joining.
* Bearish hedge: if 176.5 fails on strong volume, consider a quick put play toward 172.5.
Option Angle
Calls around 182.5–185 strike for this week stay attractive for momentum traders if NVDA grinds above 182.5. For protection or a counter-move, short-dated puts near 172.5 can work if breakdown triggers.
Bottom Line
Bulls control momentum as long as NVDA holds 178–176. A decisive hourly close over 182.5 could spark a gamma-driven push toward 185–190. Lose 176.5 and the party cools fast.
Disclaimer: This is for educational discussion only and not financial advice. Always do your own research and manage risk.
$NVDA 15-Min: The God Candle That Spoke Loudest NASDAQ:NVDA exploded on the 15-minute chart today.
One bar, full conviction — the type of move traders call a god candle.
But here’s the truth: it isn’t about chasing candles.
It’s about having a process that makes you ready when they appear.
The groundwork is done before the bell.
Pre-market calculations define the risk, filter the noise, and set the stage for the opening drive.
When the signal aligns, you don’t predict — you execute.
Most of the time, the market is noise.
Occasionally, it speaks clearly.
Your job is to cut the losers fast, let the winners breathe, and keep showing up until the edge reveals itself.

NVDA eyes on $183.72: Golden Genesis fib about to BREAK and RUN?NVDA has been struggling against this Golden Genesis for months.
Latest news gave a surge that should BREAK and start next leg up.
Looking for a Break-n-Retest of $183.72 for next long entries.
.
See "Related Publications" for previous charts, such as this BOTTOM CALL:
Hit BOOST and FOLLOW for more such PRECISE and TIMELY charts.
=========================================================
.

Nvidia - The rally is still not over!🔌Nvidia ( NASDAQ:NVDA ) still heads much higher:
🔎Analysis summary:
For the past decade, Nvidia has perfectly been respecting a major bullish rising channel formation. Currently, Nvidia is still far away from the upper red resistance trendline, which indicates another potential move higher. Just understand that the trend is your closest friend.
📝Levels to watch:
$200
SwingTraderPhil
SwingTrading.Simplified. | Investing.Simplified. | #LONGTERMVISION

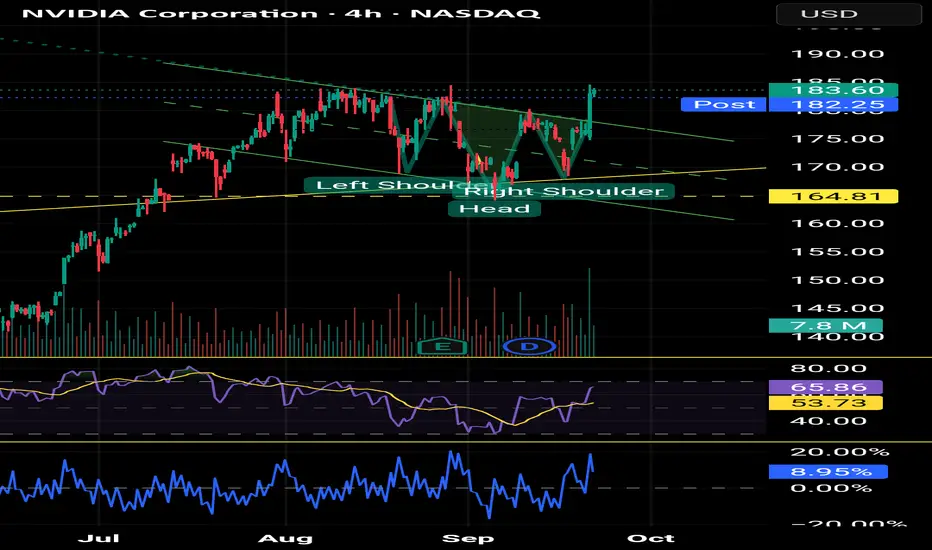
$NVDA - Bullish Reverse Head & ShoulderThere is a reverse head & shoulder pattern setting up which is a bullish pattern. Break above the neckline should send the price to near $200.

Bullish Pullback Attack – NVIDIA Heist Plan for Escape Loot!🚨💻 NVIDIA (NVDA) Stock Heist Plan 🎭 | Swing & Day Trade Robbery 💰⚡
🌟 Hey Money Makers & Market Robbers! 🌟
Welcome back to the Thief Trading Den where we don’t trade… we steal from the market vaults! 🏦💸
🔥 Asset: NVIDIA (NVDA)
🎭 Heist Type: Swing / Day Trade
🔑 Plan: Bullish Pullback Robbery
🗝️ Entry (Breaking into the Vault)
First lockpick entry above 167.00+ 🔓
Retest & pullback = perfect robbery spot
Thief layering strategy: stack multiple buy limit orders (layered entry like robbers tunneling from multiple sides 🛠️).
Any price level? Yes, thieves adapt—grab loot wherever the window cracks open! 🏃♂️💨
🛑 Stop Loss (Escape Route 🚪)
Official Thief SL: @ 161.00 ⚠️
But dear Thief OG’s, adjust based on your risk appetite, loot bag size & startergy 🎭
Remember, no thief survives without an escape route! 🚁
🎯 Target (The Electric Fence Escape ⚡)
The High Voltage Electric Shock Fence is guarding the treasure @ 196.00 ⚡⚡
Snatch your profits before the fence fries the loot 🔥
Escape fast, spend faster, rob smarter 💸🍾
⚠️ Thief Alert 🚨
The market guards (short sellers) are patrolling heavy—don’t get caught in their traps 🕵️♂️
Use layered limit orders, scale out profits, and keep your SL tight!
A true thief never overstays at the crime scene 👀
💥 Boost this Robbery Plan 💥
Every like & comment powers the Thief Trading Family 🏆
Stay sharp, stay sneaky & let’s rob NVIDIA together! 🤑🎭

NVIDIA Corporation (NVDA) Expands AI Chip LeadershipNVIDIA Corporation (NVDA) is a global leader in graphics processing units (GPUs) and AI computing platforms. Best known for powering gaming, data centers, and professional visualization, NVIDIA also drives innovation in autonomous vehicles, healthcare, and supercomputing. The company’s growth is fueled by explosive demand for AI chips, the rise of cloud computing, and its ability to expand GPU technology into nearly every corner of the digital economy.
On the chart, a confirmation bar with rising volume highlights bullish momentum. The price has entered the momentum zone after climbing above the .236 Fibonacci level. A trailing stop can be placed just below this Fibonacci line using the Fibonacci snap tool, helping traders lock in profits while staying positioned for more potential upside.

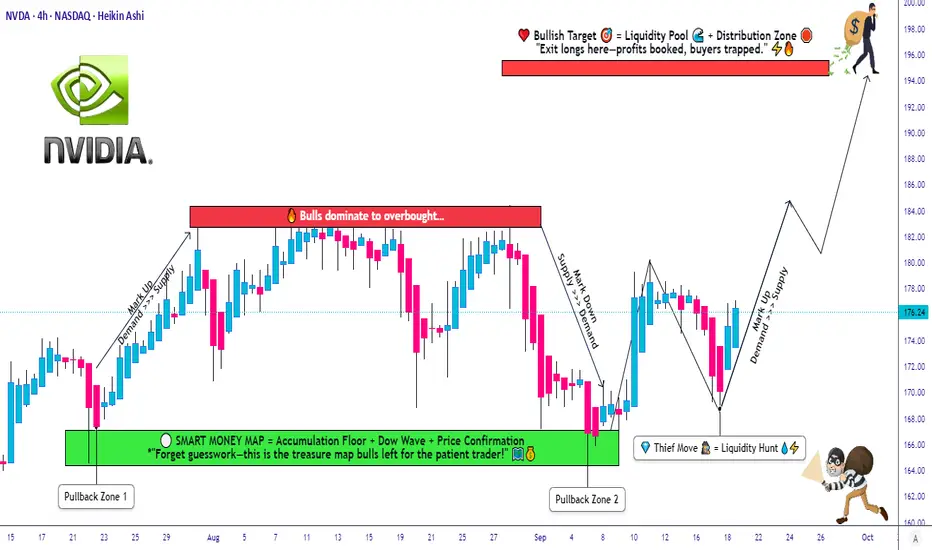
NVDA Setup Explained: Layered Entry + Clear SL/TP Levels😎 NVDA Thief’s Wealth Heist: Swing/Day Trade Blueprint 🚀
Asset: NVIDIA Corporation (NVDA) 📈Vibe: Bullish, sneaky, and ready to snatch profits with style! 💰
Welcome, ladies and gentlemen, to the Thief’s OG Wealth Strategy Map for NVDA!
This is a fun swing/day trading plan designed to grab liquidity like a master thief. Let’s break down this bullish setup with a double bottom pullback, layered entries, and a cheeky escape plan. Ready to outsmart the market? 🕵️♂️
📊 Market Analysis: Why NVDA?
NVDA is riding a bullish wave 🌊, confirmed by a double bottom pullback pattern and a sneaky liquidity grab at key support levels. The stock’s momentum is screaming “UP!” as buyers step in to defend the price. This setup is perfect for swing or day traders looking to capitalize on NVIDIA’s tech-fueled surge. 💻
🗺️ The Thief’s Plan: Bullish Heist Strategy
🎯 Entry Strategy:Deploy the Thief’s Layering Tactic with multiple buy limit orders to maximize your entry precision.
Suggested price levels:
$172.00
$174.00
$176.00
$178.00
Pro Tip: Feel free to add more layers based on your risk appetite and market conditions. The more, the merrier! 🧑💼
🛑 Stop Loss (SL):Set a Thief’s SL at $168.00 to protect your loot.
Note: Dear Thief OGs, this SL is my suggestion, but you’re the boss of your trades! Adjust based on your risk tolerance and let the profits roll. 💸
🎉 Take Profit (TP):Aim for the juicy $195.00 target, where we expect strong resistance, potential overbought conditions, and a possible trap for the unprepared. Lock in those hard-earned gains and escape like a pro! 🏃♂️
Note: This TP is my call, but you do you! Take profits at your own pace and keep the cash flowin’. 😎
🔗 Related Pairs to Watch (in USD)
To boost your market awareness, keep an eye on these correlated assets:
NASDAQ:AMD (Advanced Micro Devices): NVDA’s chipmaking cousin often moves in tandem. A bullish NVDA could signal strength in AMD. 📡
NASDAQ:SMH (VanEck Semiconductor ETF): This ETF tracks the semiconductor sector, including NVDA. Watch for sector-wide momentum. 📊
NASDAQ:QQQ (Invesco QQQ Trust): NVDA’s a heavy hitter in this tech-heavy ETF. QQQ’s trend can confirm NVDA’s direction. 🚀
Key Correlation Point: NVDA’s performance is tied to the broader semiconductor and tech sector. If AMD or SMH shows bullish patterns, it reinforces NVDA’s upside potential. Conversely, weakness in QQQ could signal caution. Stay sharp, thieves! 🕵️
🛠️ Why This Setup Rocks
Double Bottom Pullback: A textbook bullish reversal pattern, signaling strong buying interest. 📉➡️📈
Liquidity Grab: The market’s attempt to shake out weak hands before the real move up. We’re smarter than that! 😏
Layered Entries: Spread your risk across multiple price levels for a smoother ride. 🎢
Risk Management: Clear SL and TP levels keep your heist disciplined and profitable. 🧠
⚠️ Disclaimer
This Thief Style Trading Strategy is just for fun and educational purposes! I’m not a financial advisor, and trading involves risks. Make your own decisions, manage your risk, and trade responsibly. Let’s keep the vibes high and the losses low! 😜
✨ “If you find value in my analysis, a 👍 and 🚀 boost is much appreciated — it helps me share more setups with the community!”
#NVIDIA #NVDA #Trading #SwingTrading #DayTrading #ThiefStrategy #StockMarket #Bullish #TechnicalAnalysis
Nvidia ATH breakoutNvidia is set to break out its ATH again.
Nvidia has formed a inverse head and shoulder inside a bull flag. Both has broken out today after the 100b open ai announcement. This weeks price target is 195. And alot more highs will come thos year.
NVDA Sep 22 Game Plan – “Grinding Up or Topping Out?”1️⃣ Big Picture on the 1-Hour Chart
* Price action: NVDA closed Friday around 176.07, sitting right on a short-term rising trend line. Price has been stair-stepping higher off the 172 area, but momentum is flattening.
* Key levels:
* Resistance: 178.60–180 (recent high & big call wall)
* Support: 175–172.5 (trendline & gamma pivot)
* Indicators:
* MACD on the hourly is rolling over – still above zero but losing steam.
* Stoch RSI is down near oversold and trying to curl, so a quick bounce isn’t off the table.
This paints a neutral-to-slightly-bullish short-term picture: the uptrend is alive, but it’s late in the cycle unless buyers step in hard at the open.
2️⃣ GEX / Options Flow
* Call concentration shows heavy walls near 178.6–180.
* HVL (High Volume Level) is sitting near 172.5, which often acts like a magnet if price slips.
* Below that, 167.5 and 165 are the next notable put supports.
* IVR is low (around 3), so options are relatively cheap if you’re looking at quick plays.
This means market makers may want to pin NVDA in the 175–180 zone early in the week. Breaks above 180 could squeeze toward 182.5+ fast, but a fail back under 175 risks a slide to 172.5 and maybe 170.
3️⃣ Trading Thoughts & Suggestions
* Scalp / day trade: Watch for a clean break of 178.6–180 with volume. If it holds, 182–183 is the next scalp target. Tight stop under 177.5.
* Fade setup: If early strength gets rejected hard at 178.6–180 and the trendline breaks, short ideas toward 175 → 172.5 make sense.
* Swing idea: Only interested in swings if we close >180 with confirmation; otherwise, chop is more likely.
4️⃣ Bottom Line
NVDA is at a decision spot. A quick pop above 180 could spark a mini gamma squeeze. Failure there with a trendline break drags it back toward 172.5 or even 170. I’ll let Monday’s first hour dictate the bias.
Disclaimer: This is just market opinion for educational discussion. It’s not financial advice. Always manage your own risk before trading.
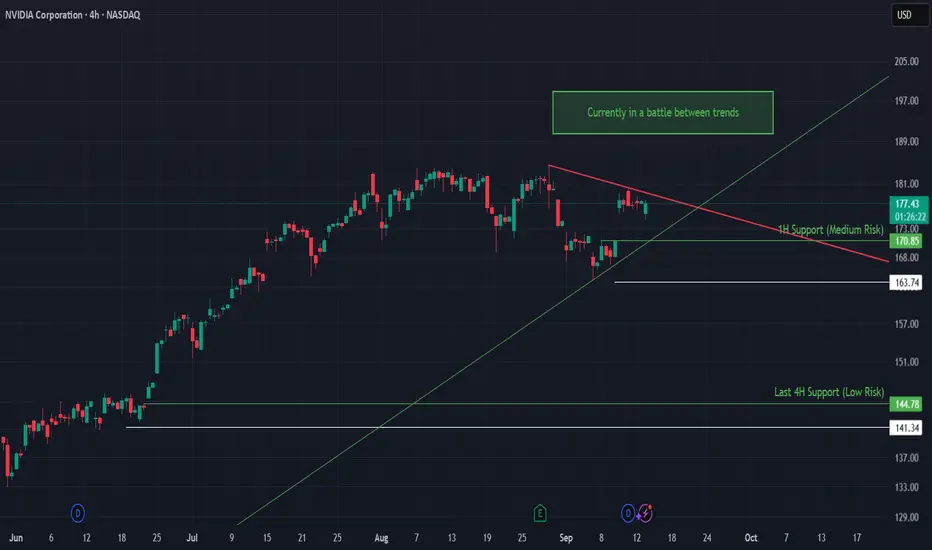
NVDA at a Crossroads: Battle Between TrendlinesNVIDIA is currently consolidating in a tight range, locked between an ascending green trendline of support and a descending red resistance trendline. This setup signals that a breakout is near, with the next directional move likely to bring strong momentum.
🔍 Technical Analysis
Current Price: 176.74
Structure: Triangle squeeze between rising support and falling resistance.
The ascending trendline from June continues to provide strong bullish structure, but the red downtrend capping recent highs must be broken to regain upside momentum.
🛡️ Support Zones (with Stop-Loss):
🟢 170.85 | SL: 163.74 – 1H Support (Medium Risk)
🟢 144.78 | SL: 141.34 – 4H Support (Low Risk, strong base)
🔼 Resistance Levels:
🟥 Red downtrend line near 180 – Breakout above confirms renewed bullish impulse.
🧭 Outlook
Bullish Case: Hold above 170.85 and break the red downtrend → momentum push toward 185–190.
Bearish Case: Failure to hold 170.85 could trigger a deeper pullback into 163 or even 145.
Bias: Neutral to bullish as long as price stays above the green trendline.
🌍 Fundamental Insight
While NVDA remains a market leader in AI and GPUs, recent earnings have highlighted slowing revenue growth compared to prior explosive quarters. This has cooled investor enthusiasm, making technical levels even more important for short-term direction.
✅ Conclusion
NVDA is at a decision point: stuck between trendlines, awaiting a breakout. Bulls must defend 170.85 while bears eye resistance around 180. A resolution here could set the tone for the coming weeks.
⚠️ Disclaimer
This analysis is for educational purposes only and does not constitute financial, investment, or trading advice.
Is Nvidia preparing for a retracement?On July 23rd I posted a chart suggesting that Nvidia had topped (at my green T1). Since then Nvidia has stalled at my T1 range for the past 2 months.
Question remains, will Nvidia retrance from here as anticipated? What do you think, I'd like to hear from you, to gauge sentiment.
May the trends be witht you.
