QQQ (10 October)The 50d MA often acts as the first line of defense in bull markets
When the price breaks below its intraday high and then reclaims it within 1-3 sessions, it is considered a bullish continuation setup
Historically, QQQ tends to bounce 3-5% after reclaiming its 50d MA following a 2-3% flush
So if QQQ closes back above $595, it could accelerate through $600–$610 toward prior highs near $615–$620
Today's drop is a retest of intermediate trend support, not a deep structural breakdown
Trade ideas
QQQ Ideal Risk FloorThe $568–$582 area aligns with deep Fibonacci support, sentiment washout & historical rebound behavior after tariff shocks - all ingredients for a fast relief rally
The market is currently hovering between $582–$589, sitting right above that 78–82% retracement
Historically, this acts as a springboard for sharp short-covering rallies; unless, macro fundamentals deteriorate rapidly
"China–US Tariffs” marks both the prior and current inflection points - the market clearly prices in trade policy uncertainty aggressively, then reverts once it stabilizes
After similar shocks (“Liberation Day” or “Midnight Hammer”), QQQ rebounded 6–9% within 5–10 trading days
That would translate now to $615–$640 targets if history rhymes
Momentum algorithms will likely trigger buys if QQQ closes back above $595, so that’s the near-term confirmation pivot
$580–$585 is the ideal risk floor, while $605–$615 offers a reward window

QQQ Short-Term Sentiment WashoutSteep one-day drawdown + fear spike often precedes short-term rebounds & so long as $585 holds, the setup favors a reflexive rally back toward $605–$610
585–$600 is the active panic zone; heavy selling & volatility expansion
Next major support is $560–$570 which is the base from spring, if this breaks, larger correction risk
Resistance 1 at $605–$610 is the first bounce target/prior floor
Resistance 2 at $620–$625 is the intermediate target if rally extends multiple days
This looks more like a sentiment flush than the start of a prolonged bear move (at least for now) so confirmation signals to watch Monday
QQQ futures (NQ) green premarket +0.5% or more
VIX down 5–8%
Mega-caps (NVDA, MSFT, AAPL) showing strong premarket bids
RSI divergence or a hammer candle near $585–$590 intraday
Global Equities in EUR - The 2025 Suprise WinnersLast year, everyone crowded into the S&P 500 trade — “why bother being anywhere else?”
One year later, when we look at YTD returns in euros, the picture changes completely 👇
YTD Performance (in EUR)
🇨🇳 FXI (China): +21.7 %
🇪🇺 FEZ (Europe): +16.8 %
🇯🇵 EWJ (Japan): +6.5 %
🇺🇸 QQQ (Nasdaq 100): +7.4 %
🇺🇸 SPY (S&P 500): +3.0 %
🇺🇸 IWM (Russell 2000): –0.3 %
The “uninvestable” China market has quietly outperformed every major index.
Europe also posted strong gains, while U.S. benchmarks lagged once adjusted for FX.
💡 A reminder that currency and narrative can distort what “performance” really means.

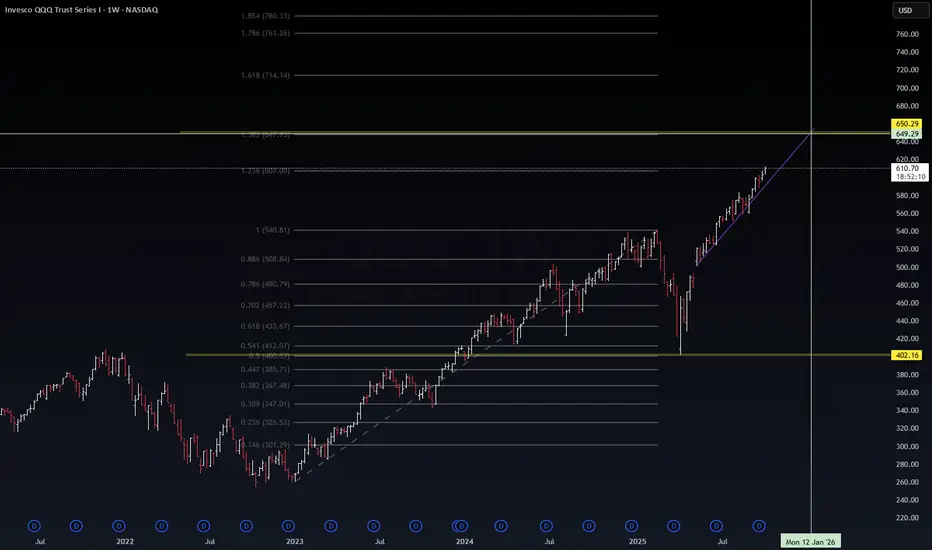
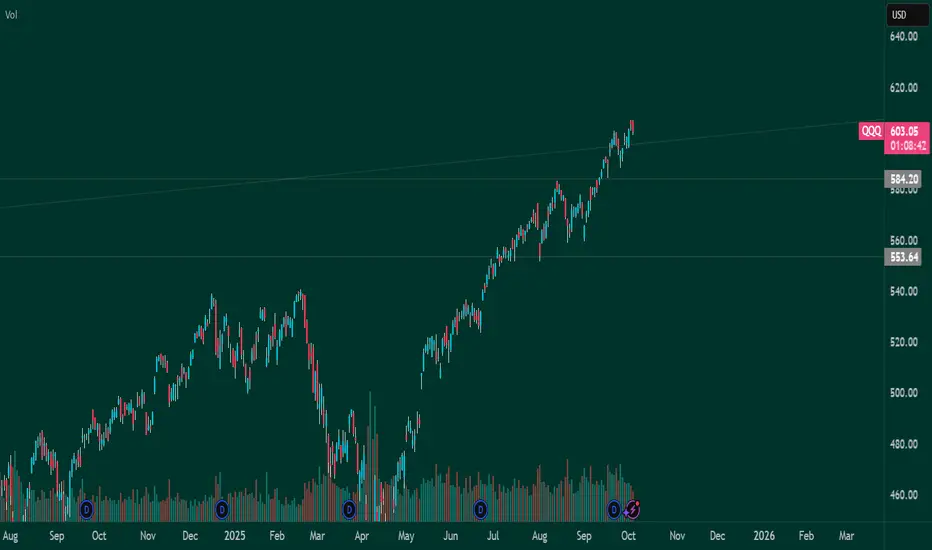
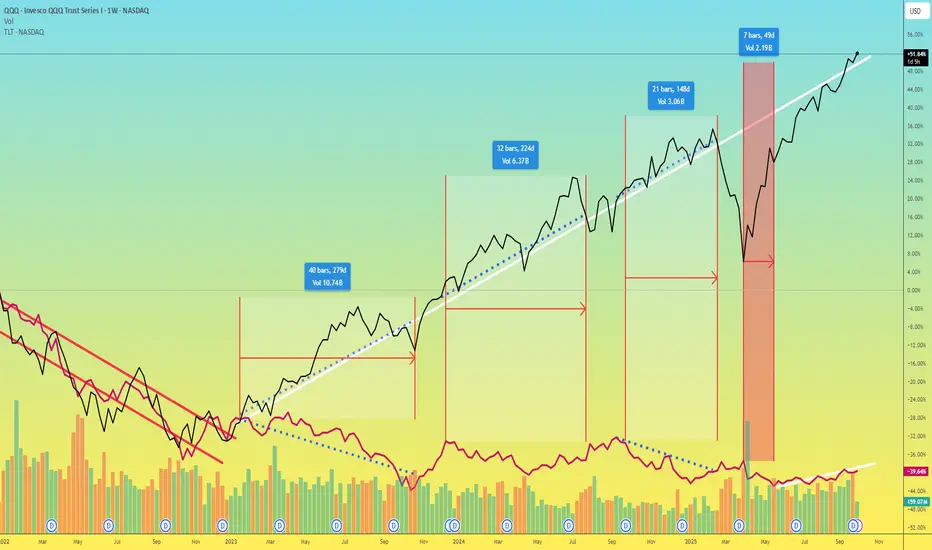
$QQQ | VolanX Macro Wave Projection – 2025/26 Outlook⚡ NASDAQ:QQQ | VolanX Macro Wave Projection – 2025/26 Outlook
Price currently accelerating along a sharp trendline toward the Fib 1.236 extension near 650.
Momentum remains strong, but structure now mirrors the late-stage expansion phase — high probability of equilibrium retest before continuation.
Key Zones:
Support: 540 → 508 (prior breakout base)
Equilibrium: 480–500 zone
Premium Target: 650–660 (1.236 confluence)
Next Macro Resistance: 714–760 (1.618–1.786 extension)
📊 VolanX DSS Bias:
Bullish momentum intact ✅
Macro trend exhaustion probability: ~35%
Long-term trajectory remains upward unless 540 fails
A controlled pullback would strengthen the long-term structure — healthy, not bearish.
Keep an eye on liquidity behavior near 650; that’s where big money will rotate.
#QQQ #VolanX #MacroWave #LiquidityZones #SmartMoney #AITrading #WaverVanir
Not Investment Advice ⚡
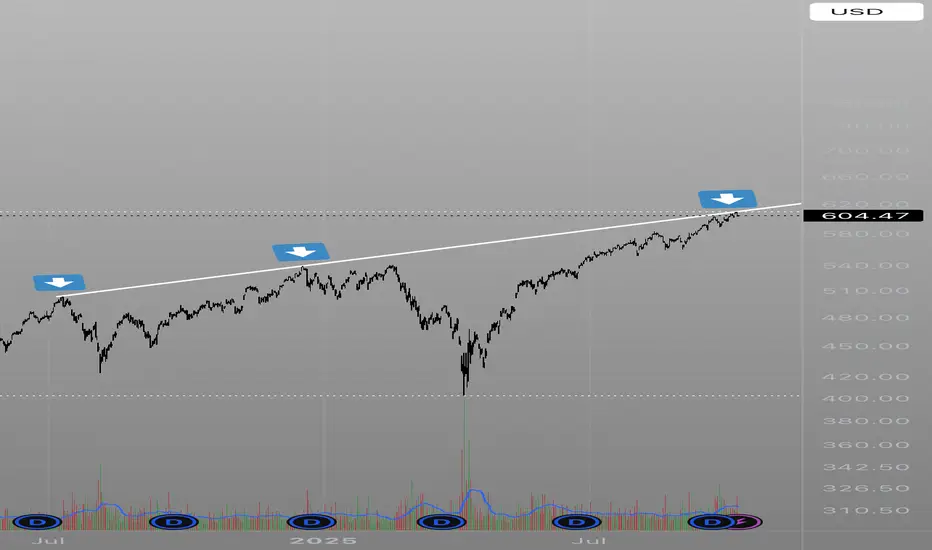
$QQQ: Rejected off massive resistanceQQQ has now rejected off this resistance 3 times spanning back to july ‘24. Do the bulls have enough steam left to push this over the line or will the bears get a chance to feast?
QQQ Short-Term RhythmThe expected-move range (using current IV ≈ 17%-18%) to see where QQQ statistically “should” trade by mid-October, which may be helpful for picking your next strike
1. Bounce from 20d MA $596–$600 with a retest of $610–$615 (60%)
2. Sideways continuation between $600–$610 (25%)
3. Close <$595 with a pullback to $580 (15 %)
A dip into $598-$600 with a stabilizing candle is statistically the highest-reward entry for short-term calls
No reason to short unless price closes below both the trendline and 20d MA on elevated volume (>60M)
If anything, the next real move could be a bounce attempt, not a flush
Based on current implied volatility (IV ≈ 17.8 %) & QQQ ≈ 605, the expected move (1σ range) for the coming week & into 24 October, where Expected Move = Price × IV × √( t /365)
17 October (10 days) ≈ 1σ 15 pts (68% probability) ≈ 2σ 30 pts (95% probability) $590-$620
24 October (17 days) ≈ 1σ 20 pts (68% probability) ≈ 2σ 40 pts (95% probability) $585-$625
31 October (24 days) ≈ 1σ 24 pts (68% probability) ≈ 2σ 48 pts (95% probability) $580-$630
So statistically, QQQ has about a 68% chance to stay between ≈ $585 & $625 by 24 October
If you’re bullish,
Favor calls slightly OTM ($610-$615) expiry 24 October
Target breakout confirmation above $608 with volume
If you’re cautious/swing-trading,
Use short-dated, low-cost put lottos near $600 only on breakdown <$600 (ideally Friday/Monday flush)
If you prefer defined risk,
Debit spreads ($605/$615 call spread) give good exposure without over-paying IV
20d MA ≈ $597 lines up with the lower 1σ bound (~$590-$595)
Resistance near $612 is mid-upper 1σ band (~$620)
So the option market’s “expected move” fits almost perfectly with your technical structure
SPY/QQQ Bearish Divergence, VIX Compression, XLK→XLV Rotation After a month building my automated pattern detection system (Legend AI) and preparing for CMT Level I, I returned to find one of the cleanest technical setups of 2025—and today it's showing early signs of confirmation.
━━━━━━━━━━━━━━━━━━━━━━━━
THE SETUP: BEARISH DIVERGENCE NEAR ALL-TIME HIGHS
Recent Action:
SPY approached $669 (ATH territory)
QQQ approached $605 (ATH territory)
Markets at elevated levels
As of today's close:
Both indices slightly red on light volume
VIX up approximately 6% (waking from compression)
Early confirmation of divergence thesis
━━━━━━━━━━━━━━━━━━━━━━━━
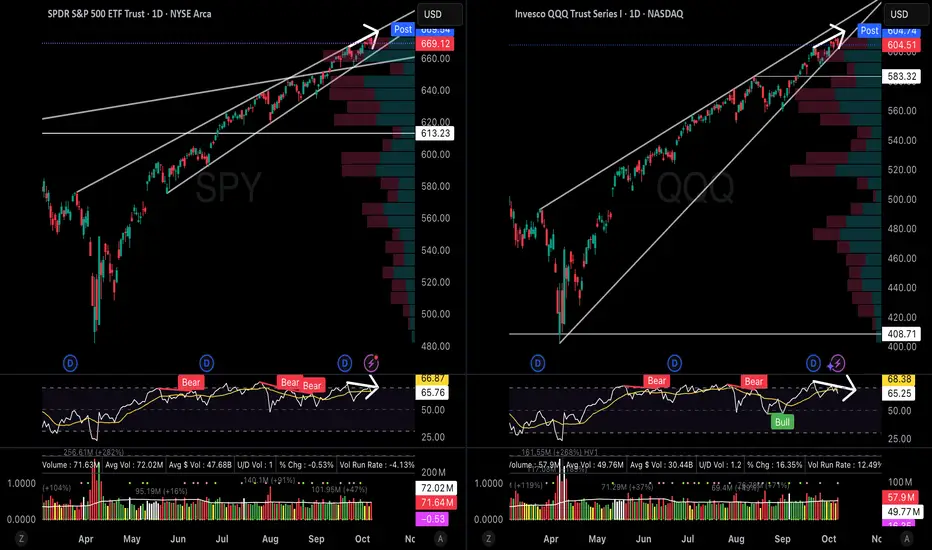
PART 1: THE DIVERGENCE (SPY/QQQ)
SPY and QQQ daily charts showing price near highs while RSI makes lower highs, volume below average
SPY Analysis:
Price Structure:
Near all-time highs around $669
Ascending channel (upper resistance)
Above all major moving averages
RSI (14-period):
August peak: 72
September peak: 68
October peak: 65
Textbook negative divergence.
Price making higher highs. RSI making lower highs. When momentum diverges from price, rallies often exhaust.
Volume (Critical Signal):
Recent volume: 20-30% below 20-day average
Distribution pattern emerging
When institutions are excited, volume SURGES. When they're distributing, volume DRIES UP.
Current pattern suggests distribution.
QQQ Analysis:
Price Structure:
Near highs around $605
Channel resistance test
Tech still leading (but showing fatigue)
RSI Divergence:
September: 70
October: 65
Volume:
Approximately 5-10% below average
Less extreme than SPY, but weekly RSI shows clear decline from August highs.
━━━━━━━━━━━━━━━━━━━━━━━━
PART 2: SECTOR ROTATION (The Tell)
XLK extended at resistance, XLV breaking higher showing defensive rotation
XLK (Technology): ~$286
At upper channel resistance (third touch)
RSI showing fatigue
Volume below average
XLV (Healthcare): ~$144
Breaking out of downtrend
RSI improving (mid-50s range)
Defensive bid emerging
What This Rotation Signals:
When money flows to defensives DURING a bull market, institutions are often de-risking.
The cycle:
Tech/Growth leads (early bull)
Cyclicals lead (mid bull)
Defensives lead (late bull) ← Current phase
Cash/Bonds lead (bear market) ← Potential next
XLV strength while XLK stalls = classic late-cycle behavior.
━━━━━━━━━━━━━━━━━━━━━━━━
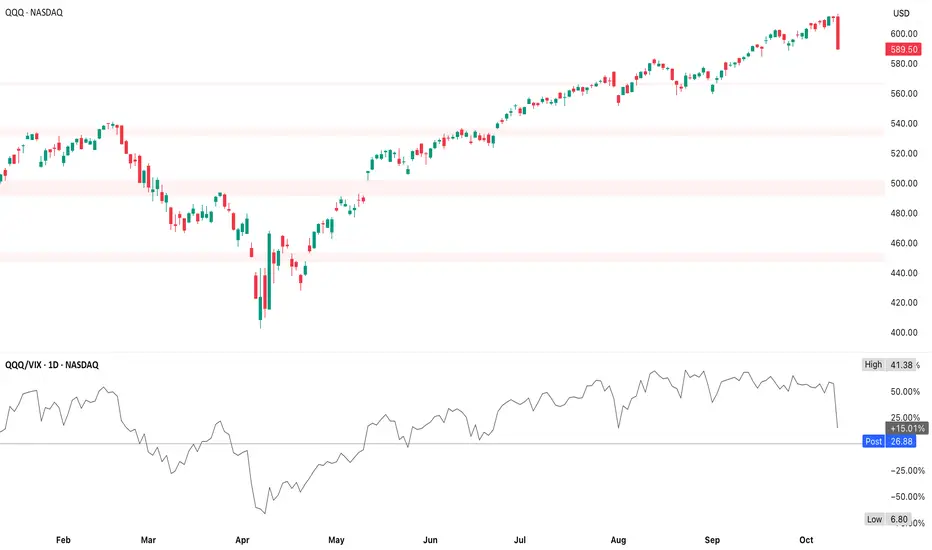
PART 3: VIX COMPRESSION (The Spring)
VIX in 5-month descending triangle around 17, compression before expansion
VIX: Around 17 (up ~6% today)
Structure: 5-month descending triangle
Lower highs: 22 → 20 → 18
Flat support: 15
Apex approaching
Why This Matters:
VIX compression at market highs is often complacency, not confidence.
Historical Context:
January 2022: VIX 17 → spiked to 37 (market corrected 12%)
August 2024: VIX 15 → spiked to 65 (flash crash 10%)
February 2020: VIX 14 → spiked to 85 (COVID crash 35%)
Today's surge is the first significant move in months.
Breakout Level: 21
VIX close above 21 would break descending triangle (bullish for VIX = bearish for equities).
Typical spike from these patterns: 30-50% within 2 weeks.
━━━━━━━━━━━━━━━━━━━━━━━━
WHY I'M BUILDING LEGEND AI
This is EXACTLY the pattern I'm building Legend AI to detect automatically.
The system I'm developing scans for:
Multi-timeframe RSI divergence (daily + weekly)
Volume anomalies (significantly below average on strength)
Sector rotation shifts (defensive vs growth)
VIX compression extremes
Risk/reward scoring
Why Automation Matters:
I identified this setup manually by:
Scanning charts for divergence patterns
Calculating volume deviations vs moving averages
Tracking sector ETF rotation
Monitoring VIX structure
Synthesizing signals into risk assessment
This took 2-3 hours of focused analysis.
The Challenge: Doesn't scale. Limited tickers, timeframes, and signals I can monitor.
The Solution: Automate pattern detection to scan 500+ stocks in seconds, flag divergences on multiple timeframes, calculate volume deviations automatically, and alert high-probability setups.
The Result: Focus shifts from hunting patterns to executing trades.
This is institutional-grade approach—building systems that identify edge systematically, removing emotion and scaling analysis.
Current Development Status:
Foundation: Built
VCP pattern detection: In progress (~60% complete)
Divergence detection: In development (~30% complete)
Target: End of October for initial version
This divergence setup proves the concept: I can identify these patterns manually through disciplined analysis. Now building tools to systematize the process at scale.
━━━━━━━━━━━━━━━━━━━━━━━━
TODAY'S EARLY CONFIRMATION
As of today's close:
Indices:
SPY/QQQ: Slightly negative on light volume
Dow: Minor weakness
Key Observations:
Volume remained below average into close
Tech showed slight underperformance
VIX up approximately 6% (stirring from slumber)
Defensive sectors maintained relative strength
This represents early-stage confirmation.
Not full breakdown yet, but thesis developing:
Distribution continues (persistent light volume)
Defensives outperforming (rotation in progress)
Volatility awakening (VIX responding)
━━━━━━━━━━━━━━━━━━━━━━━━
CONFIRMATION CHECKLIST
Not calling a top. Identifying elevated risk.
Watching For Full Confirmation:
1. Price Breakdown
SPY closes decisively below $650
QQQ closes below $583 (50-day MA)
Preferably same day
2. Volume Confirmation
SPY volume significantly above average on breakdown
QQQ volume surge on weakness
Proves institutional selling
3. VIX Breakout
VIX closes above 21
With participation
Confirms fear entering
4. Sector Confirmation
XLV outperforms XLK by 2%+ over multiple days
Defensive rotation accelerates clearly
Current Approach:
Respecting the uptrend. Not shorting yet.
But adjusting:
Reducing position size 30-40%
Tightening stops to 2-3% max
Avoiding aggressive longs at resistance
Building watchlist for post-correction opportunities
Risk management, not market timing.
━━━━━━━━━━━━━━━━━━━━━━━━
RISK FRAMEWORK
GREEN LIGHT (Lower Risk):
Price + momentum confirming
Volume strong on breakouts
VIX contained and declining
Clear sector leadership
Action: Normal size, wider stops
YELLOW LIGHT (Elevated Risk): ← CURRENT STATUS
Divergence present but not fully confirmed
Volume declining
VIX compressed but not breaking
Sector rotation beginning
Action: Reduce 30-40%, tighten stops, favor quality
RED LIGHT (High Risk):
Confirmed breakdown with volume
VIX spiking above 25
Defensives significantly outperforming
Action: Minimal exposure, preservation mode
━━━━━━━━━━━━━━━━━━━━━━━━
ALTERNATIVE SCENARIOS
Comprehensive analysis considers multiple outcomes.
Bullish Case (What Could Invalidate):
Volume Returns: New highs with strong participation
Earnings Exceed: Q3 significantly beats expectations
Fed Support: Rate cut signals come sooner
Breadth Improves: Small caps participate, A/D confirms
If these occur, divergence might resolve through consolidation (sideways digestion 4-8 weeks) rather than correction (breakdown).
Never marry a thesis. Follow the data as it develops.
━━━━━━━━━━━━━━━━━━━━━━━━
SUMMARY
After a month of building and studying, returned to find a textbook setup showing early confirmation.
The Evidence:
Bearish divergence (SPY, QQQ)
Distribution pattern (light volume into strength)
VIX compression ending (surge today)
Sector rotation to defensives (XLV strength)
Early validation (today's weak close)
This suggests elevated risk, not guaranteed correction.
Approach:
Reduce exposure meaningfully
Tighten risk management
Watch for full confirmation
Stay disciplined and patient
Best traders prepare for multiple outcomes rather than predicting one.
━━━━━━━━━━━━━━━━━━━━━━━━
What are you seeing in current market structure? Comment below—I engage with all responses.
If this analysis added value, boost it so others can benefit.
Follow for more systematic technical analysis and Legend AI development updates.
—Kyle Thomas
CMT Level I Candidate | SIE Certified
Building Legend AI: Automated pattern detection for systematic trading
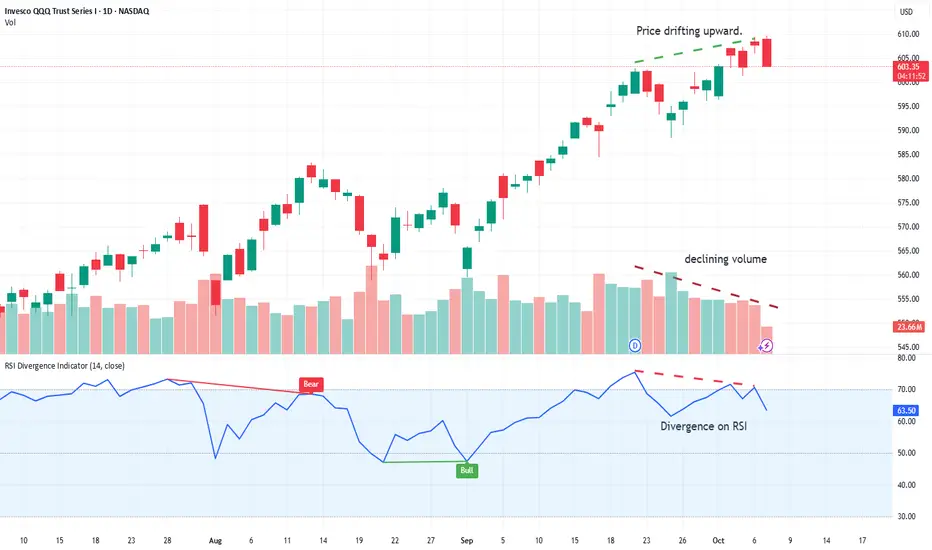
QQQ weakness about to break to the downsideDeclining volume, diverging RSI, sell-offs throughout the day.
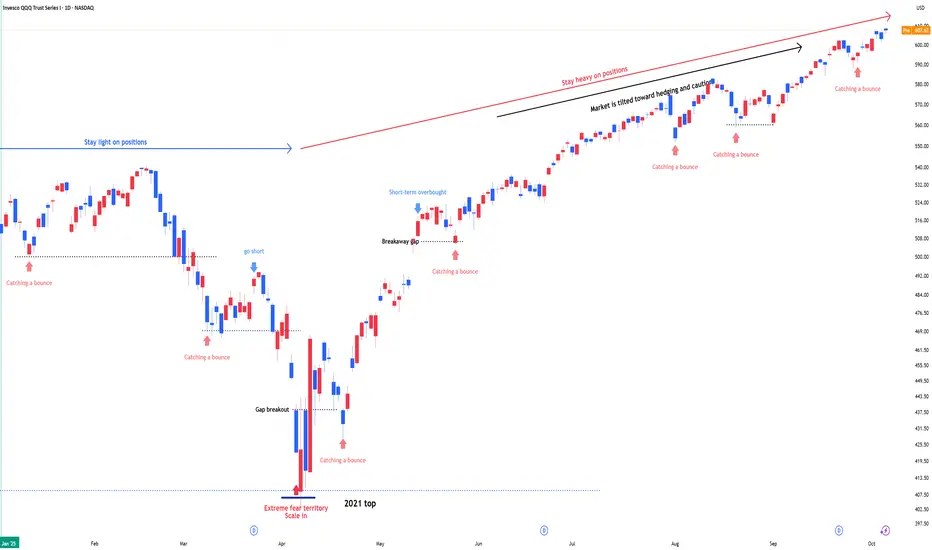
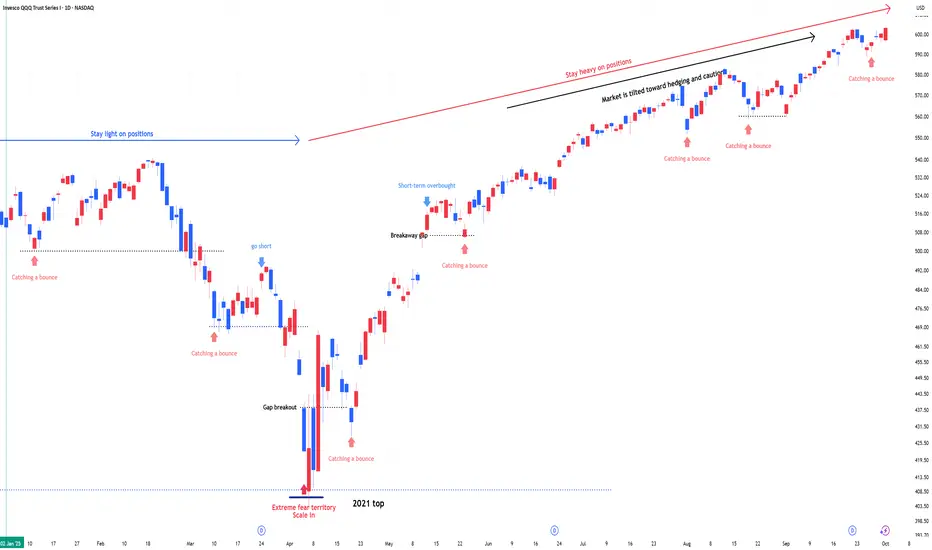
QQQ : Stay heavy on positionsQQQ : Stay heavy on positions (QLD, TQQQ)
Entering a risk-on, high-volatility zone.
In stay light on positions zones, I hold QQQ and reduce exposure.
In stay heavy on positions zones, I increase allocation using a mix of QLD and TQQQ.
** This analysis is based solely on the quantification of crowd psychology.
It does not incorporate price action, trading volume, or macroeconomic indicators.
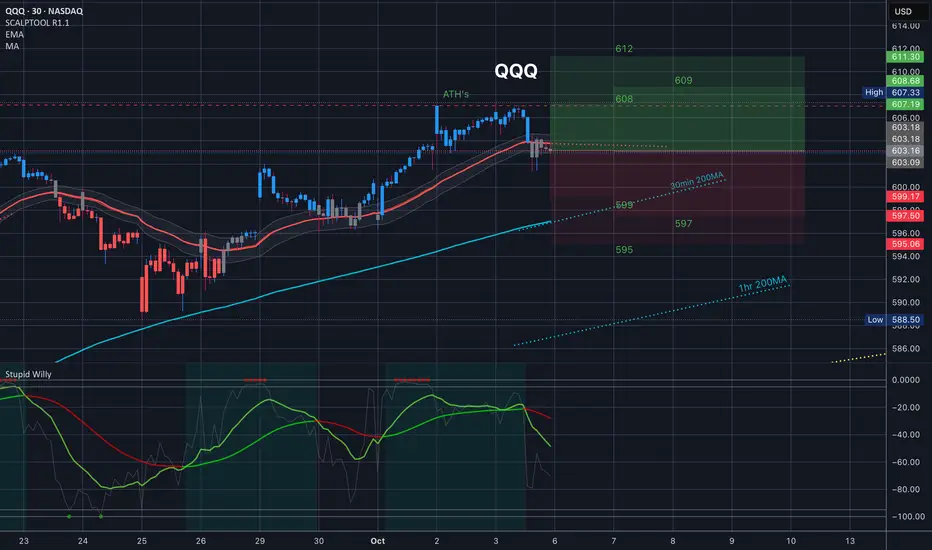
$QQQ Tomorrow's Trading range 10.6.25
We closed right at the 35EMA so that is right in the middle and will be a key level. 30min 200MA is just underneath the bottom of the implied move so if for whatever reason we come near it look to it as a support to pop us back into the implies move. And of course above us we have ATH's.
Just .66% implied tomorrow so don't get crazy...
@shkspr
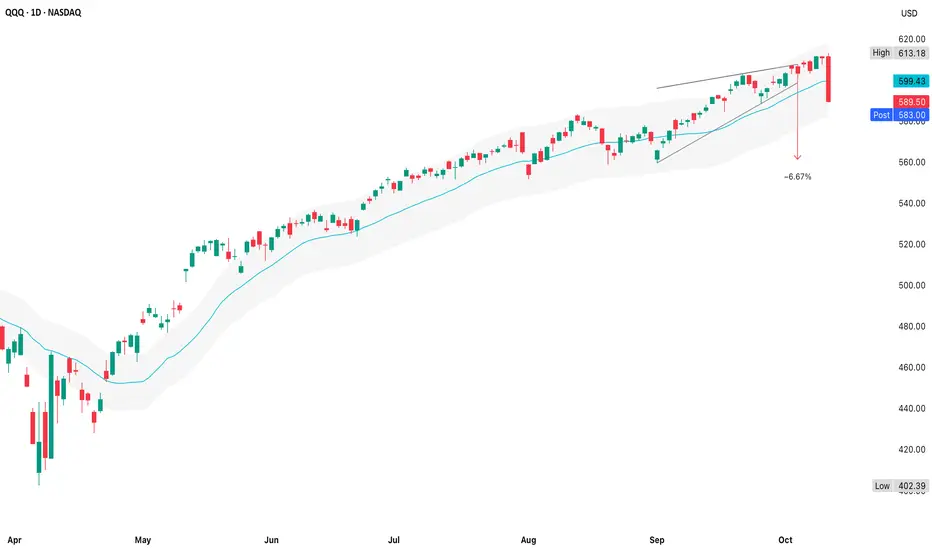
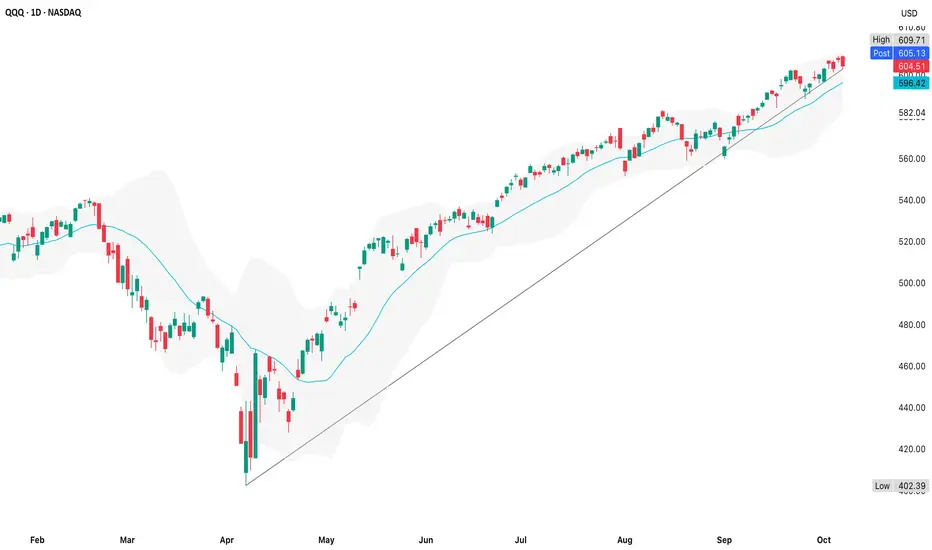
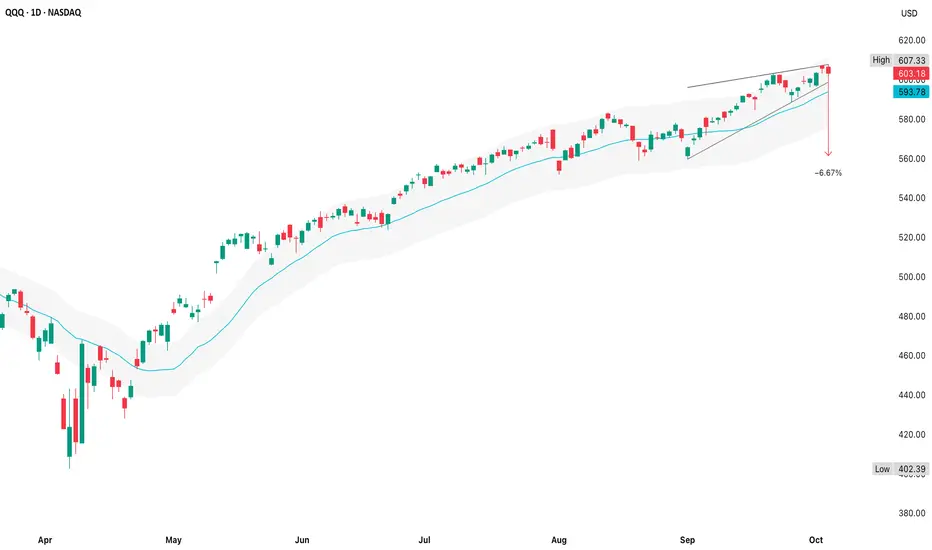
QQQ (3 October)The rising wedge (marked by the two converging trendlines) is a classic loss-of-momentum pattern
Price hit the upper boundary near $607 & closed back below $604 - a rejection right at resistance
The measured move (-6.7%) projects down toward roughly $565–$570, aligning neatly with the lower boundary of the wedge & prior consolidation levels
The slope of the moving average remains upward which confirms the bullish trend, but the distance between price & the mean is stretched
Each time QQQ touched this far above the average earlier in the year (June & August), we saw 5-7% mean reversion moves
A proportional, healthy pullback
If QQQ closes below ~$600, that would confirm the rising wedge breakdown & trigger the measured-move target to $570
If it bounces from $595-$600, we could see a short-term fakeout before another attempt to push higher toward $615
Volume (46.5M) on the rejection candle isn’t panic-level, but it is heavier than the previous few sessions, an early sign of distribution
Weak setup for next weekDiverging RSI confirmed with today's faded rally. Lots of uncertainty with the shutdown, but also no release of government data. How will the Fed know to lower rates without data? Markets are at all-time highs, but also at all-time high VALUATIONS. P/S, Case Shiller PE, Earnings Yield, and others all pointing to a sell-off being needed to contain the bulls.
Small Correction 5-10% ?Looks like we will have a small correction hopefully not more than 10%. It could be a good time to buy the dip in nvda, orcl, crwd etc.
Happy trading !!
Not a financial advice.
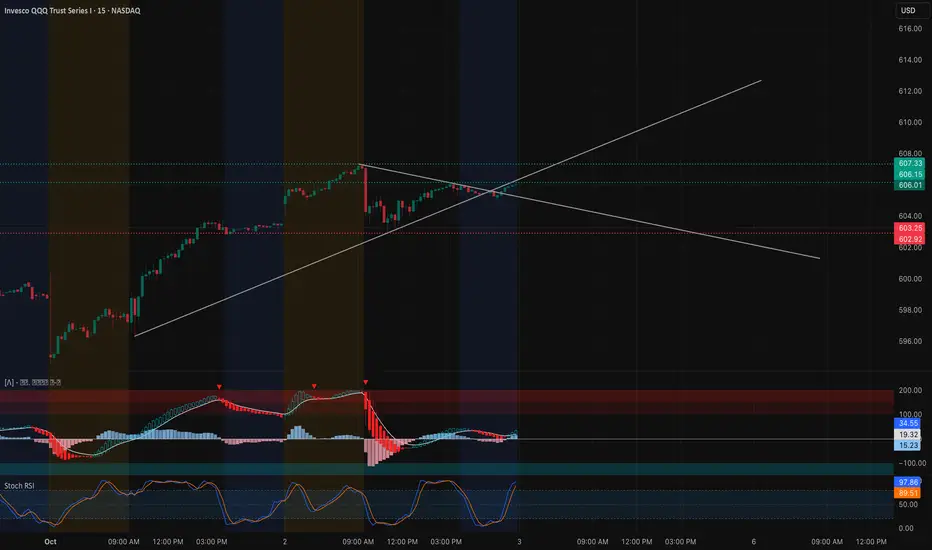
QQQ Tightening Up – Gamma Levels Will Decide Oct 3 Intraday Technical Outlook (15m Chart)
The QQQ closed near $606.01, coiling into a wedge formation after a strong upward push. On the 15-minute chart, the price is sitting right at a confluence of support and resistance trendlines:
* MACD: Starting to recover after a bearish dip, showing early signs of momentum turning back positive.
* Stoch RSI: Pushing back toward overbought, suggesting buyers are regaining control, but overextension risk remains.
* Key Levels: Support sits at $603–602.9, with a deeper floor at $600. Resistance is overhead at $608–610, aligning with the wedge breakout zone.
Intraday takeaway: QQQ is set for a decisive move. Above $608, it could press into $610+, but losing $603 risks a flush back into $600.
Options Sentiment & GEX Outlook (1H Chart)
Gamma exposure highlights a clear battleground for tomorrow’s session:
* Gamma Walls:
* $606–608: Major call resistance cluster and highest positive GEX zone.
* $600: Gamma pivot and HVL level — critical support where dealers may defend.
* $595–590: Heavy put walls below, acting as downside magnets if $600 breaks.
* Implications:
* Holding above $603–606 keeps price magnetized toward $608–610.
* A breakdown under $600 would trigger dealer hedging pressure, driving the Qs toward $595–590.
* Volatility Context: IVR at 17.8 is low, while options positioning skews bearish with 44.8% puts. This suggests traders are hedged defensively, which could amplify a sharp move either way.
My Thoughts & Recommendation
For Oct 3 trading, QQQ is boxed into a gamma range with clear pivot levels:
* Intraday (scalping/trading): Favor longs above $606, aiming for $608–610 breakout. Shorts become attractive on rejections near $608 with downside into $603 and $600.
* Options trading (swing/0DTE): Calls only make sense if QQQ breaks $608 with volume, targeting $610+. If QQQ loses $603 and especially $600, puts toward $595 offer better risk/reward.
Bias heading into Oct 3: Neutral with breakout potential — $608 is the level that decides.
Disclaimer:
This analysis is for educational purposes only and does not constitute financial advice. Always do your own research and manage risk before trading.
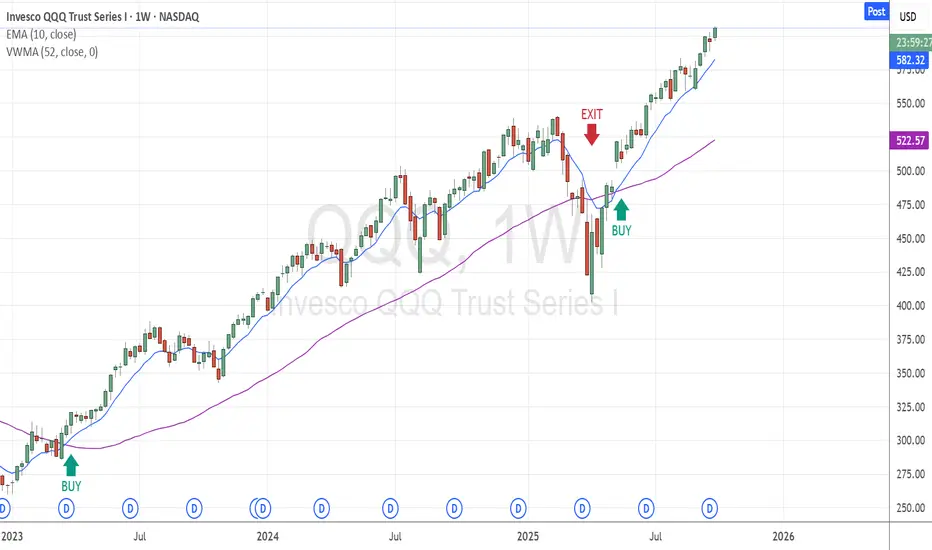
Simple Investment Strategy (Long Term only)This strategy is designed for long-term investors using a simple, two-indicator setup on the weekly chart:
• VWMA (Volume-Weighted Moving Average) – 52-period
• EMA (Exponential Moving Average) – 10-period
✅ Entry Signal (Buy)
• Enter a position when the 10-period EMA crosses above the 52-period VWMA.
This crossover suggests a potential upward trend supported by volume.
❌ Exit Signal (close Long Position)
• Exit the position when the 10-period EMA crosses below the 52-period VWMA.
This indicates a possible trend reversal or weakening momentum.
💡 Additional Note
• When the 10 EMA is below the 52 VWMA, it's best to stay in cash and wait patiently for the next bullish crossover. This helps avoid false entries and keeps you aligned with the broader trend.
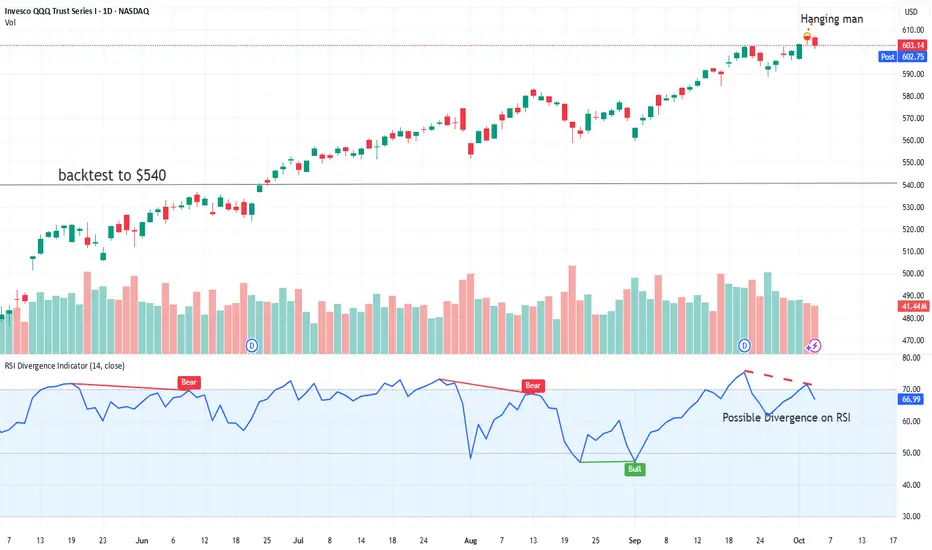
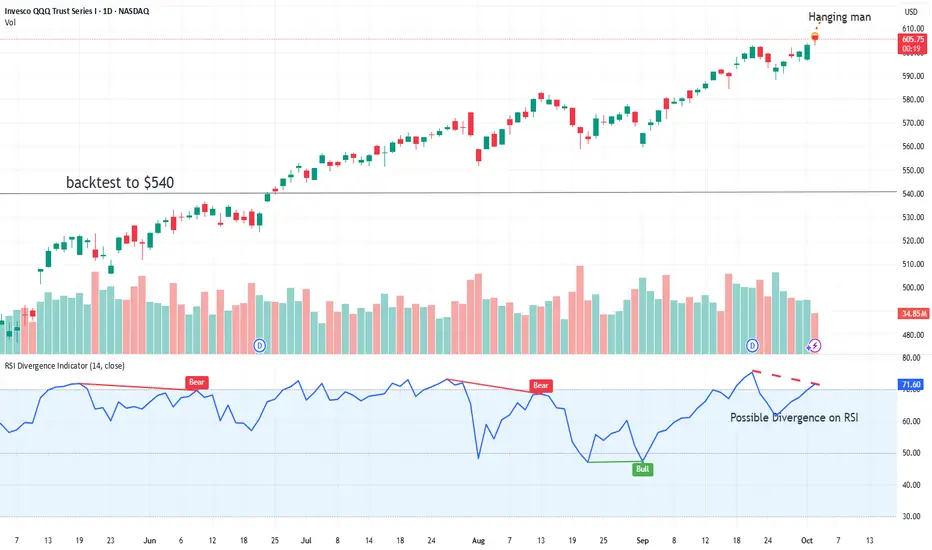
Possible Bearish Divergence with Hanging Man HammerPossible reversal pattern. Lower Highs on RSI with Higher Highs on price.
Daily candle is a hanging man.
QQQ Measured Moves & PivotsDo you chase the breakout, or wait for confirmation?
1. Buy calls now (since $605 cleared premarket)
PROS
You’re aligned with momentum
If price rips to $610+ off the open, you’re already in
Confirms the bullish measured move extension scenario
CONS
Premarket breaks often fake out at cash open
Chasing is a weaker risk/reward if it pulls back
You’re buying higher IV at the open, which inflates call premiums
2. Wait for retest of $600–$602 support
PROS
Cleaner entry with defined risk (stop under $598)
Better pricing on calls if IV cools during the dip
Confirms bulls are defending $600 as new floor
CONS
You might miss if there’s no retest and it rockets straight to $610+
Discipline can feel like “missed trade” even though it’s good risk management
3. Balanced Play (what many pros do)
Scale in with a starter call position on the breakout (>$605)
If $600–$602 is tested & defended with volume, add size
That way you’re not empty-handed if it runs, but you still get confirmation if it pulls back

QQQ Bullish Continuation BiasThat long lower wick + strong volume at the end of the day shows the dip was bought aggressively (buyers stepped in quickly when price pulled back)
Confirmed with volume so not just a “wick,” but actual conviction (institutions/algos defending the level)
That turns what could have been a “top signal” into more of a healthy consolidation candle inside an uptrend
When you see long wicks + heavy volume near support or resistance, it’s usually a sign of absorption with big money is willing to take the other side
At $600–$603, that’s especially important because it’s both a breakout retest & psychological level
As long as price holds above $600, that wick + volume combo suggests bulls still in control
A move through $605 on volume now has higher odds of continuation toward $610
Only if we see heavy sell volume without the wick (closing weak under $600) would it flip to bearish

QQQ : Stay heavy on positionsQQQ : Stay heavy on positions (QLD, TQQQ)
Entering a risk-on, high-volatility zone.
In stay light on positions zones, I hold QQQ and reduce exposure.
In stay heavy on positions zones, I increase allocation using a mix of QLD and TQQQ.
** This analysis is based solely on the quantification of crowd psychology.
It does not incorporate price action, trading volume, or macroeconomic indicators.
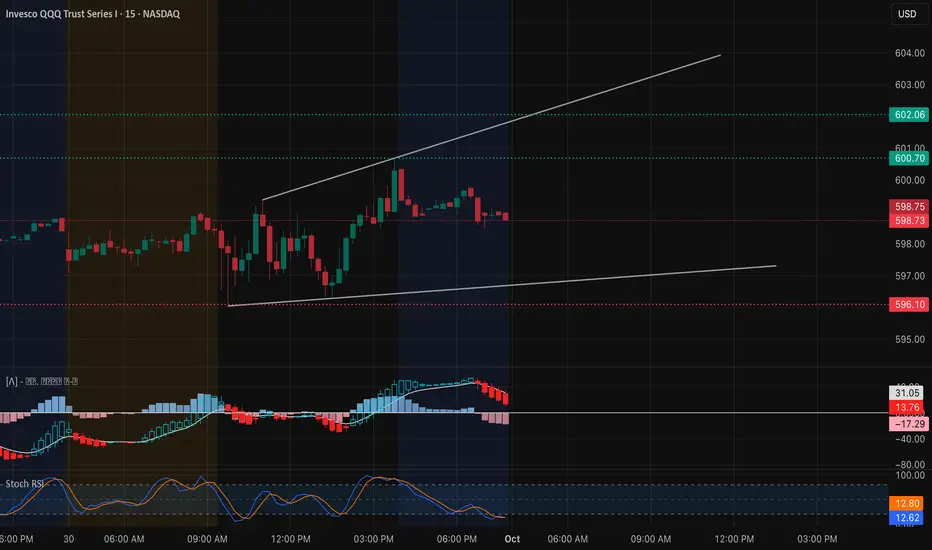
QQQ Oct. 1 – Holding $600, Gamma Pin in Play Intraday View (15-Min Chart)
QQQ has been grinding higher but is now consolidating just above the key $600 handle. The wedge channel shows buyers defending dips, though MACD and Stoch RSI are cooling off.
* Support Levels: $598.75, $596.10, $592.78
* Resistance Levels: $600.70, $602.06, $604.01
* Indicators: MACD histogram rolling red, signaling momentum slowing. Stoch RSI back near oversold, suggesting dip-buyers may step in at lower supports.
📌 Intraday Thought (Oct. 1): As long as $598–$600 holds, QQQ can push for $602+. A breakdown under $598.7 risks testing $596 and below. Intraday scalpers can play the $600 line for both quick bounce longs or rejection shorts.
Options & Swing View (1H + GEX)
Options flow paints a gamma box around $598–$602.
* Upside: Gamma wall at 602, with extensions toward $604. A break above 602 could open momentum toward 605+.
* Downside: Heavy put support at $595, with deeper levels down near 590.
This positioning suggests QQQ may chop between 598–602 near-term unless a catalyst pushes it out of range.
* Bullish Play (Oct. 1): Calls or spreads targeting $602–$605 if $602 breaks with volume.
* Bearish Play: Puts toward $595–$592 if $598 cracks.
* Neutral Play: Sell iron condors between $598–$602 while pinned.
My Thoughts (Oct. 1)
QQQ is showing a classic gamma pin scenario at $600. Market makers may try to keep price trapped here, but a strong break outside $598–$602 will dictate direction. If tech earnings or macro headlines hit, expect that gamma dam to burst and volatility to expand.
Disclaimer: This analysis is for educational purposes only and does not constitute financial advice. Always do your own research and manage risk before trading.
QQQ Sitting Near HighsQQQ is in a long-term uptrend, but near-term is at decision resistance ($603)
Short-term momentum looks stretched, while the 1h/4h charts suggest buyers still have control unless $588 breaks down
15m chart suggests overbought, signaling short-term caution
1h chart shows QQQ is building momentum, leaning bullish if $603 breaks
4h chart shows the larger uptrend intact, sitting near highs, but momentum slowing
1. Bullish
Breakout above $602–$603 (double-top resistance)
Short-term signals QQQ is overbought, so some chop/pullback may happen before a clean breakout
Medium-term shows RSI trending up, Stoch rebounding, which suggests fuel for another leg higher
Bigger picture is still in a strong uptrend, consolidation near highs, no major breakdown
$610–$615 (measured breakout & round number magnet)
$622–$625 (extension if momentum holds)
Stop-loss (risk control) at $596–$598 (to avoid false breakout traps)
~55% (slight edge to bulls)
Trend favors upside, momentum still constructive on 1h/4h, but 15m overbought tempers confidence
2. Bearish
Failure to hold $600 could test $588 neckline
Short-term is overbought, ripe for a pullback
Medium-term double-top structure is still in play if rejection holds
Bigger picture retracement levels ($560–$567) if neckline fails
Pattern risk (double top) is real, but bulls still control trend unless neckline gives way
$588 (neckline)
$572–$573 (measured move from double top)
$560–$567 (Fib support, must hold for bull trend survival)
Stop-loss (risk control) above $603–$605 (don’t fight a breakout)
~45%
