QQQ to 333my ideal scenario would be a rejection off 303.17 to go short w/ pt at 294.43, then long from there to 328.92.
QQQ trade ideas

$QQQ on 1hour Potential Reversal to downside$QQQ on 1hour Potential Reversal to downside
Just some quick TA. :)
Looking for a pullback to $296.31 to $295 range as an estimation.
VWAP is shifting and money is leaving as indicated by the red on my indicator.
Despite the trend line i have noted to the upside from previous charting, there is long legged doji. NOTE: A long tailed djoi is a sign of potential reversal as i have circled.
This area is the area i am paying attention to for the next few candles for today's trade.
lWhat is a Long legged Doji?
A long-legged doji signals indecision about the future direction of the underlying security's price.
Long-legged dojis may also mark the start of a consolidation period, where the price forms one or more long-legged dojis
before moving into a tighter pattern or breaking out to form a new trend.
What are your thoughts?
Comment Below!
Thanks,
Kelly

#QQQ #BEARISH TREND - QQQ Fake breakout to the upside- weekly Bearish pattern on weekly candles, getting a healthy correction to the upside and going back down

$QQQ #QQQ- BEARISH WEEKLY PATTERNBearish pattern on weekly candles, getting a healthy correction to the upside and going back down

The Impact of Interest Rates on the Stock MarketWe have the 50 EMA at 295 and the 34 EMA at 293. The fact that the price is currently trading above both of these EMAs suggests a bullish trend in the market. This means that buyers have been in control and pushing the price higher.
One important concept to keep in mind when trading with EMAs is the idea of support and resistance. In an uptrend, the EMA can act as a level of support, as we saw with the 34 EMA at 293. Traders can look for buying opportunities when the price pulls back to this support level and starts to bounce back up.
Another concept to consider is the idea of trend following. Since the price is currently trading above both the 50 EMA and 34 EMA, traders may look to enter long positions in the direction of the trend. This means looking for buying opportunities and avoiding selling opportunities.
However, it's important to note that no trading strategy is foolproof, and there are always risks involved. Traders should always use proper risk management techniques, such as setting stop losses, to protect against potential losses.
In summary, the trading situation for QQQ suggests a bullish trend in the market, with the price currently trading above both the 50 EMA and 34 EMA. Traders may look for buying opportunities when the price pulls back to the EMA support levels, and should always use proper risk management techniques when making trading decisions.

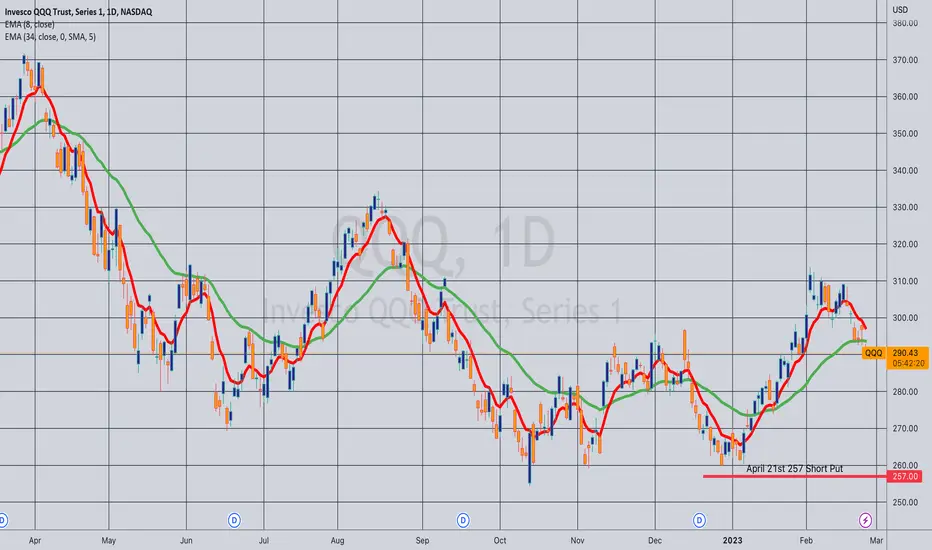
Opening (IRA): QQQ April 21st 257 Short Put... for a 2.64 credit.
Comments: Adding rungs here on this weakness, targeting the shortest duration <16 delta strike paying around 1% of the strike price in credit to emulate dollar cost averaging into the broad market.
Opening (IRA): QQQ March 10th 290/May 19th 332 LPD*... for a 30.67 debit.
Comments: After taking profit on my QQQ short delta hedge earlier, re-erecting it with the back month out in May. Buying the 90 delta back month, selling the 30 delta front, giving me around -60 delta/contract to offset a long delta portfolio.
30.67 cost basis with a 301.33 break even on a 42 wide.
* -- Long put diagonal.

$SPY & $QQQ Market BEARS NO FOLLOW Through, V shaped bounceYesterday i talked about 3 scenarios where one of them was we break below the double bottom support at 290 area for QQQ and bears have no follow through and we V shape.
Essentially its exactly what happened bears had a nice overnight drop and pre-market control, the moment market opened bulls took over filled the gap within the first 30minutes.
- Red flag for bears was when we re-tested that 290 support becoming resistance bears couldn't bring the price down to new low of the day, we hovered close to it and re-tested again and broke bull back above it. That's when shorts started covering here and we get a nice move up.
- looking for a 4H trend change to the bulls to have any meaningful bull follow through.
- still holding my TQQQ $21.57 entry.

QqqBreaking out of its wedge today..
Looking for a push up to 296 then a small pullback before moving to 301 gap close

Probable short term bottomsuper basic TA, gapped down huge green bar of buying came in. Good opportunity to go long

TECH QQQ. This is THE moment. I would argue today's daily close is the proper but hypothetical horizontal 50% fib line, which if confirmed, supports the next target. Like, 25-30% higher. Wowza. If we slip below this line in the sand, I have a feeling we're all terribly screwed. But if we rally off this line, and it is in fact the 50% line, then that means the market could see that other 50% this year end. I'm targeting September as the top, assuming these levels keep working. I find that the indexes switch between horizontal fib levels and properly fitted channel fib levels. They collect and find support or resistance on either. My channel is all time on the nasdaq, with projection based on 2000 bubble being the 61.8% of this channel, which puts the top where it is. I think we will make a run for the top to close this channel before we see a Wyckoff selloff by institutions at the top (and the last quarter of 2023). I see no signs of institutional selling in large volume whatsoever on my market internals. Tell me if I'm wrong. I'm not talking about derivatives and big bets we'll break key levels. The question is, will the small cap break out? I see RIVN with sellers exhaustion today, sign of the turn. And it is reflective of overall sentiment. I'd like to see ARK fund and it's holdings have a rapid short covering to add to next large cap rally and we'll be on our way into this thesis. And it is totally based on market internals and previous price action. Unbias. No news. No Fed. I don't care. But also, if this ends up happening... wowza.

QQQ Looking super double toppy ish right now - almost text bookSo im looking at a textbook look at a double top pattern and this set up looks to be almost identical - There's going to be a drift higher before the fade really comes in. That may be in the form of a slight green day Thursday into Friday but I would wager that Friday is gonna start a blood bath. Worst case scenario Monday its going to drop off for a nice money maker move.
you can play a few options here that give decent time and are reasonably priced and will most likely allow for even better entry before the drop off.
Casino Style: exp 2/24 $295 PUT
Risky but cheap and might payoff big: exp 2/28 $290 and $295
Reasonable across the board in terms of time and cost -- exp 3/17: $280, $285, $290
3/31: $280 - should provide little worry and good % back on money
ALL THAT being said - as soon as the PT of $285/$284 is hit its time to bounce - that's what ill be doing - obviously with some of the longer exp you could hold longer...
forextraininggroup.com
I tried to put the image on here of the textbook pattern but couldnt figure out how so heres the link

What goes up must come down.Imagine we break that trend line that has held the market for over 8 years. Stimulus for the market is like a drug you feel good for the moment and then it all goes back to how it really is.
Be prepared for the next great depression.
Hard times create strong men.

QQQ SHORT TERM BUY OPPURTUNITYQQQ short term buy oppurtunity. Island reversal pattern was spotted on the yesterday close.

QQQ: Reviewing possible scenarios for 2023The base case scenario includes a volatile market which ranges between 270 and 330. As long as QQQ trades above 266, the base case scenario is in the cards. QQQ could however suffer significant losses if the key level around 266 does not hold. If market breaks 266 to the downside, major supports are located around 210 and 162.
Resistance = 310, 330 and 347
Key support = 266/270

QQQ Short 2/28 - 3/1: PriceQQQ Price action has a prem-market increase overnight to 295.04. Expecting price to move on downside towards 291.75-294.25.
Setting StopLoss OR roll at 296.65.
Considering a Call Cred Spread 1-2 DTE at 294/296.
Considering a Put Option at market open (Tuesday 2/28) at price 294.75-295.25; would considering averaging down Put Option if price extends towards 295.25-295.65 with an appropriate StopLoss adjustment.
