QQQ BEARWeekly Bearish Engulfing candle on QQQ after support was broken Friday of last week. Price is also failing to make higher highs on the lower time frames indicating buyers have yet to step in which potentially means more downside for the market.
QQQ trade ideas

Opening (IRA): QQQ March 17th 288/May 19th 327 LPD*... for a 29.86 debit.
Comments: Re-establishing my short delta hedge against a long delta portfolio, buying the back month -90 delta and selling the front +30 to give me -60 delta of hedge per contract. This is not a comment on where the market goes from here, but rather protection to keep me from filling my diaper in the event the market sells off (although you can certainly use this setup to take a directional shot, too).
Cost basis of 29.86 with a 297.14 break even on a 39 wide.
* -- Long Put Diagonal

Earnings recession is becoming more apparentFollowing the FOMC’s rate hike, markets continued to rally yesterday until the closing bell when tech giants Alphabet, Amazon, and Apple reported their earnings. Bleak numbers poured cold water on a rally, and in after-market trading, Nasdaq 100 index fell more than 2.5%. However, this move quickly recovered, highlighting the market's growing fragility. With VIX near yearly lows and now evident earnings recession, we will seek a decline in volume accompanying the rising price to suggest a rally’s exhaustion.
During the summer of 2022, we noted that declining corporate earnings and outlook downgrades in 3Q22 and 4Q22 would confirm our bearish thesis about the market progressing deeper into recession. With this being reflected in the data, we will pay very close attention to labor market data, which lags behind other indicators. To further confirm our bearish thesis, we want to see a pick-up in unemployment and small business bankruptcies, which will put the current mainstream narrative about “soft-landing” to the test (together with the FED not cutting rates).
Alphabet - full-year 2022 results.
Net income = $59.97 billion
(vs. net income of $76.03 billion in 2021; -21.1% YoY)
Operating income = $74.84 billion
(vs. $78.71 billion in 2021; -4.9% YoY)
Revenue = $282.83 billion
(vs. $257.63 billion in 2021; +9.8% YoY)
Alphabet disclosed that it expects to incur (in 1Q23) employee severance and related charges of $1.9 billion to $2.3 billion in relation to its layoffs of 12 000 people announced in January 2023. Additionally, it anticipates exit costs in regard to office space reductions of approximately $0.5 billion during that same quarter. Furthermore, the company expects a significant reduction in the depreciation of its equipment and servers throughout the entire year 2023.
Amazon - full-year 2022 results.
Net loss = $-2.7 billion
(vs. net income of $33.4 billion in 2021; -108% YoY)
Operating income = $12.2 billion
(vs. $24.9 billion in 2021; -51% YoY)
Net sales = $514 billion
(vs. $469.8 billion in 2021; +9.4% YoY)
Amazon saw a massive drop in net income (YoY) in 2022, from $33.4 billion to a net loss of $2.7 billion. The company expects its net sales to drop by more than 15% in 1Q23 (vs. the previous quarter) and suffer unfavorable impacts from exchange rates.
Apple - 1st quarter FY2023
Net income = $29.98 billion
(vs. $34.63 billion a year ago; -13.4%)
Net sales = $117.2 billion
(vs. $123.9 billion a year ago; -5.4% YoY)
Operating income = $36.01 billion
(vs. $41.48 billion a year ago; -13.2% YoY)
Illustration 1.01
Illustration 1.01 shows the daily chart of NQ1!. At the moment, the price deviated too far from its 20-day and 50-day SMAs, making a case for the retracement. A breakout below Support 1 will bolster the bearish odds in the short term. Contrarily, a breakout above Resistance 1 will be bullish.
Technical analysis
Daily time frame = Bullish
Weekly time frame = Bullish
Illustration 1.02
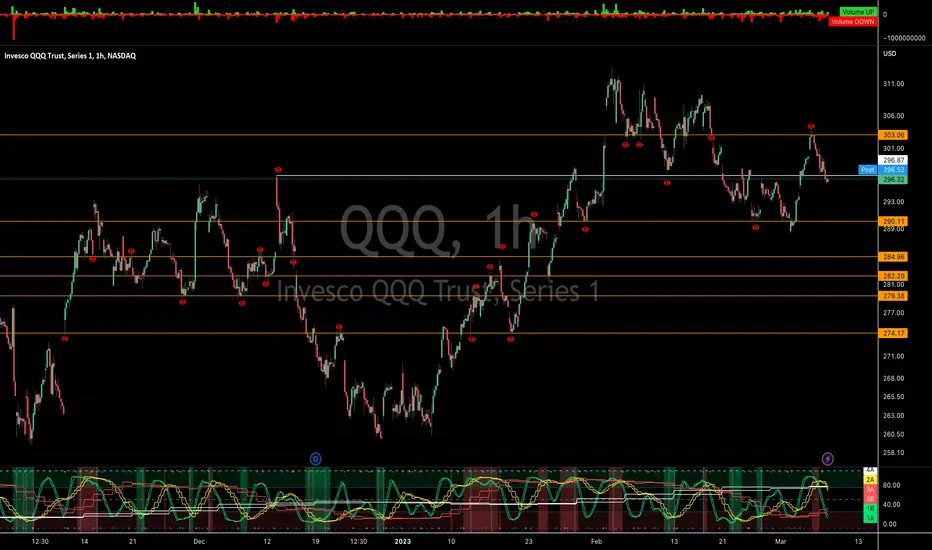
Illustration 1.02 displays the daily chart of QQQ. The yellow arrow hints at bullish volume growth. A decline in volume accompanying the rising price will hint at declining momentum and potential trend reversal.
Please feel free to express your ideas and thoughts in the comment section.
DISCLAIMER: This analysis is not intended to encourage any buying or selling of any particular securities. Furthermore, it should not be a basis for taking any trade action by an individual investor. Therefore, your own due diligence is highly advised before entering a trade.

The definition of make or break area 🔭close below 288.48 and we see more downside next few weeks, but bounce here and we probably bounce to 300-312 🎯
boost and follow for more/if this helped 💛

(WARNNG) Extreme Bear Volume in $XLF, Shorting next hourly LH- QQQ double topped with Tuesday top, had a 15m bull flag during consolidation with no red flags until mid morning.
- XLF increasing bear volume with zero bounce and very notable big money exiting. Fear creeped into the market
- VIX up 20%
- QQQ went from lead bull to bear when all sectors starting to drop at the same time after XLFs huge drop. dragging SPY down too.
- lots of negative news and sentiment regarding banks and how much they dropped SI down over 80% in just two days.
- Bears now in total control.
- huge drop in XBI & IWM as well.
SMH might go from lead bull to lead bear tomorrow
looking to short the next hourly or 15m lower high pretty much almost on any bounce if we get a bullish reaction to data tomorrow during PM will be shorting that bounce.


Heading to 320Initial target 309-312 by mid next week, then 319-322 by March 30th
Could test as high as 325
About to start run today or tomorrow, likely in the next couple hours

QQQ daily is ready for a massive move - likely downQQQ's daily chart shows that it is currently in a symmetrical triangle formation within a larger symmetrical triangle. As the price is reaching the end of the symmetrical triangle, a breakout is imminent, which will likely be confirmed by higher volume.
The current price is below the 20-day moving average, which is bearish, but it is still above the 50 and 200-day moving averages, which is bullish.
The volume confirms a bearish sentiment, as the volume on down days is larger than on up days.
The RSI and MACD are neutral and are not showing significant movements.
Overall, QQQ is expected to make a significant move either up or down. Bulls should consider buying in, especially if the price breaks above the upper trend line, which would open the door for a retest of the 305-307 area where the trend line from the larger symmetrical triangle is located. Additionally, in case of breaking out, the upcoming golden cross in a few days would have much more strength.
However, if QQQ drops out of the symmetrical triangle, it may not find support at the major support levels of the 50 and 200-day moving averages, which are very close to the breakout area. In this scenario, the golden cross will not be significant, and the price could test the lows from last year.
I am giving a 70% chance of going down and going down hard!

SPY & QQQ 15m Trend Change Back to Bulls, Need 1h trend change - After this mornings hourly bear flag with no follow through from bears bulls try to play defense and we had a megaphone pattern play out in the morning.
- QQQ was holding SPY up for the entire day, then the last 30mins bear sectors in SPY joined Bull sector QQQ.
- need to confirm a hourly uptrend to set the daily higher low for bulls.
- would like to see bulls play offense tomorrow.

QQQ flirting with trend resistance - 30 mins chartQQQ flirting with trend resistance - 30 mins chart


QQQ Support and Resistance is KEYI have a short story for you all but first it's important to mention that we're right at an important level that was created on December 13. If we stay trading below this level, the next important level is near 290. That's a decent drop from where we are today. Keep a watchful eye on your indicators as there's more downside as a possibility.
Once upon a time, there was a young trader named Jack. He had just learned about support and resistance levels in trading and was eager to apply his newfound knowledge to the markets.
Jack studied the charts and noticed that the price of QQQ was approaching an important resistance level. He knew that if the price broke through this level, it would signal a bullish trend and the bulls would be in control of the market. However, if the price failed to break through the resistance level, it would indicate a bearish trend, and the bears would be in control.
Jack placed an options trade on QQQ, betting that the price would break through the resistance level. However, the market had other plans. The price failed to break through the resistance level, and instead, it started to drop rapidly.
Jack watched in horror as his trade plummeted. He quickly realized that the bears were now in control of the market. He tried to cut his losses and sell the stock, but it was too late. The market had already moved against him, and he had lost a significant amount of money.
Jack learned to always pay attention to support and resistance levels in trading. He knew that if the price was below an important resistance level, it was a sign that the bears were in control, and he should avoid placing bullish options trades. Instead, he would wait for the price to break through the resistance level before placing any trades, ensuring that he was always trading with the trend and not against it.
Jerome Powell And 15m 12 EMA Bear Control SPY & QQQ After breaking 12 EMA 15min time frame yesterday bears have been suing it for full control underneath it.
- at this price point SPY retraced over 60% QQQ retraced 50%. Burden is on the bulls to step up here. Bear still comfortable
- if QQQ start dropping more than 50% retracement everything will start favoring the bears
- Jerome Powell spoke today and now market is pricing in 71% chance of a 0.5% bps hike. he is speaking again tomorrow mornings 7am
- Very key area for battle between bulls and bears now.

QqqGames .....
Unless we break below 296.50 (200ema]
We are headed back to 304 and maybe above ..
. If we break back below 296 then we will revisit 290
I'm leaning Long here... even though QQQ and NDX closed there gap, IXIC (Nasdaq) didnt

15m 12EMA Perfect Guide For Both Long & Short QQQ & SPYLast week i mentioned the 15m 12 EMA guide for holding onto profits for both SPY and QQQ which we bounced off again this morning. After we broke the 15m 12EMA today i took a day trade on SQQQ and sold it close to the end of the day because we are still in a strong hourly uptrend and I do not want to hold overnight playing countertrend.
Notes:
- still need to change 4h and daily trend to uptrend, currently in neutral trend
- Even thought i shorted today im still leaning bullish on SPX and NASDAQ for longer time frame in 4h / daily and weekly. until price action tells me otherwise so would likely be looking for another TQQQ entry.
- Powell speaking this week
- we shot straight up 5.5% on QQQ into resistance a pull back for consolidation was very likely

My Mid- Long-Ter Trade base on price behavior.The outcome is uncertain, but all we can do is manage risk.

QqqFinish the leg up today... I thought they would've saved it for later in the week but Goldman gave apple alot of love ❤
Pullback starts now
Target -298
Stop loss 305

2022 vs 2000 fractal 2022 weekly looks a lot like 2000 daily. It's starting to take detours, but if you removed the red box and pasted the blue box from where it dropped, it matches up with 2000 pretty well still. I wouldn't use this to trade, but it's interesting how close the structure is.

Qqq ideaTaking a short here it’s a resistance with rsi at 90 is and with Powell talking tomorrow . I think the market pullback to 295 tomorrow also closing my SQ calls here

QQQ Nasdaq 100 ETF Price PredictionOn March 7th we have the Fed Chair Powell Testimony, that could reveal that the FOMC is going to hike the interest rates for a longer period of time, and maybe give us a clue if it`s the case for a 50bps increase after the next meeting.
On March 10th we have the Non Farm Payrolls and Unemployment Rate that could also fuel a potential 50bps hike if they come better than expected.
In this context, my price target for QQQ Nasdaq 100 ETF is $285 by Mid-April.
Looking forward to read your opinion about it.

Qqq Broke out off the wedge Friday, now Looking for a pullback and retest off 296. Before the next leg higher to 303 gap close

