TSLA Testing a Key Support — Will Buyers Step Up? (Nov 19)TSLA has been drifting lower ever since rejecting the 423–440 supply zone, and now price is sitting right on top of an important support shelf around 397–401. This level has been tested multiple times and has acted as the midpoint of the entire October–November structure.
Tomorrow (Nov 19) will tell us if this support holds — or if TSLA breaks into the deeper liquidity zone toward 380 and below.
📌 TSLA — Daily Structure (1D)
The daily chart shows TSLA losing its rising trendline from August and pulling back toward the first major demand zone.
Key levels:
* 423–440 → Major supply, previous rejection
* 401–398 → Immediate support
* 380–381 → Next liquidity sweep
* 213 → Deep macro demand below
Right now TSLA is sitting right between two worlds — still above the major breakdown level, but below all the recent bullish structure.
📌 TSLA — Intraday Trend (1H)
The 1H chart shows a clean sequence of CHoCH → BOS → lower highs, confirming the short-term downtrend.
Short-term zones for tomorrow:
Resistance:
* 404–408 → First lid
* 415–423 → Major resistance + heavy supply zone
* 440 → Macro rejection zone
Support:
* 397–398 → Current support
* 380–381 → Next high-volume liquidity zone
* Lose 380 → quick move into 370s
The intraday structure stays bearish unless TSLA reclaims 408–415.
📌 TSLA — GEX Levels for Nov 19
This adds the real roadmap for tomorrow.
CALL Walls / Resistance
* 415 → Heavy call wall
* 423–430 → Largest positive GEX cluster
(This is why TSLA struggled to push higher all week)
PUT Support
* 398–400 → Highest negative GEX / HVL support
* 390 → Second put wall
* 380 → Strong third wall
TSLA is sitting directly on the 398–400 GEX shelf.
Lose this → 390, then 380.
📈 Bullish Scenario (Bounce From Support)
TSLA must hold 397–400 early in the session.
If buyers step in:
1. Reclaim 404–408
2. Push into 415 (first big wall)
3. Clear 415 → move toward 423
4. Break 423 → opens path toward 430
TSLA is bullish only if it breaks 408 first.
📉 Bearish Scenario (Break of Support)
If TSLA opens weak or rejects 404–408 early:
1. Drop back into 398–400
2. Lose 398 → straight to 390
3. Lose 390 → strong magnet toward 380–381
Your 1H chart structure supports this: BOS levels all pointing downward.
🔎 My Outlook for Nov 19
TSLA is sitting on a key support shelf (398–401), but momentum is still bearish. Unless TSLA reclaims the 404–408 range early, sellers continue to have control.
Bias:
* Neutral → Bearish below 404
* Bullish only above 408 → 415
As long as TSLA is under 415, upside is limited because of the heavy GEX resistance stack.
📌 Summary
* Daily trendline broken
* Support: 398–401, then 390 → 380
* Resistance: 404–408, then 415–423
* GEX strongest support: 398–400
* Bullish only above 408 → 415
* Bearish continuation under 398
⚠️ Disclaimer
This analysis is for educational purposes only. Not financial advice. Always trade your plan and manage risk.
Trade ideas
325 and then 800?Shaping up nicely to double next year. Most likely it will go down to 325 and if it can hold 325 then 800 coming next year most likely. If it looses 325 on a monthly basis then all bets are off.
Happy Trading. Not a financial advise.

Tesla at Key Support Level & Wins Ride-Hailing Permit in ArizonaTesla has secured a Transportation Network Company (TNC) permit in Arizona, marking another strategic step toward launching its robotaxi service. While the permit does not authorize Tesla to operate a fully driverless ride-hailing network, it grants the company legal approval to function as a ride-hailing operator under state regulations. This follows Tesla’s earlier approval in September to test autonomous vehicles with a safety driver on Arizona roads.
According to the Arizona Department of Transportation, Tesla applied for the permit on November 13 and met all regulatory requirements, receiving approval on November 17. The TNC license positions Tesla to begin laying operational groundwork for its robotaxi ambitions, fleet structure, service protocols, pricing models, and state compliance, while it continues advancing autonomous capabilities through its Full Self-Driving (FSD) platform.
Arizona has long been considered one of the most autonomous-friendly states, hosting early deployments from Waymo, Cruise, and other AV developers. Tesla’s entry expands the competitive landscape and brings its robotaxi vision closer to reality, though safety-driver supervision remains mandatory for now. The new permit reinforces Tesla’s strategic push into transportation services, signaling that regulatory pathways for FSD-enabled ride-hailing are steadily opening.
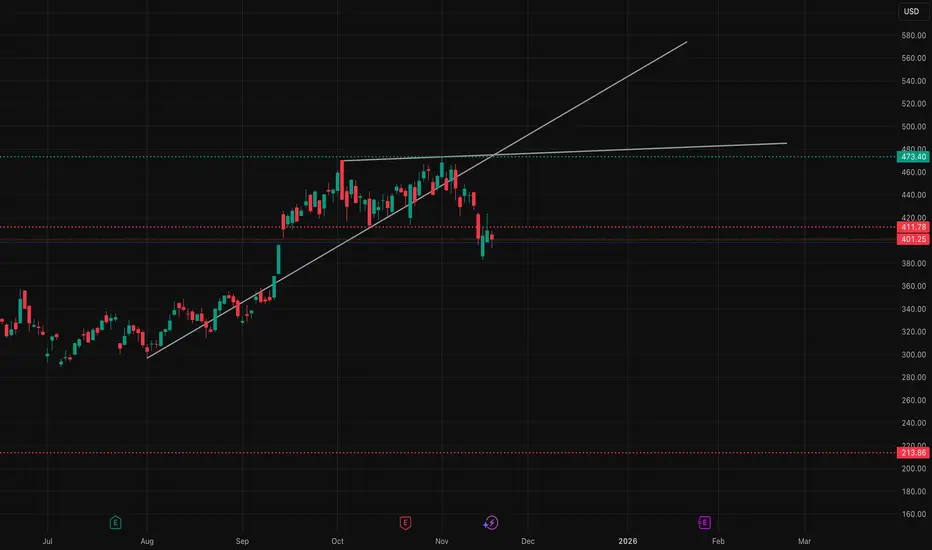
Technical Outlook
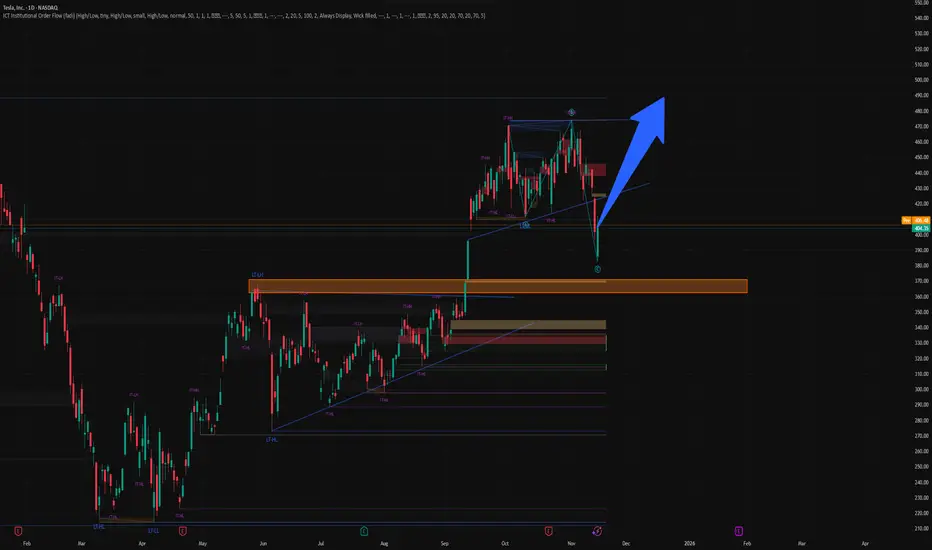
Tesla’s chart shows price pulling back into a key ascending trendline that has supported the uptrend since April. The current zone around $401 is a strong demand area, aligning with trendline support
A bounce from this level sets Tesla up for a potential continuation toward the major resistance at $488. A clean break above that level would confirm a medium-term bullish extension. RSI remains neutral, suggesting room for upside if buyers defend current support.
If the trendline fails, Tesla could retest deeper support near the $330–$345 range. For now, momentum favors a rebound as long as the trendline holds.
Tesla: DownwardShortly after our last update, Tesla experienced noticeable downward momentum, initially entering our previously magenta alternative target zone, which has already been stopped out. We currently consider the green wave complete, and the alternative target zone has been deactivated and grayed out. However, there's still a chance the stock could rise sharply, confirming an ongoing upward trend. If this alternative scenario, which has a 35% probability, plays out, we would mark blue wave alt.(II) as complete and expect gains above the resistance at $509.50 and $532.92 within a magenta upward impulse. Primarily, we anticipate further sell-offs and expect the regular wave-(II) correction low to occur first in our green target zone between $157.88 and $46.70. This green zone could potentially be suitable for long entries, protected by a stop 1% below the zone's lower edge.

TESLA — Bad Earnings + Overcrowded Trade = More Downside RiskSummary:
Tesla’s latest earnings disappointed again — weak margins, slower delivery growth, and unclear guidance on new product cycles.
Despite that, retail and institutional positioning remains heavily crowded, with traders still trying to buy every dip.
But when sentiment stays bullish while fundamentals weaken — that’s when distribution begins quietly.
Key points:
EPS miss and declining automotive margins.
Valuation still priced for perfection.
Lower volume reaction on bounces = fading demand.
Market rotation out of megacaps continues as yields stay high.
Technical setup (chart above):
Major rejection at 450–455 USD resistance (post-earnings rally exhaustion).
Potential continuation toward 420 → 397 → 372 USD support zones.
Short zone: 445–450
Target: 372
Stop: 455
Narrative:
The “AI car” story is overcrowded — even good news now fails to spark real follow-through.
If macro stays tight and rates high, Tesla could correct further before finding long-term buyers again.
💬 “When everyone already owns it, there’s no one left to buy.”

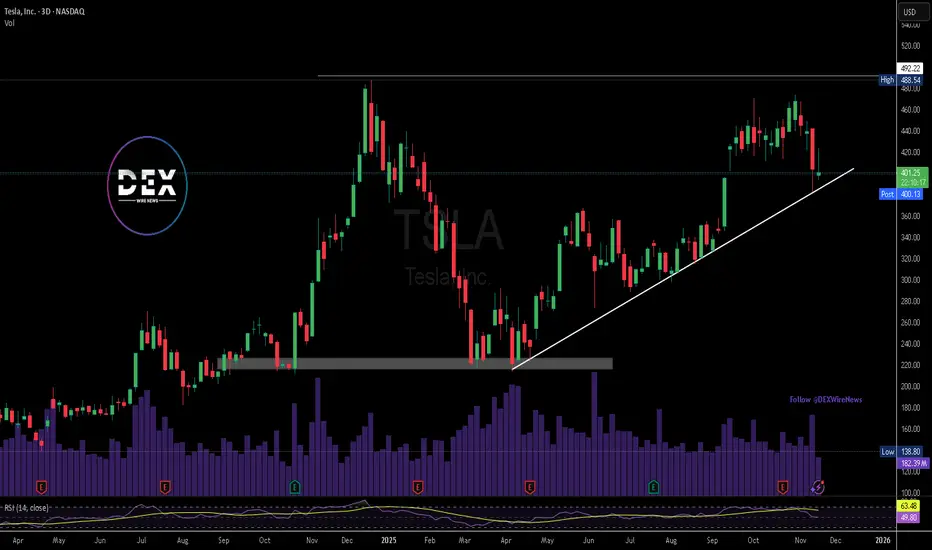
TSLA Bearish Setup: Double Top BreakdownTSLA’s 1D chart has shifted from a clean uptrend into a clear corrective phase. After a strong run into the $475 area, price printed a potential Double Top and then rolled over, breaking the neckline around $410 alongside a bearish Market Structure Shift. Price now sits below the 20 and 60-day MAs while still above the rising 120-day MA, framing this as a short-term bearish move within a longer-term uptrend.
The primary path favors further downside as long as TSLA stays capped below the $410–416 neckline zone and the $420 reclaim level. A daily close below the recent swing low at $385 would confirm continuation, opening room toward the $373 area and the 120-day MA support near $369, with an extended downside magnet around $360–345 if selling accelerates. MACD turning negative and increasing downside Squeeze Momentum both align with this bias.
If buyers manage to reclaim $420 on a daily close, that would threaten the bearish thesis by taking price back above the neckline and the 60-day MA. Such a squeeze could fuel a move toward $460 and potentially a retest of the $475 supply zone. Until that happens, rallies into $405–416 remain vulnerable to rejection.
Thought of the Day 💡: The strongest trade ideas start with a precise invalidation, not a prediction.
This is a study, not financial advice. Manage risk and invalidations.
-------------------------
Thanks for your support!
If you found this idea helpful or learned something new, drop a like 👍 and leave a comment, I’d love to hear your thoughts!

TSLA Losing Momentum – Uptrend Breakdown RiskLooking at the current picture, both news flow and technical signals show that Tesla is entering a challenging phase. A series of recent negative developments — from large funds selling off, to declining sales in China, and Elon Musk potentially taking a loss on his latest share purchases — have clearly shaken market confidence. As a result, TSLA has been under continuous selling pressure, and its price action has weakened significantly compared to the previous bullish period.
On the chart, the resistance area around $447 continues to act as a “steel ceiling”: every touch has been firmly rejected. The recent strong bearish candle pushed TSLA back into the Ichimoku cloud, breaking the short-term upward structure. More importantly, the price is now at risk of losing the uptrend line that has held since April, indicating that medium-term bullish momentum is fading.
If TSLA fails to reclaim the $430–$447 zone in the next recovery attempts, a drop toward $329 becomes a very realistic scenario — this level has been a major support in the past and aligns with the lower boundary of the primary trend channel.

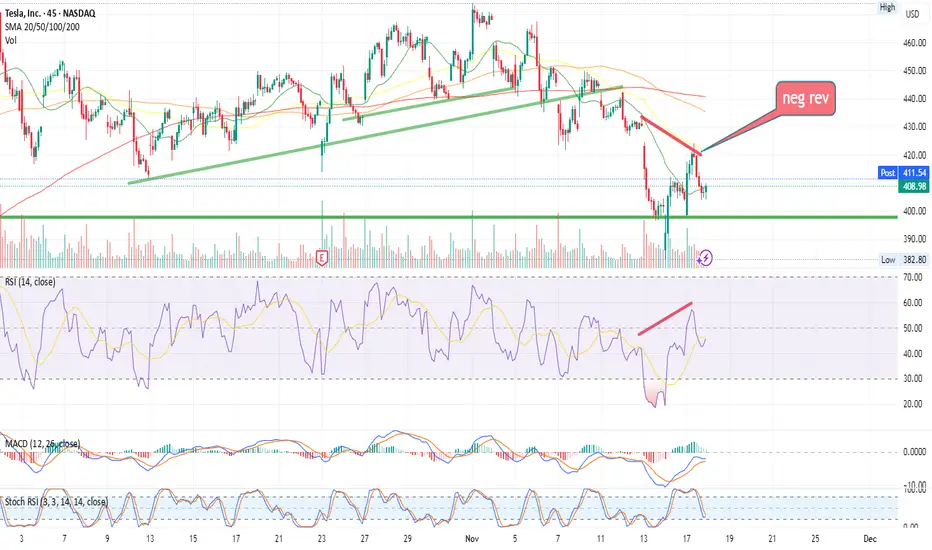
tsla negative rev on smaller timelooking like tomorrow will be seeing a downward continuation on the smaller time. to invalidate we need a push above 425.00 to have a failed signal.
$TSLA Update NASDAQ:TSLA has a solid finish today during the market stress test.
Please watch the recording for levels and price targets.
Cheers.

TESLA FREE SIGANL|SHORT|
✅TESLA Price reacts off a premium-priced supply block, showing bearish displacement and a clean break in structure. Retracement into the imbalance may fuel continuation lower.
—————————
Entry: 408.98$
Stop Loss: 424.00$
Take Profit: 392.00$
Time Frame: 4H
—————————
SHORT🔥
✅Like and subscribe to never miss a new idea!✅

Double Top - Rejection CandlesI do believe we are in the beginning innings of a mild "bear" market for the rest of the year. Too many folks wanting to sell high beta/valuation names. Add the Mag 7 collapse risk and TSLA is particularly vulnerable and may get unwound back to mid 300s.
We do have NVDIA earnings this Wednesday and jobs report on Thursday. I don't expect these events to change the thesis.
Add insult to injury, you have Peter Theil also lightening his TSLA position. And I don't think Elon's open market purchase on Sep 12 will support the stock price from falling back down to previous mid 300 level support
Look for long wick rejection candles like the ones highlighted with the hammers, these will confirm we are still in the downward phase.

QuantSignals V3 | TSLA Breakdown SetupTSLA QuantSignals Katy 1M Prediction 2025-11-17
Symbol: TSLA
Price: 415.30
Model: Katy AI — 1M Prediction
Trend: Bearish
Confidence: 75%
🔮 Vision Summary
TSLA shows a bearish short-term structure, with the model forecasting a move toward 403.52
(-2.84%). Momentum is shifting lower, and volatility remains moderate at 20%, supporting a gradual downside drift rather than a sharp drop.
Near-term projection points to 411.47 within the next 30 minutes as price weakens into lower support zones.
📉 Key Levels
Entry Zone: 415.30
Downside Target: 405.87 – 403.52
Resistance / Invalidation: 421.53
🧭 Vision Bias
Bearish — Model anticipates sustained downside pressure as TSLA fails to reclaim short-term resistance.
Break above 421.53 invalidates the bearish thesis.
Tesla BuyTesla has reclaimed the breakdown zone after a liquidity hunt, showing early bullish momentum. Price is pushing back into the previous range, offering a clean long setup with tight risk below the recent rejection zone. Upside targets align with the unfilled imbalance and overhead liquidity.
entering @415.3 keeping target as 445 trailing
NASDAQ:TSLA

TSLA: one more leg down potential NASDAQ:TSLA
Watching for one more leg down into the 430–400 mid-term support zone to potentially complete the corrective structure, if price remains unable to break out above the October/November highs.
Chart:
Alternatively, if price manages to break-out and stay above above recent resistance, odds favor continuation to 555-630 resistance zone.
Chart:
Previously:
• On macro bottoming potential (Jun 6):
tradingview.com
• On support (Sep 19):
• On mid-term support (Oct 7):

TSLA: Wave 4 or Explosive Momentum – Get Ready for a Big MoveTSLA: Wave 4 or Explosive Momentum – Get Ready for a Big Move
📈 Weekly Scenarios
Bullish scenario:
The price holds the $436–$449 zone, ending the correction with wave 4.
Breaks above $470–$471, triggering wave 5 → target of $488–$505+.
Consolidation:
The price is in the $436–$471 range, without a clear breakout, preparing for the next impulse.
Bearish scenario:
Breakthrough of support at $425–$397 → possible reversal or deep correction instead of growth.
✅ Conclusion
Tesla is at an important wave crossroads – it either completes the correction and prepares for a strong rally, or reverses downward.
Key points to watch: $436–$449 (correction support) and $470–$471 (resistance breakout).
Confirmation of the wave structure and price reaction at these levels will be critical for making trading decisions.
TSLA – Heavy Selling Finally Slows Down. TA for 11/17TSLA – Heavy Selling Finally Slows Down, but Buyers Still Need to Prove Themselves
TSLA has been one of the cleaner charts lately—not because it’s trending, but because the selling was so aggressive that the structure became obvious. Now that the drop has finally stalled, the real question is whether buyers can turn this into a recovery, or if today’s bounce was just a dead-cat reaction inside a bigger downtrend.
When I line up the 1-hour trend, the intraday 15-minute behavior, and the GEX levels behind the scenes, the situation becomes clearer.
1️⃣ 1-Hour Chart — Downtrend Still Dominant, but a Temporary Floor Formed
The 1H chart shows how sharp the selling was. TSLA broke every rising structure and couldn’t hold any mid-trend supports. It wasn’t until price flushed all the way into 380–385 that buyers finally stepped in with conviction.
What stands out is the wedge-shaped channel.
The upper trendline has been respected for days.
The lower trendline caught the bounce perfectly.
Now TSLA is sitting right in the middle of that wedge—not bullish, not bearish—just pausing after a strong decline.
Key 1H levels that matter:
* 423–424: First big resistance where every bounce fails
* 405–410: Local pivot zone
* 380–385: The level that saved TSLA from a deeper breakdown
Trading between these zones tends to be choppy, so I’m watching for a decisive break.
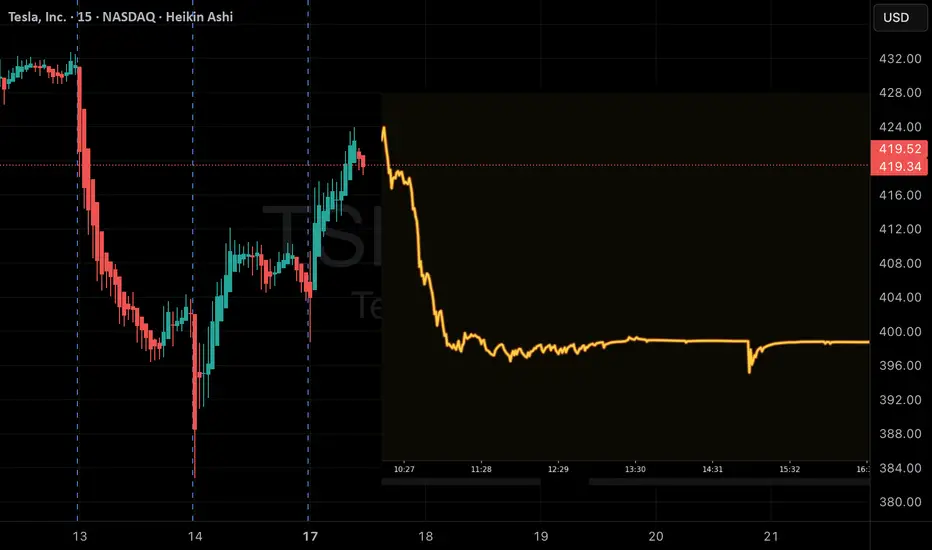
2️⃣ 15-Minute Chart — Short-Term Momentum Slowed, but No Reversal Yet
The 15M chart tells the real short-term story.
After the heavy downward move, TSLA printed a clean demand zone at 380–385 (multiple green FVGs). That’s where buyers finally stopped the bleeding. Price pushed up into 405–410, but stalled immediately. The last several candles show hesitation—buyers aren’t pulling away, but sellers haven’t fully taken over either.
The 15M structure right now:
* Strong demand: 380–385
* First barrier: 405
* Real test: 423–424
* EMAs are flattening, signaling indecision
The 15M chart is giving a “wait for confirmation” type of vibe. No clear reversal yet—just a temporary pause after a strong selloff.
3️⃣ GEX (1-Hour) — Finally Tells Us Where TSLA Wants to Go
This is the part of the chart that explains the hesitation.
Upside Levels (if buyers take control):
* 410: First meaningful GEX resistance
* 415: Stronger gamma wall
* 437–450: Multiple call walls stacked together
If TSLA ever gets above 424, the path toward 437–450 becomes much easier than it looks on the chart.
Downside Levels (if sellers return):
* 400: Light put support
* 395: Stronger hedge zone
* 380: Heavy put wall — explains the huge reaction today
* Below 380 → hedging accelerates toward 370
The GEX map lines up perfectly with what happened today:
Price bounced exactly at the deep put wall around 380, where market makers hedge aggressively.
This is also the kind of GEX structure that makes traders ask,
“Why does TSLA always bounce or stall at the same levels?”
—because these levels come from options positioning, not candles.
🎯 How I’m Approaching TSLA for 11/17
🔼 Bullish Plan (Only Above 410, Strong Confirmation Above 424)
This is not a name I want to jump early on.
TSLA is still in a downtrend, so the bullish scenario needs real confirmation.
Stock Trade Idea:
* Entry #1: Above 410
* Entry #2: Safer play above 424 (clean break of daily resistance)
* Targets:
* 430
* 437
* 445
* 450 (call wall + gamma cluster)
Options Idea:
* 420C / 430C for scalp
* 440C / 450C for swing continuation
* Only valid above 424
🔽 Bearish Plan (Below 400 → Downside Opens Fast)
If TSLA rejects 410 again or loses 400, the structure flips back to bearish.
Stock Trade Idea:
* Entry: Below 399.50
* Targets:
* 395
* 385
* 380 (major put wall)
* 370 if 380 breaks
Options Idea:
* 400P for scalp
* 385P or 380P for continuation
* If 380 fails → 370P becomes attractive
TSLA usually moves fast once it touches GEX/Put levels, so these can be sharp trades.
⚠️ Choppy Zone: 400–410
This whole zone is a trap area—lots of indecision, lots of fakeouts, thin conviction.
I avoid trading TSLA inside this zone unless volume spikes.
Final Thoughts
TSLA is in a spot where both bulls and bears have clean levels to play off. Today’s bounce was strong, but it came directly from a major put wall, so the reaction makes sense. The real direction doesn’t start until TSLA breaks either 410 up or 400 down—everything in between is chop.
Once one side wins, the move should be clean because both the chart and GEX positioning align on the next targets.
Disclaimer
This analysis is for educational purposes only and does not constitute financial advice. Always manage your own risk.

TeslaPrice finally made it down into the target box last Friday and already bounced higher moving back out of the box. Rather we make another low towards the 1.382 remains to be seen. If we have bottomed in what I am calling minor A, then we should move higher to the $440-$450 area next. There also remains the possibility that we get another high if intermediate (B) is yet to complete.
Currently price is moving down in the overnights. If we can get some more data pointing higher, though, I will begin tracking that move with fibs. Until then, there remains the very real possibility that we get another low.

TESLA Technical Analysis! BUY!
My dear friends,
Please, find my technical outlook for TESLA below:
The price is coiling around a solid key level - 404.39
Bias - Bullish
Technical Indicators: Pivot Points Low anticipates a potential price reversal.
Super trend shows a clear buy, giving a perfect indicators' convergence.
Goal - 426.96
About Used Indicators:
The pivot point itself is simply the average of the high, low and closing prices from the previous trading day.
Disclosure: I am part of Trade Nation's Influencer program and receive a monthly fee for using their TradingView charts in my analysis.
———————————
WISH YOU ALL LUCK

Tslar4BearsThe
tslar's
elon musk recent vote likely to favor
the
bears temporarily
as
we
go
into
the
new
week
Though the year may likely end bullish

TSLA BULLISH BIAS RIGHT NOW| LONG
TSLA SIGNAL
Trade Direction: short
Entry Level: 404.30
Target Level: 433.84
Stop Loss: 384.55
RISK PROFILE
Risk level: medium
Suggested risk: 1%
Timeframe: 5h
Disclosure: I am part of Trade Nation's Influencer program and receive a monthly fee for using their TradingView charts in my analysis.
✅LIKE AND COMMENT MY IDEAS✅

TSLA 1D: bounced at 380, now 412 decides if 530 is on the tableTesla pulled back precisely into the 380 area, lining up with the 0.5 Fibonacci retracement and the daily trendline, and bounced, confirming 360–380 as a key buy zone. This region combines the prior breakout range, trendline support and fresh accumulation. The next critical step for bulls is a clean breakout and hold above 412 dollars - the main resistance of the recent corrective leg and the local cap for the last swing. A sustained move above 412 unlocks room toward 450 and then the major upside target near 530 within the broader ascending channel.
Company: Tesla is the global leader in EVs, battery systems and energy solutions, combining manufacturing, software, autonomous driving and large-scale storage infrastructure.
Fundamentally , as of November 16, Tesla is in a transition phase: auto margins are lower than during the previous peak cycle due to price cuts and stronger competition, yet volume growth, scaling of the energy segment and improved factory efficiency help to stabilize profitability. Cash flow remains strong, the balance sheet is solid, energy and services are taking a larger share of total revenue, and long-term expectations are anchored by FSD progress and the robotaxi roadmap. For the market, Tesla is still the flagship brand of the EV sector, and any signs of margin stabilization tend to bring institutional money back quickly.
Tactically , as long as price holds above 380 and doesn’t break below 360, the retest-before-continuation scenario remains the base case. A confirmed breakout above 412 becomes the technical trigger toward 450 and then the 530 target along the upper channel. A loss of 360 would shift the picture into a deeper correction, but the current structure still looks more like a pause within an uptrend than a top.
Tesla loves to scare everyone with sharp red candles, then casually act like it was just warming up for the next leg.

TSLA the rollercoaster continuesCould Burry be right?
AI bubble could burst and take other stonks down, we need a correction NASDAQ:TSLA is expensive....again 300 could be possible again. This is what a healthy correction could look like even if nothing happens with Open Ai/Nvidia/Ect...

TESLA: Bullish Continuation is Expected! Here is Why:
It is essential that we apply multitimeframe technical analysis and there is no better example of why that is the case than the current TESLA chart which, if analyzed properly, clearly points in the upward direction.
Disclosure: I am part of Trade Nation's Influencer program and receive a monthly fee for using their TradingView charts in my analysis.
❤️ Please, support our work with like & comment! ❤️
