Natural Gas Building Momentum for a New Impulsive RallyNatural Gas Building Momentum for a New Impulsive Rally
On the 4-hour timeframe, Natural Gas is forming large continuation patterns, signaling potential for another upward move.
An accumulation phase was observed in early September 2025, followed by another at the beginning of October. As we ente

Time for a correction.Natural gas prices have surged by 50% over the past month, even with storage levels at record highs. Increased exports to Europe and recent cold temperatures have contributed to rising prices. For the next two weeks, warmer-than-usual temperatures are anticipated, which may lead to a price correctio
NATURAL GAS(XNGUSD) | Final Wave 2 Flush Before Mega Wave 3⚡ NATURAL GAS – The Final Flush Before the Supercycle ⚡
After topping out in 2005 , Natural Gas has spent nearly two decades inside a massive corrective structure — slowly grinding lower, retracing, and shaking out every long-term bull in sight.
What we’re seeing now could be the final leg o

Hear Me OutNatty’s October Pump – What’s Next?
Natural Gas ripped higher through October, right in line with seasonal tendencies. Historically, November tends to cool off as hedging activity stabilizes heading into winter—and early price action suggests that pattern is holding.
Weather Outlook
Late Novem

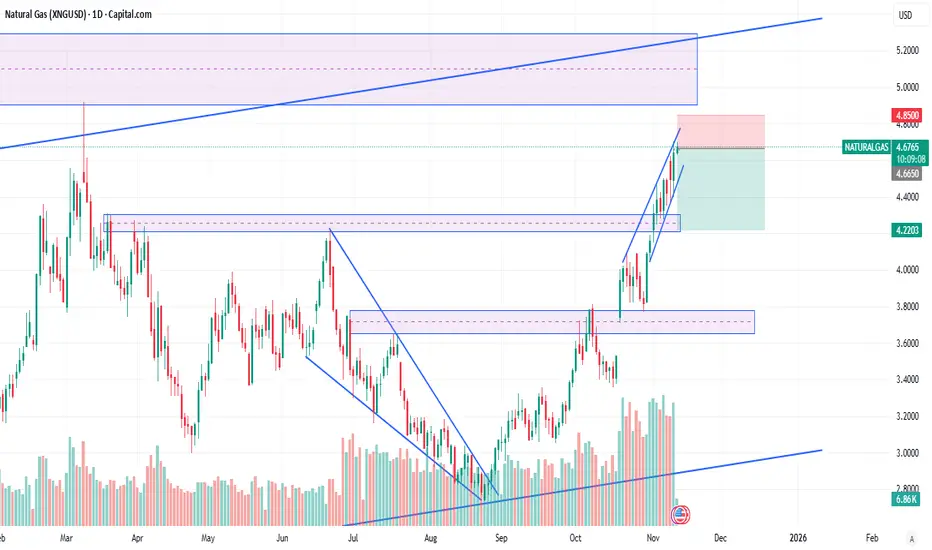
Natgas - at trendline resistanceNatgas - is at trendline resistance
While momentum is strong, some pullback is overdue.
Sell With SL at 4.45

Natural Gas - Golden CrossWhen this signal occurs you better no how to trade it.
The golden cross has now occured on the daily chart.
This is the 50MA intersecting with the daily 200 MA.
This is a medium to long term bullish signal that suggests nat gas over $5.
In the very short term traders often take profits and g


Natural Gas - Bullish Long Term SignalNatural Gas rallied on inventories today.
Inventory report came in better than expected. 33B build vs 34B estimate.
Natural Gas is on the precipous of squeezing to $5.40
A golden cross is set to occur in the next few sessions....When the 50MA and the 200 MA crossover occurs it likely means the

Cup and Handle Breakout On Natural GasNatural Gas price formed a smooth rounded base, a classic cup pattern.
Then, the breakout came with a strong bullish candle, confirming momentum has shifted fully in favor of the bulls.
After this breakout, we can expect a brief pullback.
As long as price holds above the breakout zone, the structu

Is This the Start of the Next Natural Gas Upswing?💨 Natural Gas (XNG/USD) — “Profit Pathway Setup” 🎯 Swing / Day Trade Edition
📊 Market Overview:
The Energies Market is heating up — and Natural Gas is showing its next potential boom move! After a confirmed Moving Average Breakout, bulls are sneaking back in. 🕵️♂️
This setup blends discipline + cr

See all ideas
Displays a symbol's price movements over previous years to identify recurring trends.