#JPM - Aug 2025Date: 16-08-2025
JPM - Current Price: 291.46
Pivot Point: 291 Support: 286 Resistance: 297
Upside Targets:
--------------------------------
| Target | Price |
---------------------------------
| 🎯 Target 1 | 303 |
| 🎯 Target 2 | 308 |
| 🎯 Target 3
JPMorgan Chase & Co. Shs -CAD hedged- Canadian Depositary Receipt Repr Shs Reg S
No trades
Key facts today
27.26 CAD
79.63 B CAD
386.08 B CAD
About JP Morgan Chase & Co.
Sector
Industry
CEO
James Dimon
Website
Headquarters
New York
Founded
1799
ISIN
CA46653U1066
FIGI
BBG013V21T17
JPMorgan Chase & Co is a financial holding company. It provides financial and investment banking services. The firm offers a range of investment banking products and services in all capital markets, including advising on corporate strategy and structure, capital raising in equity and debt markets, risk management, market making in cash securities and derivative instruments, and brokerage and research. It operates through the following segments: Consumer and Community Banking, Corporate and Investment Bank, Commercial Banking, and Asset and Wealth Management. The Consumer and Community Banking segment serves consumers and businesses through personal service at bank branches and through automated teller machine, online, mobile, and telephone banking. The Corporate and Investment Bank segment offers a suite of investment banking, market-making, prime brokerage, and treasury and securities products and services to a global client base of corporations, investors, financial institutions, government and municipal entities. The Commercial Banking segment delivers services to U.S. and its multinational clients, including corporations, municipalities, financial institutions, and non profit entities. It also provides financing to real estate investors and owners as well as financial solutions, including lending, treasury services, investment banking, and asset management. The Asset and Wealth Management segment provides asset and wealth management services. The company was founded in 1968 and is headquartered in New York, NY.
Related stocks

JPM LongJPM is now net long on the regression break.
I am going to take this trade with a EA with limited risk.

JPMorgan Chase (NYSE) (W) - Quiet Base, Bullish BiasPrice / Momentum : Weekly close $296.24 (+1.98%) — holding just above the prior breakout area. Market structure = higher highs / higher lows since the spring low.
Volume : Weekly volume has eased after the earlier surge (no fresh big-volume breakout). That shows consolidation/rotation rather than

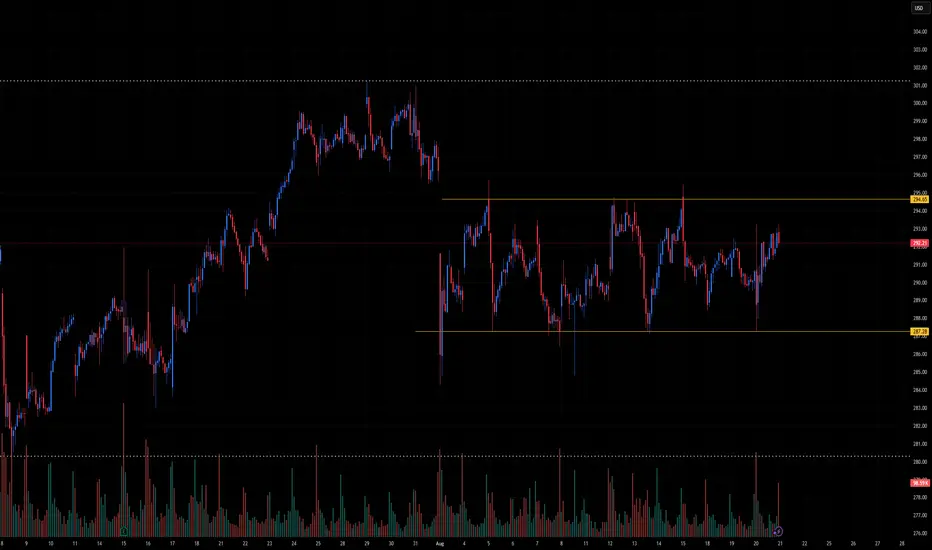
JPM Technical Outlook – Range-Bound Between Support & Resistance🏦 JPM Technical Outlook – Range-Bound Between Support & Resistance
Ticker: JPM (JPMorgan Chase & Co.)
Timeframe: 30-minute candles
🔍 Current Setup
JPM has been trading inside a horizontal range for several weeks, with price repeatedly rejecting both resistance and support.
Range Resistance: ~295
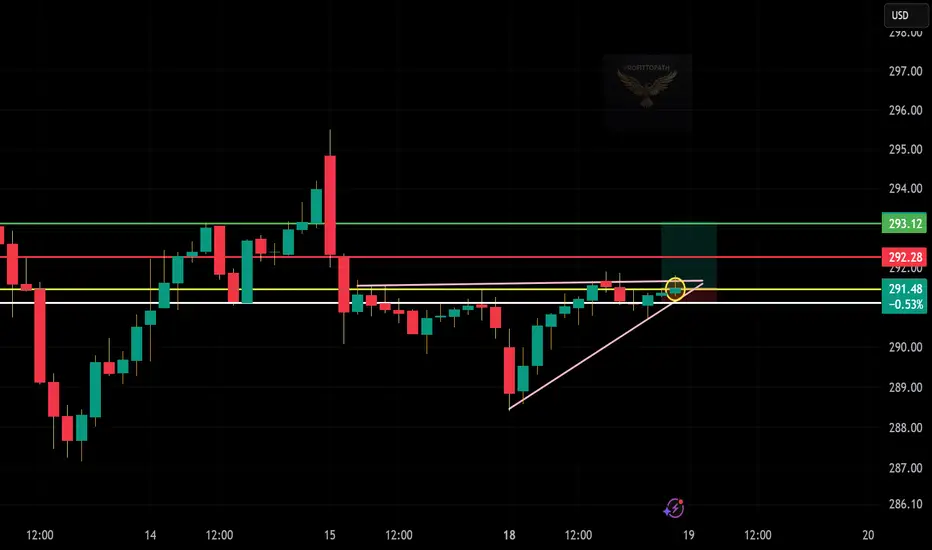
JPM Technical Outlook (30m Chart)📈
🔹 Current Price: $291.48
📉 Support Zone: $291.00 – $291.50
📊 Resistance Levels:
🔺 $292.28 (key breakout)
🎯 $293.12 (target)
📝 Trade Setup
✅ Entry: Near $291.50 (breakout)
🛑 Stop-loss: Below $291.00
🎯 Target: $293.12
⚖️ Risk/Reward: ~1:2 (strong setup)
🔎 Takeaway
🟢 Bullish bias above tr
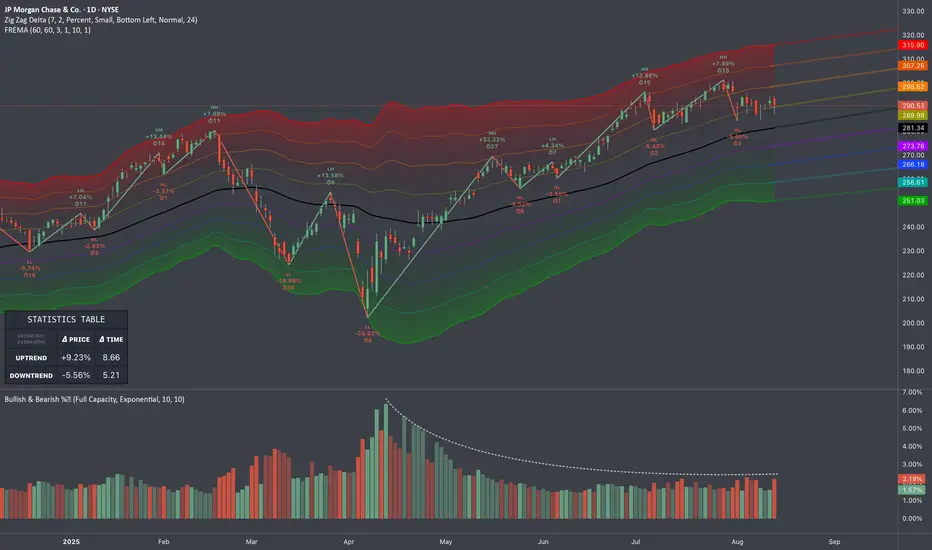
JPM: Mean Reversion (FREMA)🏛️ Research Notes
Already looks mature to me
Conditional averaging of percentage change shows weakening bullish momentum
Testing FREMA as an indicator for mean reversion, where I will look for deviations from the average and anticipate a price movement back towards that mean. The band
JPM + $500B Capital Forecast + Banks to Profit from Tar NYSE:JPM , 4H chart
ALVO13 Insight: A strong mix of technical structure and positive fundamentals.Technical Setup (Elliott Waves):
The chart suggests a potential start of wave (5) after a completed correction (4).
Stochastic is in the oversold zone, and $280 support is holding — a key signal for

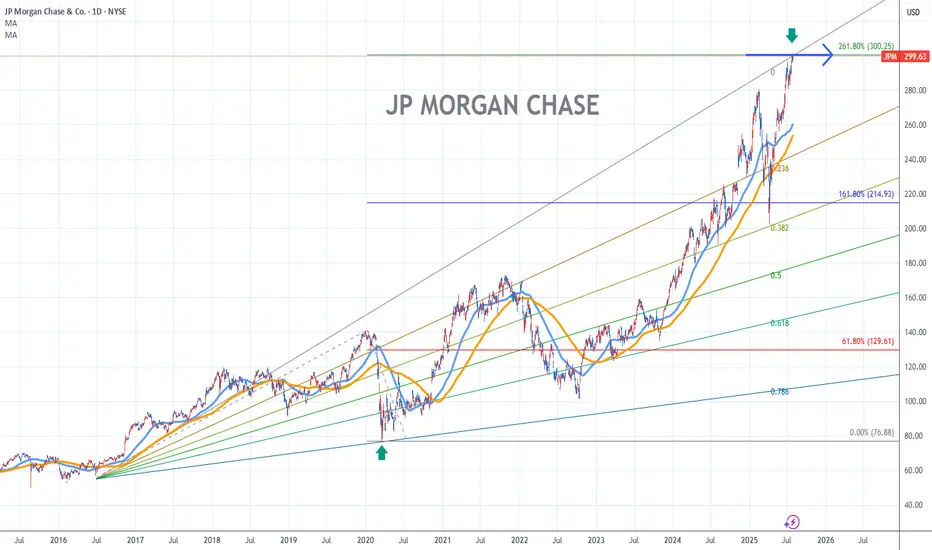
JP Morgan Chase Stock Chart Fibonacci Analysis 073025Trading Idea
Hit the 300/261.80% resistance level.
Chart time frame:D
A) 15 min(1W-3M)
B) 1 hr(3M-6M)
C) 4 hr(6M-1year)
D) 1 day(1-3years)
Stock progress:E
A) Keep rising over 61.80% resistance
B) 61.80% resistance
C) 61.80% support
D) Hit the bottom
E) Hit the top
Stocks rise as they rise fro

$JPM Tradespoon – Long Entry $296.36Tradespoon model generated long signal for NYSE:JPM . Predicted range: $296.36–$298.79. Trend: +0.10%. NYSE:JPM

See all ideas
Summarizing what the indicators are suggesting.
Oscillators
Neutral
SellBuy
Strong sellStrong buy
Strong sellSellNeutralBuyStrong buy
Oscillators
Neutral
SellBuy
Strong sellStrong buy
Strong sellSellNeutralBuyStrong buy
Summary
Neutral
SellBuy
Strong sellStrong buy
Strong sellSellNeutralBuyStrong buy
Summary
Neutral
SellBuy
Strong sellStrong buy
Strong sellSellNeutralBuyStrong buy
Summary
Neutral
SellBuy
Strong sellStrong buy
Strong sellSellNeutralBuyStrong buy
Moving Averages
Neutral
SellBuy
Strong sellStrong buy
Strong sellSellNeutralBuyStrong buy
Moving Averages
Neutral
SellBuy
Strong sellStrong buy
Strong sellSellNeutralBuyStrong buy
Displays a symbol's price movements over previous years to identify recurring trends.
J
JPM5152122
JPMorgan Chase Financial Co. LLC 0.0% 24-MAR-2026Yield to maturity
—
Maturity date
Mar 24, 2026
J
JPM5946157
JPMorgan Chase Financial Co. LLC 4.5036% 02-JAN-2026Yield to maturity
—
Maturity date
Jan 2, 2026
See all JPM bonds


