NIFTY MONTHLY VIEW — TIME & PRICE ANALYSIS NIFTY MONTHLY OUTLOOK — TIME & PRICE ANALYSIS (HIGH CONVICTION)
Best Risk–Reward Buy-on-Dips Phase Till Jan 2026
Nifty is entering a major monthly Time & Price accumulation phase, where trend structure, cycle timing, and risk–reward alignment are favoring buyers over sellers.
This is not a short-
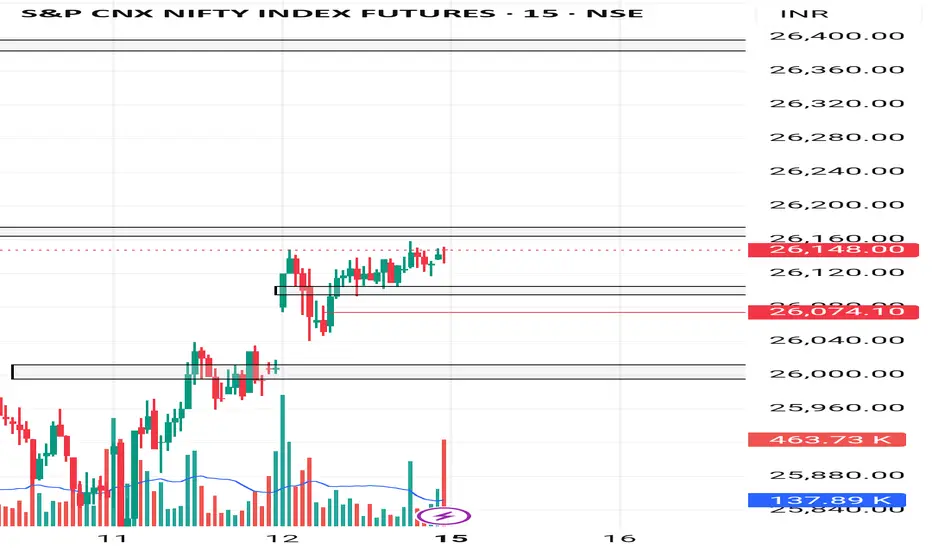
S&P CNX NIFTY INDEX FUTURES
No trades
Related futures

NIFTY INTRADAY VIEW — TIME & PRICE ANALYSISNIFTY INTRADAY VIEW — TIME & PRICE ANALYSIS
Buy on Dips | Intraday Window Active till 3:20 PM
Nifty is moving into an important Time & Price reaction zone.
The structure remains constructive as long as price respects the key line in the sand.
CMP: 25,975
Target 1: 26,040
Target 2: 26,130
Laxman Re

NIFTY INTRADAY — TIME & PRICE ANALYSIS (ACTIVE)NIFTY INTRADAY — TIME & PRICE ANALYSIS (ACTIVE)
Intraday Buy-on-Dips | Window Open till 14:25
This is an intraday Time & Price setup where structure is doing the heavy lifting.
Dips are being absorbed, momentum is stabilizing, and the time window is still active.
Intraday Levels (educational view)

NiftyNifty levels are based on volume profile
1. Gapup 26050 long
2. 26050-26010 trade breakout
3. Gapdown 26010 short


GIFTNIFTY IntraSwing Levels For 19th Dec '25💥Level Interpretation / description:
L#1: If the candle crossed & stays above the “Buy Gen”, it is treated / considered as Bullish bias.
L#2: Possibility / Probability of REVERSAL near RLB#1 & UBTgt
L#3: If the candle stays above “Sell Gen” but below “Buy Gen”, it is treated / considered as Side

Nifty Nifty levels are based on volume profile
1. Gapup 26200 long
2. 26200-26170 trade breakout
3. Gapdown 26170 short

Nifty Nifty levels are based on volume profile
1. Gapup 26000 long
2. 26000-25800 trade reversal
3. Gapdown 25800 short


Nifty Nifty levels are based on volume profile
1. Gapup 26175 long
2. 26175-26100 trade breakout
3. Gapdown 26100 short
See all ideas
Summarizing what the indicators are suggesting.
Neutral
SellBuy
Strong sellStrong buy
Strong sellSellNeutralBuyStrong buy
Neutral
SellBuy
Strong sellStrong buy
Strong sellSellNeutralBuyStrong buy
Neutral
SellBuy
Strong sellStrong buy
Strong sellSellNeutralBuyStrong buy
A representation of what an asset is worth today and what the market thinks it will be worth in the future.
Displays a symbol's price movements over previous years to identify recurring trends.
Frequently Asked Questions
The current price of S&P CNX NIFTY INDEX FUTURES is 26,206.90 INR — it has risen 0.65% in the past 24 hours. Watch S&P CNX NIFTY INDEX FUTURES price in more detail on the chart.
The volume of S&P CNX NIFTY INDEX FUTURES is 3.08 M. Track more important stats on the S&P CNX NIFTY INDEX FUTURES chart.
Open interest is the number of contracts held by traders in active positions — they're not closed or expired. For S&P CNX NIFTY INDEX FUTURES this number is 14.46 M. You can use it to track a prevailing market trend and adjust your own strategy: declining open interest for S&P CNX NIFTY INDEX FUTURES shows that traders are closing their positions, which means a weakening trend.
Buying or selling futures contracts depends on many factors: season, underlying commodity, your own trading strategy. So mostly it's up to you, but if you look for some certain calculations to take into account, you can study technical analysis for S&P CNX NIFTY INDEX FUTURES. Today its technical rating is buy, but remember that market conditions change all the time, so it's always crucial to do your own research. See more of S&P CNX NIFTY INDEX FUTURES technicals for a more comprehensive analysis.