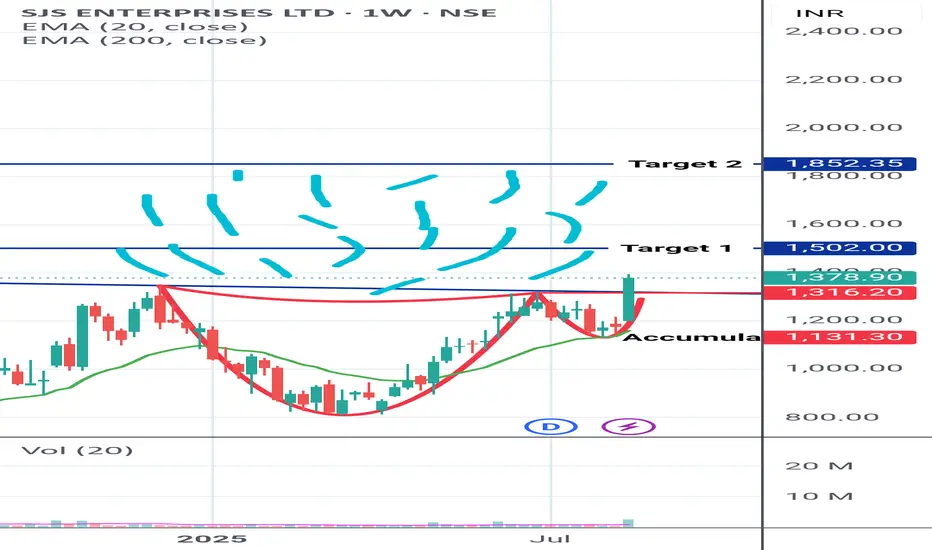
SJS ENTERPRISES VERY HOTSJS ENTERPRISES
Presents you a Hot Beautiful Cup of Coffee for tasting.
Those who wish to Enjoy the Taste can pay and start tasting it
Note Levels mentioned in chart itself. Kindly go through it
S.J.S. Enterprises Limited
No trades
Next report date
—
Report period
—
EPS estimate
—
Revenue estimate
—
49.50 INR
1.18 B INR
7.60 B INR
24.27 M
About S.J.S. Enterprises Limited
Sector
Industry
CEO
Sanjay Thapar
Website
Headquarters
Bangalore
Founded
1987
IPO date
Nov 15, 2021
Identifiers
2
ISIN INE284S01014
S.J.S Enterprises Ltd. engages in the manufacture and sale of self-adhesive labels. Its products include domes, 3D Lux, overlays, decals and body graphics, 2D appliques, formed appliques, aluminum badges, optical plastics, IML and IMD, aftermarket and transform, chrome plated parts, capacitive overlays, and AZ. The company was founded by S. Sivakumar, Kannampadathil Abraham Joseph and V. Srinivasan on June 10, 1987 and is headquartered in Bangalore, India.
Related stocks
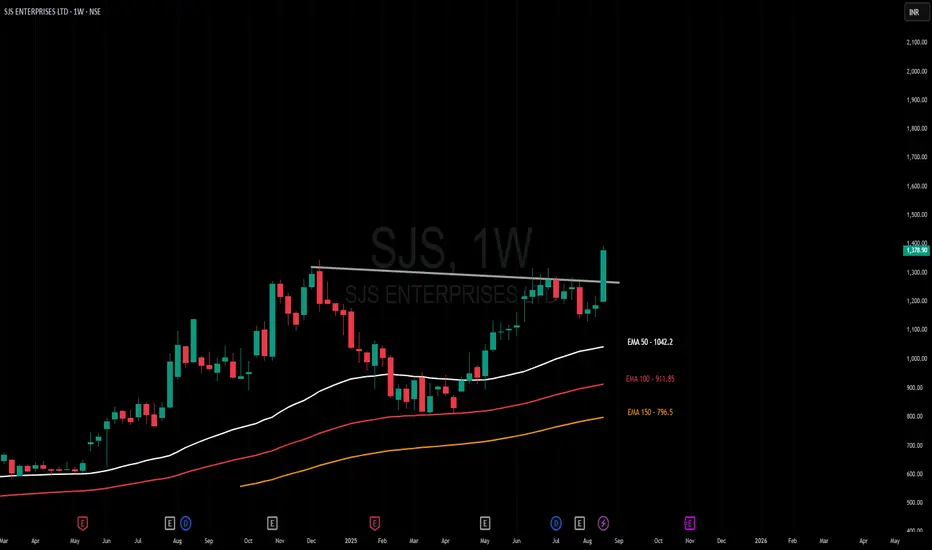
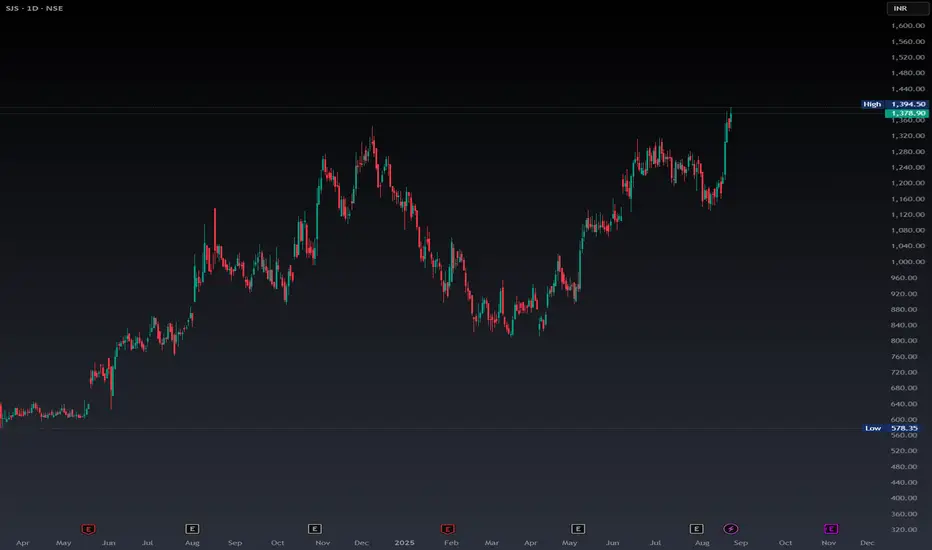
Amazing breakout on WEEKLY Timeframe - SJSCheckout an amazing breakout happened in the stock in Weekly timeframe, macroscopically seen in Daily timeframe. Having a great favor that the stock might be bullish expecting a staggering returns of minimum 25% TGT. IMPORTANT BREAKOUT LEVELS ARE ALWAYS RESPECTED!
NOTE for learners: Place the break
SJS - A breakout stockA good breakout stock, keep an eye.
RSI looks strong and closed above previous ATH.
High Volume can be seen as well
SJS Enterprises LTD Bullish CUP and Handle SJS Enterprises has formed a perfect Cup and Handle pattern and broke the resistance with good volume.

SJS1. Anything can happen.
2. You don't need to know what is going to happen next in order to make money.
3. There is a random distribution between wins and losses for any given set of variables that define an edge. No other thoughts
4. An edge is nothing more than an indication of a higher probability

SJS ENTERPRISES LTDThis stock breakout and retest there respective level
and this analysis for educational purpose only

SJS Enterprises#EarningsGapUp
Stock consolidating after it gapped up post the results.
Will look to go long above 725. Ideally would want it to breakout after 2 days.

SJS Fib trade set up1. Trend: Bullish to sideays
2. Set up: Reversal
3. RR: 1:5 to all the way to 10R
4. Stop loss: 2 SL can be followed, aggressive with 4.3%
or easy room to avoid volatility.

SJSAfter taking support at all time high. and 20 &200 MA are also supporting on daily time frame.
u can think for buy on some retracement sl will be 550 target will be 1:3.

Some targets For investors Hi @JainArpan
Just A support and some targets Nothing for me to study.
All the best.
Gratify if you appreciate the practice then you can like it, share it and
If you want me to investigate any chart for you then would cherish doing that for you.
Thank you for your time and support.
Stay safe.

See all ideas
Summarizing what the indicators are suggesting.
Neutral
SellBuy
Strong sellStrong buy
Strong sellSellNeutralBuyStrong buy
Neutral
SellBuy
Strong sellStrong buy
Strong sellSellNeutralBuyStrong buy
Neutral
SellBuy
Strong sellStrong buy
Strong sellSellNeutralBuyStrong buy
An aggregate view of professional's ratings.
Neutral
SellBuy
Strong sellStrong buy
Strong sellSellNeutralBuyStrong buy
Neutral
SellBuy
Strong sellStrong buy
Strong sellSellNeutralBuyStrong buy
Neutral
SellBuy
Strong sellStrong buy
Strong sellSellNeutralBuyStrong buy
Displays a symbol's price movements over previous years to identify recurring trends.
Frequently Asked Questions
The current price of SJS is 1,903.50 INR — it has increased by 3.37% in the past 24 hours. Watch S.J.S. Enterprises Limited stock price performance more closely on the chart.
Depending on the exchange, the stock ticker may vary. For instance, on NSE exchange S.J.S. Enterprises Limited stocks are traded under the ticker SJS.
SJS stock has risen by 5.69% compared to the previous week, the month change is a 10.81% rise, over the last year S.J.S. Enterprises Limited has showed a 103.58% increase.
We've gathered analysts' opinions on S.J.S. Enterprises Limited future price: according to them, SJS price has a max estimate of 2,635.00 INR and a min estimate of 1,846.00 INR. Watch SJS chart and read a more detailed S.J.S. Enterprises Limited stock forecast: see what analysts think of S.J.S. Enterprises Limited and suggest that you do with its stocks.
SJS stock is 8.72% volatile and has beta coefficient of 1.64. Track S.J.S. Enterprises Limited stock price on the chart and check out the list of the most volatile stocks — is S.J.S. Enterprises Limited there?
Today S.J.S. Enterprises Limited has the market capitalization of 59.19 B, it has increased by 4.30% over the last week.
Yes, you can track S.J.S. Enterprises Limited financials in yearly and quarterly reports right on TradingView.
S.J.S. Enterprises Limited is going to release the next earnings report on May 27, 2026. Keep track of upcoming events with our Earnings Calendar.
SJS net income for the last quarter is 446.11 M INR, while the quarter before that showed 430.34 M INR of net income which accounts for 3.66% change. Track more S.J.S. Enterprises Limited financial stats to get the full picture.
Yes, SJS dividends are paid annually. The last dividend per share was 2.50 INR. As of today, Dividend Yield (TTM)% is 0.14%. Tracking S.J.S. Enterprises Limited dividends might help you take more informed decisions.
S.J.S. Enterprises Limited dividend yield was 0.28% in 2024, and payout ratio reached 6.61%. The year before the numbers were 0.33% and 7.29% correspondingly. See high-dividend stocks and find more opportunities for your portfolio.
As of Feb 12, 2026, the company has 507 employees. See our rating of the largest employees — is S.J.S. Enterprises Limited on this list?
EBITDA measures a company's operating performance, its growth signifies an improvement in the efficiency of a company. S.J.S. Enterprises Limited EBITDA is 2.47 B INR, and current EBITDA margin is 25.84%. See more stats in S.J.S. Enterprises Limited financial statements.
Like other stocks, SJS shares are traded on stock exchanges, e.g. Nasdaq, Nyse, Euronext, and the easiest way to buy them is through an online stock broker. To do this, you need to open an account and follow a broker's procedures, then start trading. You can trade S.J.S. Enterprises Limited stock right from TradingView charts — choose your broker and connect to your account.
Investing in stocks requires a comprehensive research: you should carefully study all the available data, e.g. company's financials, related news, and its technical analysis. So S.J.S. Enterprises Limited technincal analysis shows the strong buy rating today, and its 1 week rating is strong buy. Since market conditions are prone to changes, it's worth looking a bit further into the future — according to the 1 month rating S.J.S. Enterprises Limited stock shows the strong buy signal. See more of S.J.S. Enterprises Limited technicals for a more comprehensive analysis.
If you're still not sure, try looking for inspiration in our curated watchlists.
If you're still not sure, try looking for inspiration in our curated watchlists.