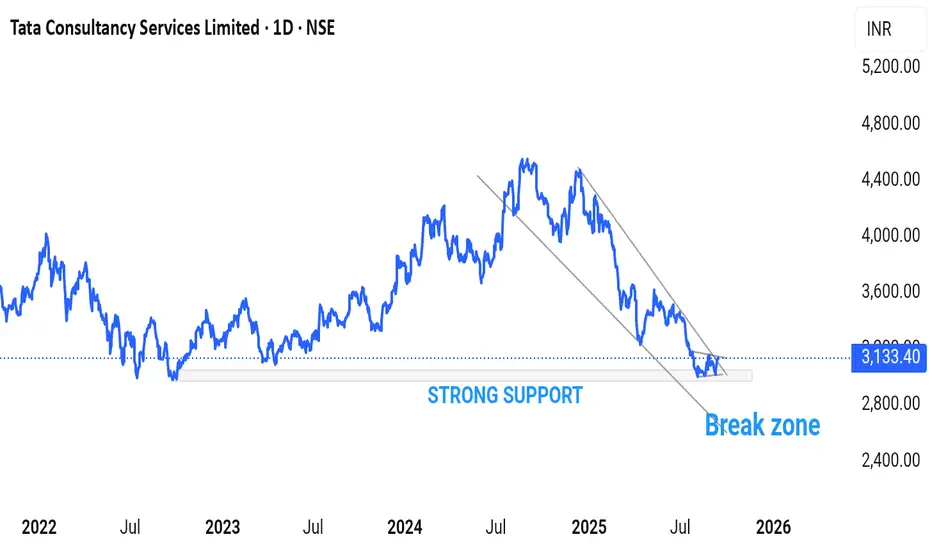
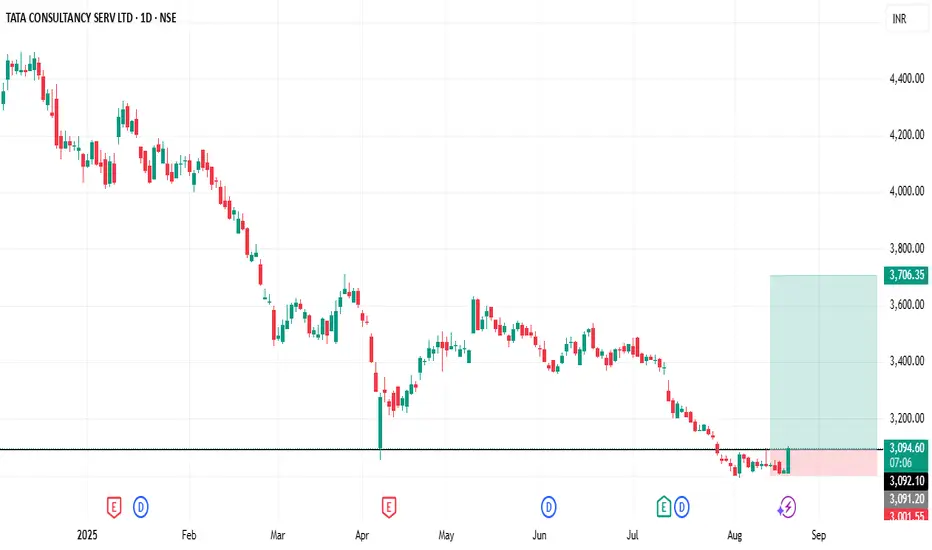
Tcs - Poised for a Steady UpmoveAfter a long correction phase , TCS seems to be resting around its primary support zone , validation which , will move towards retesting it's All time Highs.
One must also keep in mind about the current macro factors in picture before taking a position in this. Trade with SL :)
Trade ideas

TCS Hourly Trend AnalysisAs per technical study and price patterns and timing methods, I expect TCS to take a strong bull move towards the resistance of 3273. Increasing volume supports this bull trend till November 17, 2025.
There may be a possibility of profit booking post Nov 17.
This is my personal view based on my analysis. Traders are suggested to conduct own technical studies for entries and exits with proper risk management.

TCS - Forecasting the Rain- Probality of HappeningTCS idea will become invalid if it makes higher high before March 2026. That more bullish scenario.

TCS 60 MINS TIME FRAME MY VIEW The Structure looks good to us, waiting for this instrument to correct and then give us these opportunities as shown on this instrument (Price Chart).
Note: Its my view only and its for educational purpose only. Only who has got knowledge about this strategy, will understand what to be done on this setup. its purely based on my technical analysis only (strategies). we don't focus on the short term moves, we look for only for Bullish or Bearish Impulsive moves on the setups after a good price action is formed as per the strategy. we never get into corrective moves. because it will test our patience and also it will be a bullish or a bearish trap. and try trade the big moves.
We do not get into bullish or bearish traps. We anticipate and get into only big bullish or bearish moves (Impulsive Moves). Just ride the Bullish or Bearish Impulsive Move. Learn & Know the Complete Market Cycle.
Buy Low and Sell High Concept. Buy at Cheaper Price and Sell at Expensive Price.
Please keep your comments useful & respectful.
Keep it simple, keep it Unique.
Thanks for your support
Tradelikemee Academy
Saanjayy K G

Yeh chart kuch kheta hai !
Chart Pattern Analysis
The visible pattern suggests a descending triangle or falling wedge formation:
Upper red trendline: Strong descending resistance from earlier highs near ₹3,800–3,900.
Lower blue trendlines: Multiple horizontal supports between ₹2,850 and ₹2,950.
The price is currently consolidating near ₹3,060—just below a resistance zone.
A falling wedge typically signals a potential bullish reversal, provided it breaks upward with strong volume.
🔍 Support & Resistance Levels
Resistance zones:
₹3,095 – ₹3,190: Near-term resistance (sellers active here).
₹3,400: Major resistance and potential breakout confirmation.
Support zones:
₹2,946: Immediate support.
₹2,853: Strong demand zone.
₹2,686: Critical long-term support (if broken, trend turns bearish again).
📈 Momentum & Structure
Short-term trend: Sideways consolidation after a strong decline
Candlestick behavior: Price forming higher lows—early sign of buying interest returning.
Outlook (Next 2 Months)
Scenario 1: Bullish Breakout (Higher Probability)
If price closes above ₹3,190 with volume, expect a rally toward ₹3,400–₹3,500.
Targets:
T1: ₹3,190
T2: ₹3,400
T3: ₹3,500
Stop-loss: ₹2,910 (below immediate support).
Scenario 2: Breakdown Below ₹2,850 (Bearish Continuation)
Price may slide to ₹2,700–₹2,680.
Avoid fresh longs if this level breaks decisively.
⚙️ Trading Plan (Short-Term Positioning)
Entry: Wait for breakout above ₹3,100–₹3,150 with strong candle close.
Stop-loss: ₹2,9410.
Target range: ₹3,400–₹3,500.
Risk/Reward: ~1:2.5 (favorable setup).
Time horizon: 4–8 weeks.
💬 Summary
Pattern: Falling wedge → Bullish bias.
Trend: Short-term neutral to bullish if breakout occurs.
Key level to watch: ₹3,190.
Strategy: Buy on breakout confirmation; accumulate on dips above ₹2,940.
Disclaimer : I am not sebi registered please consult your investment adviser before making any investment decision this post is only for education purpose

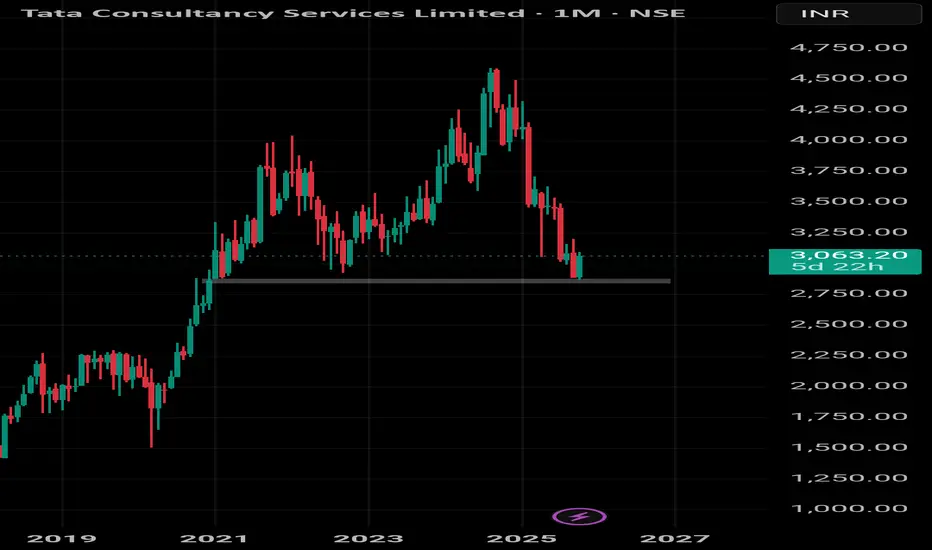
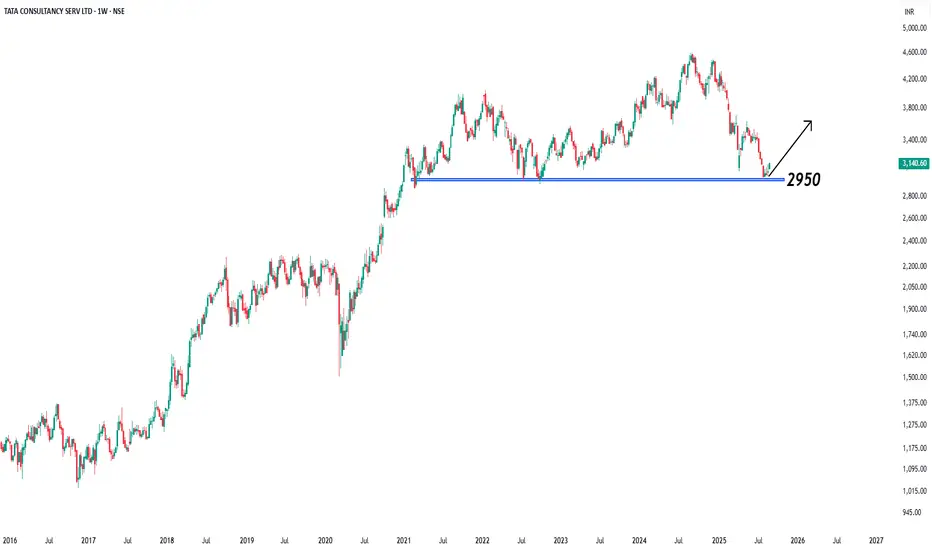
TCS bullish ??Tcs setting at it's monthly previous support zone. There would be a high probability that it can bounce from this level.
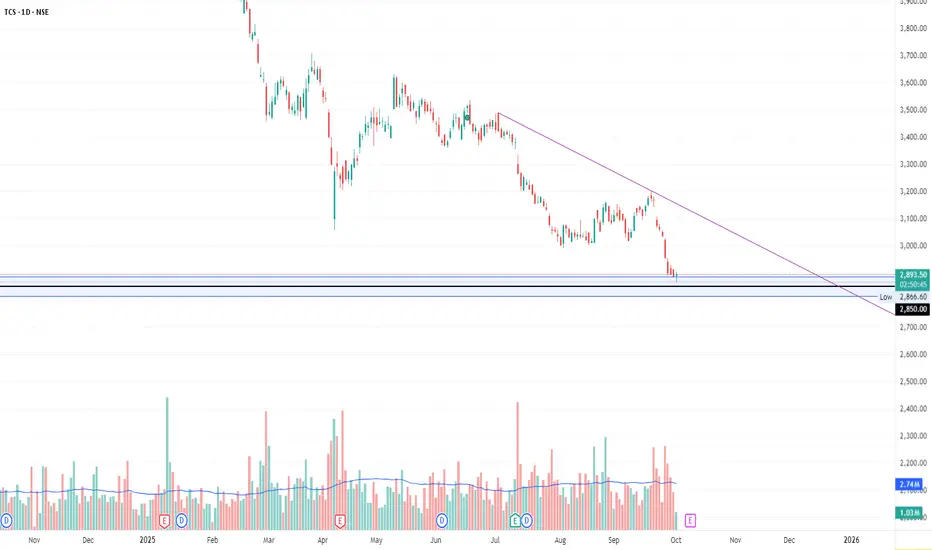
TCS - H1 - Triangle Breakout (19.10.2025)📊 Setup Overview:
TCS is showing a Triangle Breakout formation on the H1 chart. Price has been consolidating within converging trendlines, and a cloud crossover hints at a possible momentum shift. This setup could lead to a directional breakout opportunity for short-term traders.
📈 Trade Plan:
Bias: Bearish below the breakout zone
Sell Entry Zone: Below 2950 (after candle close confirmation)
1st Target: 2877 ✅
2nd Target: 2814 🎯
Resistance Zone: 3010 – 3030
🧩 Technical Confluence:
1.Price rejected from upper trendline multiple times
2.Ichimoku Cloud crossover signals short-term weakness
3.Lower highs formation confirms loss of bullish momentum
4.Volume profile shows high interest near 2900, indicating potential liquidity zone
#TCS #NSE #StockMarketIndia #TechnicalAnalysis #TriangleBreakout #Ichimoku #PriceAction #SwingTrading #StocksToWatch #IndianStocks #Nifty50 #TradingView #ChartsDontLie #Kabhi_Ta_Trading #BearishSetup
💡 Fundamental View:
TCS, India’s leading IT services giant, remains fundamentally strong with consistent revenue from global clients and robust digital transformation projects.
However, recent IT sector consolidation and global tech budget tightening could create short-term selling pressure. The stock’s medium-term outlook remains positive, but near-term corrections may occur before a fresh rally.
⚠️ Disclaimer:
This analysis is for educational and informational purposes only and should not be considered as financial advice. Always use proper risk management and confirm setups with your own analysis before trading or investing.
💬 Support the Analysis:
If this chart helped you — LIKE 👍, COMMENT 💬 your views, and FOLLOW ✅ for daily market insights, chart patterns, and trade setups!

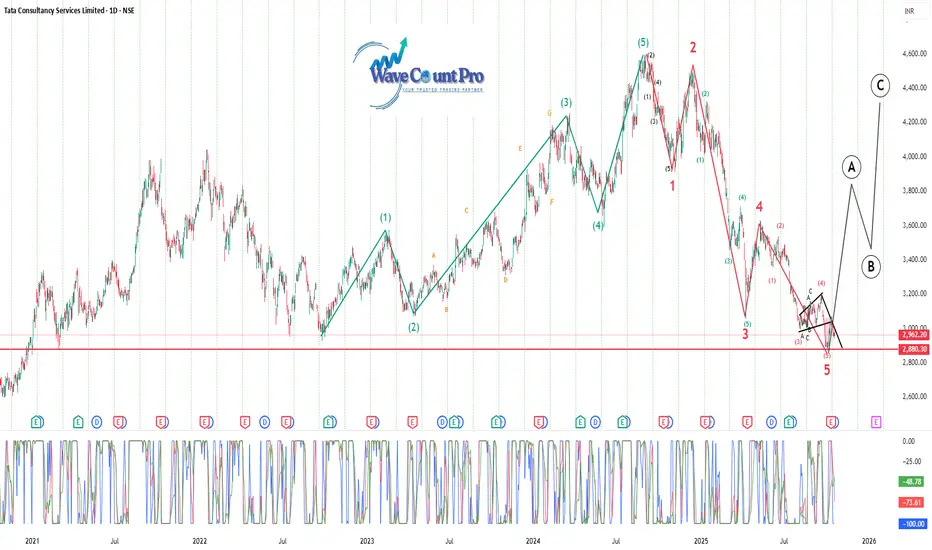
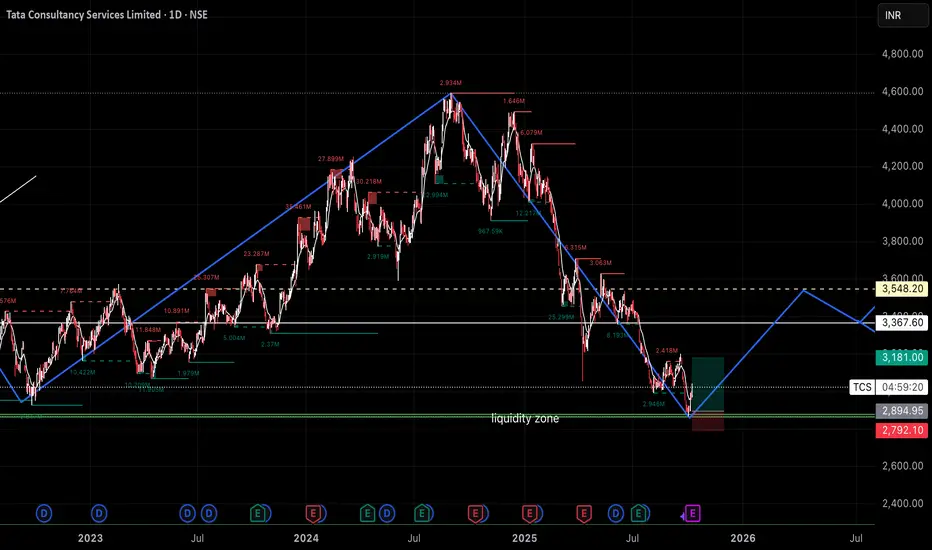
TCS Trend Reversal ??🔹 Wave Structure Overview
The chart clearly maps a complete 5-wave impulse uptrend (green count) followed by a 5-wave corrective decline (red count).
The current position indicates that Wave 5 of the corrective phase has just completed — signaling a possible end of the downtrend and setup for a bullish reversal.
🔹 Key Observations
Support Zone:
Strong horizontal support lies between ₹2,880–₹2,950, previously tested multiple times since 2021.
Price is currently hovering at this zone, showing signs of consolidation and potential reversal.
Wave Count Analysis:
The correction from the top (~₹4,600) unfolded in a clear 5-wave structure (1–2–3–4–5).
Subwave (5) appears to have terminated near the major support — a typical ending point for an Elliott Wave correction.
Pattern Recognition:
A falling wedge structure can be observed near the Wave 5 termination, which often precedes a bullish breakout.
The oscillator at the bottom also indicates oversold levels, reinforcing the likelihood of a rebound.
🔹 Projected Path (Next Phase)
The chart projects a corrective rally (A–B–C) following the completed 5-wave decline:
Wave A: Initial sharp rebound possibly toward ₹3,600–₹3,700.
Wave B: Pullback to retest lower supports near ₹3,200–₹3,300.
Wave C: Final leg up toward ₹4,200–₹4,400 range.
This A–B–C pattern would represent a corrective recovery phase before the next larger structure develops.
🔹 Sentiment & Outlook
Aspect View
Current Trend Bearish cycle likely completed
Immediate Bias Bullish rebound expected
Support Zone ₹2,880–₹2,950
Upside Targets ₹3,700 (A), ₹4,400 (C)
Invalidation Level Breakdown below ₹2,880
Momentum Oversold, positive divergence forming
🔹 Conclusion
TCS appears to have completed a major correction and is positioned for a medium-term trend reversal.
Holding above ₹2,880 will confirm strength, potentially leading to an A–B–C recovery toward ₹4,400 levels.
Momentum indicators and wave structure both support the beginning of a bullish phase after a prolonged decline.
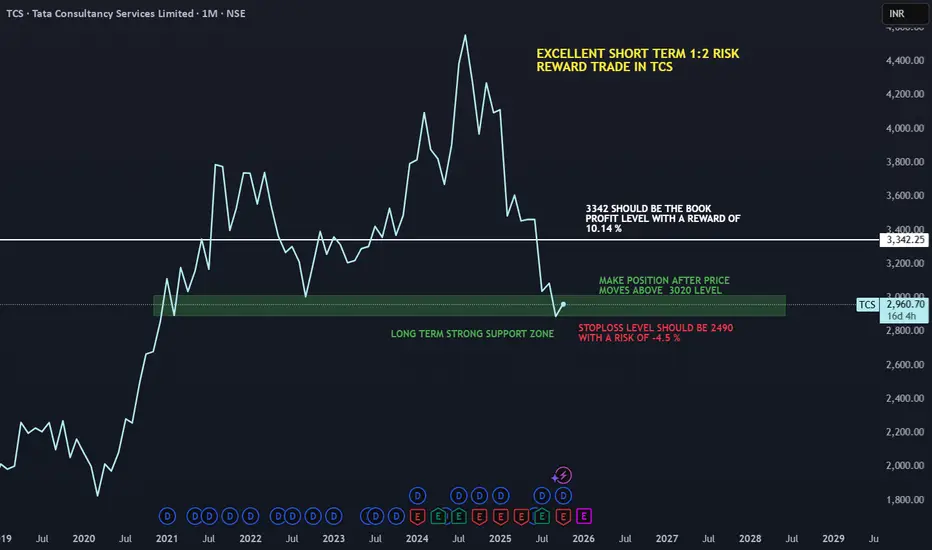
TCS - SHORT TERM 1:2 RISK TO REWARD TRADE IDEA. This is a excellent buying at the bottom with very little risk and a 1:2 risk to reward short term trade in TCS.
TCS REVERSAL SIGHTCS can be add here for Short TO Long term purpose.
SL CLOSING BELOW BLACK LINE 2850.
Dream Price For TCS ? One of India’s top IT giants – TCS – has corrected almost 40% from highs 📉. For a large cap, consistent dividend-paying & profitable company, that’s huge!
Right now, it’s sitting at a strong support zone (₹2700–2900) … Risk looks defined with SL ~2349 & Reward potential almost 2x 📊.
✨ A quality stock at dream levels? Worth keeping on radar!
⚠️ Educational Purpose Only | Markets are risky – do your own research before investing

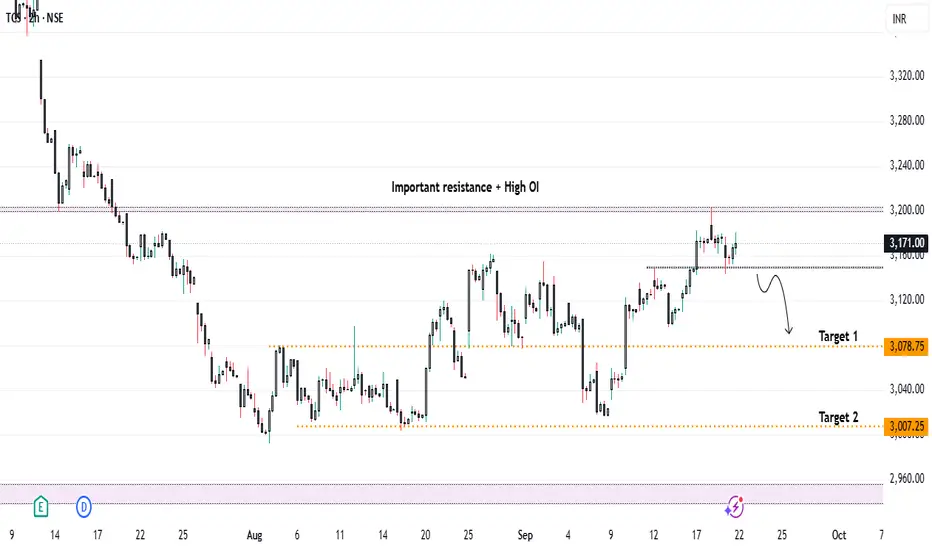
TCS Under Pressure – Will Visa Heat Trigger ₹3000 Levels..?Currently, TCS is trading near the crucial resistance zone of ₹3200, which also carries high open interest. From a technical perspective, if the stock breaks and closes below the short-term support of ₹3150, we can look for a short entry on retest, with targets:
* 🎯 Target 1: ₹3080
* 🎯 Target 2: ₹3000
📰 Fundamental / News Catalyst
The recent US H-1B visa policy update imposing a $100,000 fee on new petitions triggered a knee-jerk reaction in IT stocks:
* U.S.-listed Indian IT firms saw an immediate 2-5% decline.
* Analysts expect the impact on TCS to be limited, since a large part of its U.S. workforce is locally hired and renewals/existing visas are exempt.
* Worst-case estimates suggest a 3-5% downside in the short term, but not a structural collapse for large, diversified players like TCS.
📊 Impact Outlook on TCS
Short Term (days–weeks):
* Investor sentiment may turn negative, causing selling pressure.
* Margin compression possible due to new visa costs.
* Analysts could revise earnings growth expectations lower.
* Offsetting factors: Renewals exempt, TCS has a solid U.S. local workforce, and offshore flexibility.
Medium Term (months):
* New contracts may factor in higher costs.
* Shift to offshore delivery could reduce higher-margin onsite revenues.
* More local U.S. hiring may raise costs.
* Offsetting factors: TCS’s scale allows cost absorption; some costs may be passed to clients.
Long Term (year+):
* Delivery model may shift further to offshore/local U.S. hiring.
* Competitive pressure if peers adapt faster in the U.S. market.
* Margins could be under pressure.
*Offsetting factors: Strong global brand, diversified business, investments in AI & automation can offset long-term risks.
🔎 Scenarios for Share Price
* Mild Reaction: 3-5% decline → cautious investors, limited disruption.
* Moderate Reaction: 8-12% decline → project delays, client pushback, stricter visa rules.
* Severe Reaction: 15-20%+ decline → contract losses, earnings downgrades, tighter U.S. policy.
✅ Conclusion
* 📌 Technicals: Watch ₹3150 for breakdown confirmation; short entries possible below this with ₹3080 / ₹3000 as downside targets.
* 📌 Fundamentals: News-driven weakness is likely, but structural risk to TCS remains limited vs smaller IT peers.
* 📌 Strategy: Short-term bearish setup aligns with both technical chart structure and negative sentiment from visa policy changes.
📌 Sentiment: Bearish (Short Term)
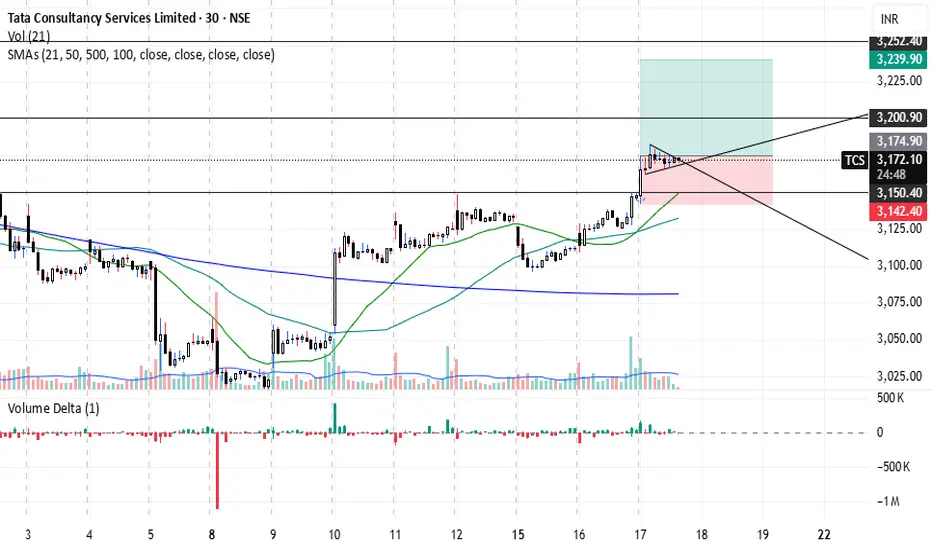
Bullish 21,50 corss over in tcs Bullish 21,50 corss over in tcs 30 min time frame. May go upside up to 3240-3300 in coming sessions
#TCS Looks one more push lower is possibleNSE:TCS Looks intresting sugessting one more push lower to complete wave 5 in red of wave (4) in blue, we dont recommend buying this stock now. Any rally can be sold only.

10% and more in TCS in upcoming days ?Tcs sitting around it's monthly support. It might give us 10% and more in a few days...

BULLISH SIGNAL ON TCSPrices comes at near Previous level of support.It indicates started rising upwards for the long term holding.
Let's wait periods....
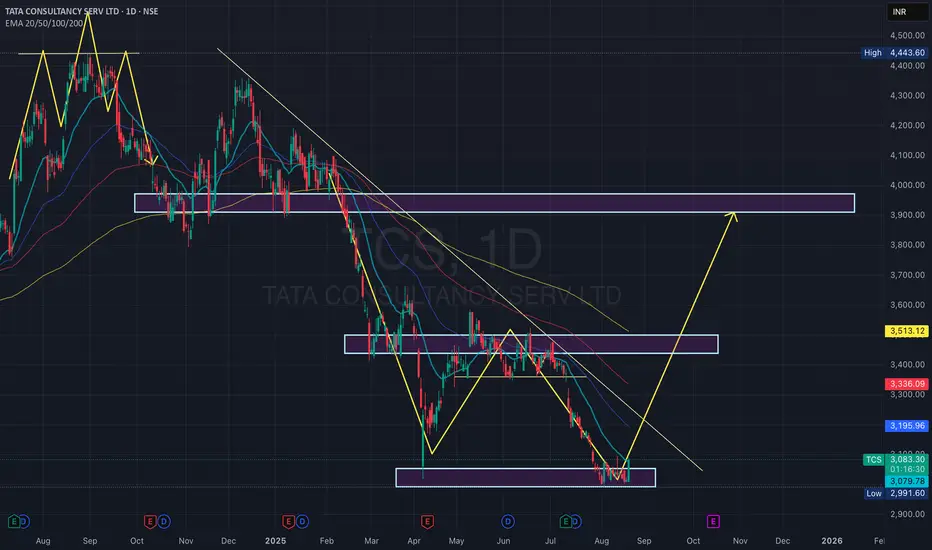
TATA CONSULTANCY SERVICES LTD S/RSupport and Resistance Levels:
Support Levels: These are price points (green line/shade) where a downward trend may be halted due to a concentration of buying interest. Imagine them as a safety net where buyers step in, preventing further decline.
Resistance Levels: Conversely, resistance levels (red line/shade) are where upward trends might stall due to increased selling interest. They act like a ceiling where sellers come in to push prices down.
Breakouts:
Bullish Breakout: When the price moves above resistance, it often indicates strong buying interest and the potential for a continued uptrend. Traders may view this as a signal to buy or hold.
Bearish Breakout: When the price falls below support, it can signal strong selling interest and the potential for a continued downtrend. Traders might see this as a cue to sell or avoid buying.
MA Ribbon (EMA 20, EMA 50, EMA 100, EMA 200) :
Above EMA: If the stock price is above the EMA, it suggests a potential uptrend or bullish momentum.
Below EMA: If the stock price is below the EMA, it indicates a potential downtrend or bearish momentum.
Trendline: A trendline is a straight line drawn on a chart to represent the general direction of a data point set.
Uptrend Line: Drawn by connecting the lows in an upward trend. Indicates that the price is moving higher over time. Acts as a support level, where prices tend to bounce upward.
Downtrend Line: Drawn by connecting the highs in a downward trend. Indicates that the price is moving lower over time. It acts as a resistance level, where prices tend to drop.
Disclaimer:
I am not SEBI registered. The information provided here is for learning purposes only and should not be interpreted as financial advice. Consider the broader market context and consult with a qualified financial advisor before making investment decisions.

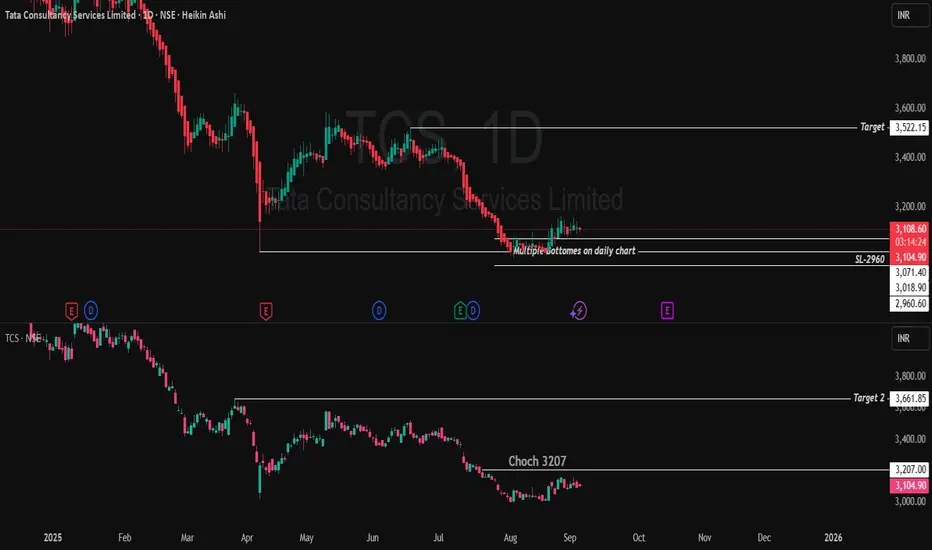
Buy Projection: TCS Daily (Heikin Ashi, Doji Signal)Trading Idea
Entry: On retracement or sustain above 3114, ideally scale in near 3070–3114 if retest occurs.
Trigger Level: Add or pyramid position above 3207 for further momentum.
Target Zones: 3295 (initial), 3661 (extended)
Key Point to be keep in mind before trade:
Doji candle after long bearish trend signals potential reversal
18-day consolidation between 3070–3015 formed a strong base
Breakout occurred above 3072 in last 6 days, confirming momentum shift
Current price around 3114 supports bullish trend continuation
Near-term change of character (CHoCH) expected at 3207; clears key resistance
Targets after CHoCH: 3295 (first), then 3661 (extended)
Suggested entry: buy on dips near 3070–3114 or on breakout above 3207
Stop loss: below 3070 to manage risk
Heikin Ashi Doji after bearish trend and consolidation, followed by breakout at 3072 and price holding above 3114, validates bullish momentum for targets at 3295 and 3661 if 3207 is cleared with volume.Based on the Heikin Ashi daily chart for TCS, with a doji after a long bearish trend and consolidation between 3070–3015 for the last 18 days, a breakout above 3072 seen in the previous six days, and current price at 3114:
Entry: Consider buying on dips above the 3072 breakout or if price sustains above 3114, confirming momentum after the doji and consolidation.
First Trigger: Watch for price action near 3207 (marked CHoCH); clearing this adds conviction to the uptrend.
Targets: Initial target at 3295, with a higher target at 3661 as shown for extended bullish move.
Stop-loss: Below the consolidation low at 3015, or more tightly just under 3070 depending on risk appetite.
This projection aligns with typical Heikin Ashi reversal logic, highlighting developing bullish strength if key resistance levels are cleared and maintained.
Disclaimer: lnkd.in
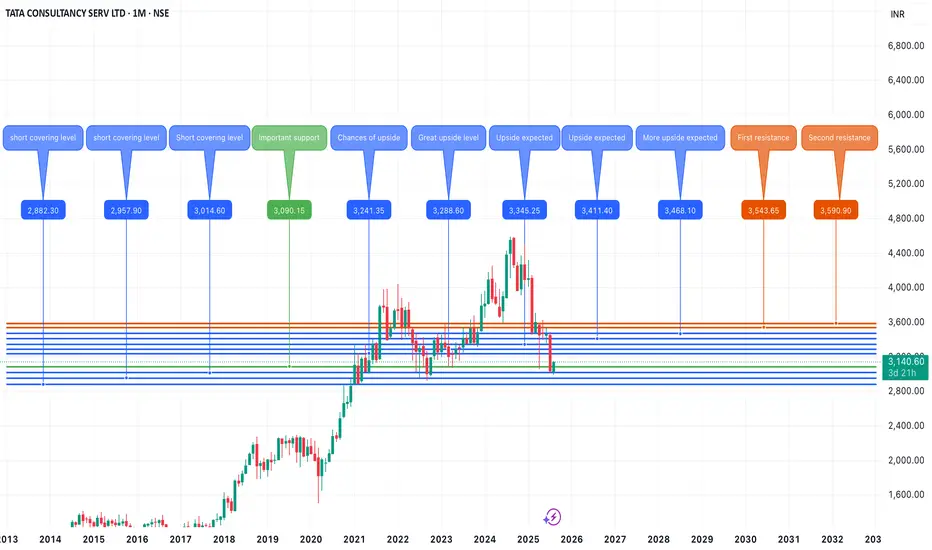
TCS SHORT-TERM ANALYSISTCS seems to have made a low for short term. The max downside risk is limited upto 8%, which would be 2882 from the current market price of 3140. But the recent bounce from 3000 levels is giving hope for further upside momentum, and this momentum will get stronger once TCS crosses and sustains above 3288. Upon that, we can expect highs upto 3540-3590. And if it breaches the recent support of 3000, then the downside risk upto 2882 will open .
THIS IS MY PERSONAL VIEW AND NOT A BUY/SELL RECOMMENDATION.
TCS Swing Trade Setup📊 Price Action & Trend Analysis
Analyzing market trends using price action, key support/resistance levels, and candlestick patterns to identify high-probability trade setups.
Always follow the trend and manage risk wisely!
Price Action Analysis Interprets Market Movements Using Patterns And Trends On Price Charts.
👉👉👉Follow us for Live Market Views/Trades/Analysis/News Updates.
TCS - Positional - LongTCS in heavy oversold zone. Double bottom and support at level of 3000. Far away from 200 EMA on D timeframe. Bounce back will push its price till 3500 as first level where it will face resistance again. Consolidation around 3500 will push again till 4300+. Buy entry for positional long.