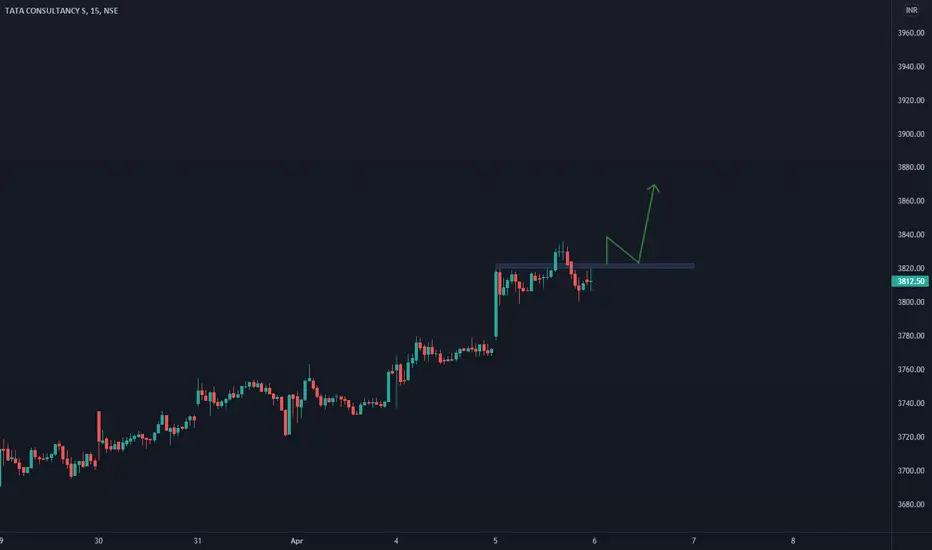
TCS buy for intraday tradingTCS buy for intraday trading if stock and IT sector also strong then we will enter in stock..........
TCS trade ideas
TCS IndiaSun Storm Investment Trading Desk & NexGen Wealth Management Service Present's: SSITD & NexGen Portfolio of the Week Series
Focus: Worldwide
By Sun Storm Investment Research & NexGen Wealth Management Service
A Profit & Solutions Strategy & Research
Trading | Investment | Stocks | ETF | Mutual Funds | Crypto | Bonds | Options | Dividend | Futures |
USA | Canada | UK | Germany | France | Italy | Rest of Europe | Mexico | India
Disclaimer: Sun Storm Investment and NexGen are not registered financial advisors, so please do your own research before trading & investing anything. This is information is for only research purposes not for actual trading & investing decision.
#debadipb #profitsolutions


SMA & EMA 50,100,200,300Exponential Moving Average (EMA) & Simple Moving Average (SMA)
50 DAYS
100 DAYS
200 DAYS
300 DAYS

TCS Following FibonacciTata Consultancy Services moves in a channel upwards, then retraces, exactly to 78.6% basis Fibonacci.
If TCS makes a recent top, you can get short opportunity all the way down to 78.6% irrespective of what NIFTY IT does.
Wait for the top, and breakdown from channel before entering trade. Keep trailing stop loss after every day.


TCS heading toward upward journeyTCS has took strong support on near 3385 level and also given a trendline breakout. As RSI also indicating strong upside and crossed 34 DMA. Upside can be seen in upcoming sessions and reach its resistance level.

TCS TRENDLINE RESISTANCETCS trend-line which earlier was a support for the stock is now acting as a resistance with 2 open= high at the trend-line in last few days.


TCS to move higher?TCS has crossed above the long term trendline. If it closes above 3665-3670 levels, we can expect it to move higher

TCS Good Zones For #Bottomfishing Best Buy Zone: 2889 - 3398
Good Buy Zone: 3398 - CMP
Add on bounce, not while it is falling.
Long Term Portfolio Stock.
Tracking Quantity can be taken at CMP. (Tracking Quantity : Suppose you want to Invest Rs.X in a particular stock. The amount between Rs.X/5 or Rs.X/10 would be tracking quantity) (‘Tracking Quantity’ of a stock in your portfolio will help you keep a track of the stock if it is coming in the indicated buying zones.)(Sometimes Out of sight goes out of mind so buying tracking quantity of stocks that you want to add in future helps.)

TATA CONSULTENCY TCSTCS taking support in daily time frame its a good time to buy , entry point above 200 moving average think as a investor

TCS TCS broke a major trend line and rebounded after touching a major support line. If it moves above the trend line we can expect it to reach the recent highs. If it breaks down below the support line it is expected to lose another Rs100-200.

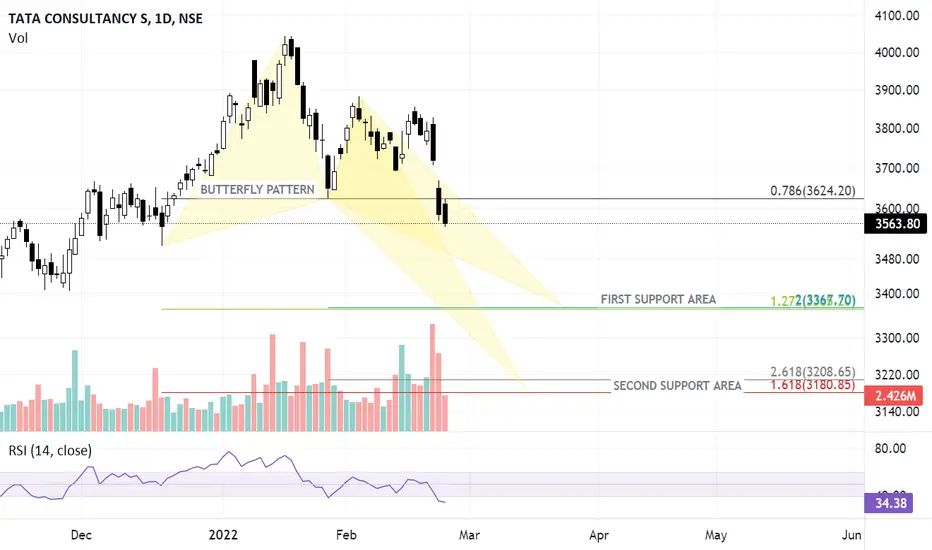
TCS HARMONIC LEVELS FOR POSITIONAL TRADINGTCS is currently in a correction mode, and it is likely that we may see further weakness in the stock, and stock could move lower to 3400 to 3200 levels in the near term.
This is a great stock for Investment and for positional trading also.
I can see butterfly pattern formation on its daily chart, which is suggesting a good support area around 3400 -3367 levels and at 3180-3208
Stock can be bought in tranches as both of these levels can be seen in the stocks.
Disclaimer: Not a recommendation to trade.
TCS 1DTCS currently at the bottom of a crucial zone. It can give a good move either side.
If it breaks down expected target can be around 3100.
If reverses from this zone one can expect a target of 4050+
Trade safe. Manage risk. Be profitable.
Please follow us for more simple trading analysis and setups. Also let me know in the comment in case you have any queries.
Disclaimer :- This is just my view. Please analyze charts yourself and then decide to take any trades.

TCS a good buy near 3715Buy TCS near 3715 and now at 3735. Wait for it to retrace so that you can buy at the advised level. Hold for a min target of Rs.100

TCS: Hide or Ride !!Folks!!
Looks like we are about to complete the third Elliott wave in this chart.
I see strong newsflow overpowering traders.
So TCS can retest all time high again which could support Nifty.
All the Best!!


TCS buyback strategyForming a triangle pattern.... looking like it is ready to give a blast with buyback as the trigger.... Can apply for buyback when it comes and sell remaining at market price.... break even point of buyback should be around 3.2k assuming 60% acceptance rate.... 3.3k is a very good support region, so no need to worry about loss at all

TCS Triangle formationPossible triangle breakout, the direction is not clear as of now also there is a consolidations of moving averages . Putting an alert on both the trendlines.

TCS is in a Important Breakout Point, Buy/Sell after BreakoutTCS Intraday Strategy for 10/02/2022
TCS is in a Important Breakout Point, Buy/Sell after Breakout

TCS LongTCS has been a fundamentally good stock which ultimately is good to hold for a long time. However, The recent budget has also been focused on IT which is an added advantage for IT Sector.
At present, the chart shows Cup and handle pattern which will fetch 10% and above on breakout. I'm holding TCS for quite a while now and looking forward to investing more.
