Long TCS waiting for breakout triangular pattern Dear Traders
TCS is on the verge of triangular pattern break out
Regards
Shyam Kumar
9304057478
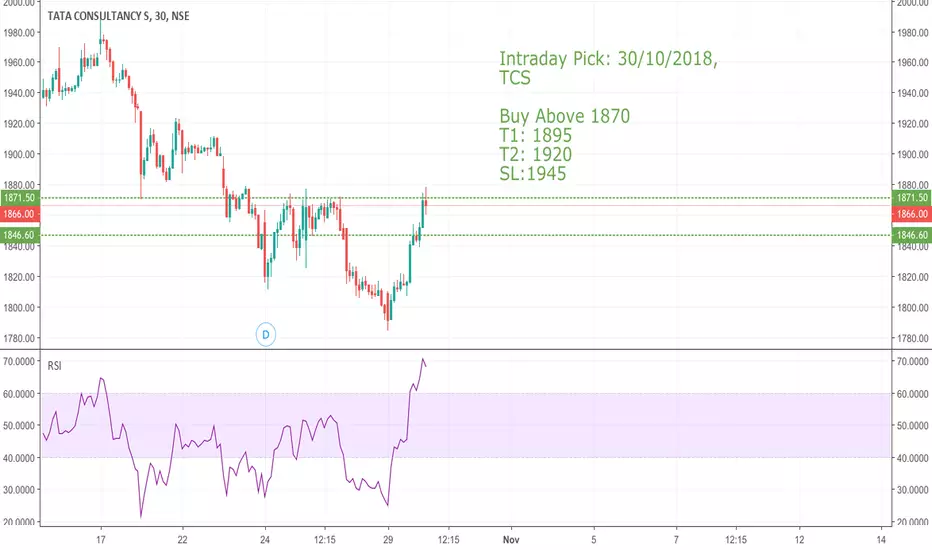
TCS trade ideas


Expiry Strategy: Sell Jan 2040 Call @ 16EMA crossover and MACD confirms that trend is continue to be under bears control.
Expect this expiry would be below 2040 level.


What's next in TCS Technical analysis?Target from HNS is complete, now retracement is pending.
Retracement level is mentioned by fibonacci retracement tool

TCS time to go short??Trade idea is only relavent , if price drops below 2009
T1:1991
T2:1966
T3:1957
T4:1935


TCS looks weak. A short swing opportunity.At CMP TCS is overvalued. The weekly structure looks weak and shows a failed double bottom structure at 38.2% Fib level. This is indicative of a fall in TCS prices. Target is the 61.8% Fib level which also coincides with the weekly trend line. This is the major support level from which TCS may resume an uptrend post 31st March 2019


short TCS if breaks 1907 , first target 1898, second target 188short TCS if breaks 1907 , first target 1898, second target 1889

Sell TCSTCS has broken a range without meeting its double bottom target. The stock broke the range downwards with rising volume. TCS has support at 1800-levels which it may test and can form a triple bottom. Sell TCS for a target of 1800 with a S/L of 1951.

TCS : Short term and medium term forecast.. As per my wave analysis.. we are in correction for more further UP later on..
If and when it comes to 1950 levels, please look for buy positions on proper reversal signs and on BO confirmation, only buy this for 2050+ levels..
Best of luck..
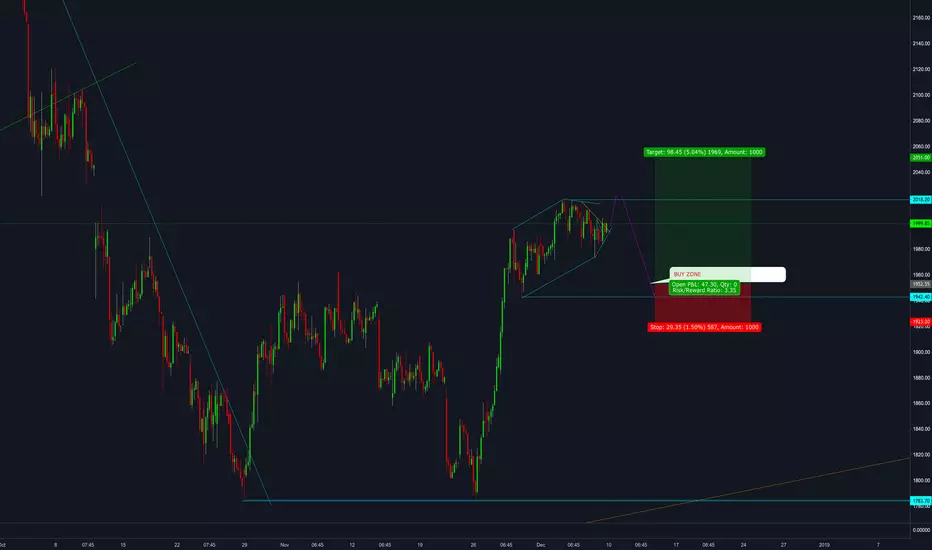
TCS - LONG ABOVE 2000CMP 1969
Long suggested above 2000
Stop at 1900
Target 2200 plus
Logic:
W pattern formation fuelled by price / pivot oscillator divergence.


TCS - Tech King with strong fundamentals.TCS - Strong Fundamentals.
Following trend closely to USA markets.
Potential signs of sell off in US markets.
US markets showing cat-bounces but still think big players can sell off due to uncertainty.
Lower Bollinger band on daily timeframe can be a buy opportunity for TCS.
Price came back down touching the upper Band ( upper deviation).
Bollinger bands are very useful in knowing trends and I use them for entry and exit .


TATA CONSULTANCY SERVICES SHARE HOLDERS SHOULD KNOW THIS!the chart is self explanatory
i know many Indians with family and kids are holding their life savings in this stock
please read this and see the obvious bear in the room
DISCLAIMER - i don't have any TCS shares..... so hopefully this analysis is emotionally uncompromising


