NIFTYNifty levels are based on imbalances
1. gapup 26150 long
2. 26150-26000 trade breakout
3. gapdown 26000 short
Trade ideas

NIFTYNifty levels are based on imbalances
1. gapup 26280 long
2. 26280-26200 trade breakout
3. gapdown 26200 short

NIFTYNifty levels are based on imbalances
1. gapup26080 long
2. 26080-25840 trade breakout
3. gapdown 25840 short

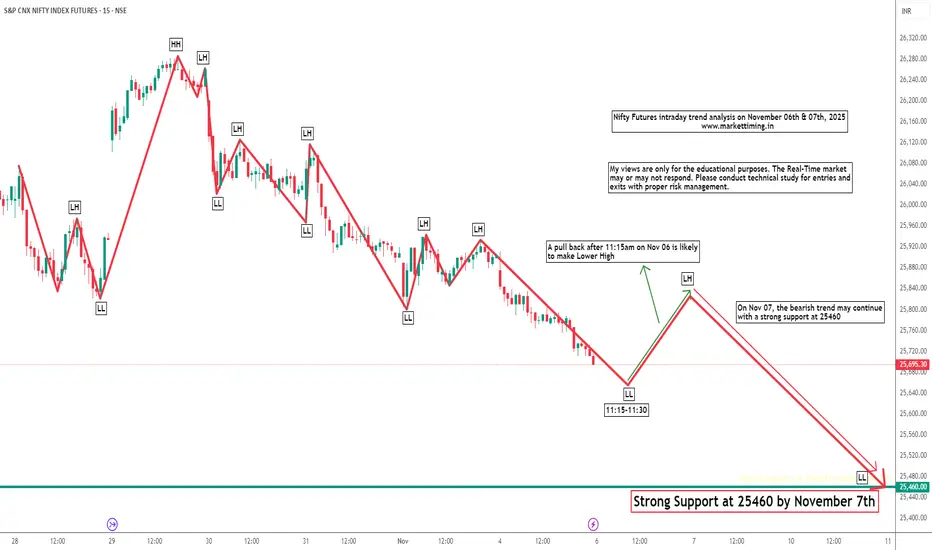
Nifty Futures Intraday Trend Analysis for November 6th and 7thBased on my pattern analysis, I anticipate the bearish momentum to persist until November 7th, potentially testing the support level around 25,460. However, on November 6th, a pullback after 11:15 AM is possible, which could result in a lower high formation.
Please note that this is my personal market outlook, and actual price action may vary due to potential gaps on either side. Traders are advised to perform their own technical analysis for entries and exits, while maintaining proper risk management practices.
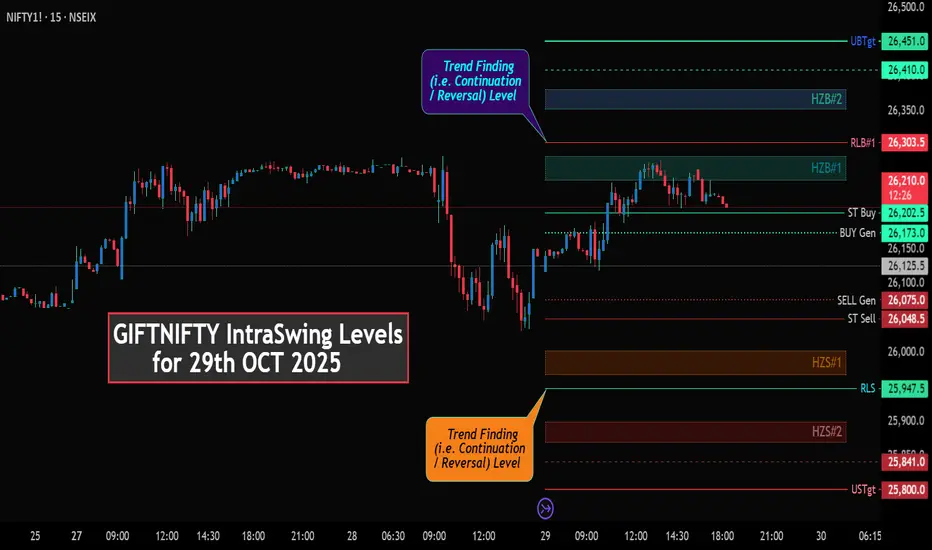
GIFTNIFTY IntraSwing Levels for 29th OCT 2025🌡️Plot Levels Using 3 Min, 5 Min Time frame in your Chart for Better Analysis
L#1: If the candle crossed & stays above the “Buy Gen”, it is treated / considered as Bullish bias.
L#2: Possibility / Probability of REVERSAL near RLB#1 & UBTgt
L#3: If the candle stays above “Sell Gen” but below “Buy Gen”, it is treated / considered as Sidewise. Aggressive Traders can take Long position near “Sell Gen” either retesting or crossed from Below & vice-versa i.e. can take Short position near “Buy Gen” either retesting or crossed downward from Above.
L#4: If the candle crossed & stays below the “Sell Gen”, it is treated / considered a Bearish bias.
L#5: Possibility / Probability of REVERSAL near RLS#1 & USTgt
HZB (Buy side) & HZS (Sell side) => Hurdle Zone,
*** Specialty of “HZB#1, HZB#2 HZS#1 & HZS#2” is Sidewise (behaviour in Nature)
Rest Plotted and Mentioned on Chart
Color code Used:
Green =. Positive bias.
Red =. Negative bias.
RED in Between Green means Trend Finder / Momentum Change
/ CYCLE Change and Vice Versa.
Notice One thing: HOW LEVELS are Working.
Use any Momentum Indicator / Oscillator or as you "USED to" to Take entry.
⚠️ DISCLAIMER:
The information, views, and ideas shared here are purely for educational and informational purposes only. They are not intended as investment advice or a recommendation to buy, sell, or hold any financial instruments. I am not a SEBI-registered financial adviser.
Trading and investing in the stock market involves risk, and you should do your own research and analysis. You are solely responsible for any decisions made based on this research.
"As HARD EARNED MONEY IS YOUR's, So DECISION SHOULD HAVE TO BE YOUR's".
Do comment if Helpful .
In depth Analysis will be added later (If time Permits)
NIFTYNifty levels are based on imbalances
1. gapup 26000 long
2. 26000-25880 trade breakout
3. gapdown 25880 short
NIFTYNifty levels are based on imbalances
1. gapup 25800 long
2. 25800-25600 trade reversal
3. gapdown 25600 short

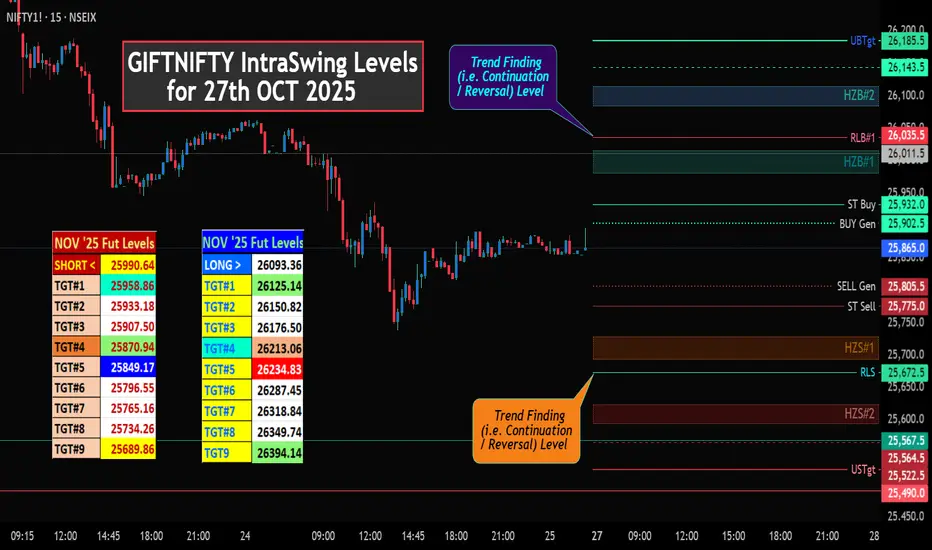
GIFTNIFTY IntraSwing Levels for 27th OCT 2025Majority Traders are not the participants to trade as Traded in Doller.
Publishing Chart to confirm trend of NiFTY as Roll over in Progress.
Max adjustable Premium 100 - 150 points.
If premium Drops below 80 point (without any Major NEWS / EVENT like Tariff WAR etc, Think about Long position & if Premium Increases & Crossed above 150+ points when Nifty Sidewise / Bearish Bias Think about Short position.
Remember one thing PREMIUM CALCULATED w.r.t NOVEMBER '25 (Near Exp Basis not Current Month
GIFTNIFTY November '25 Future Levels In BOX Format.
🚀 "WEEKLY Levels" mentioned in BOX format.
🌡️Plot Levels Using 3 Min, 5 Min Time frame in your Chart for Better Analysis
L#1: If the candle crossed & stays above the “Buy Gen”, it is treated / considered as Bullish bias.
L#2: Possibility / Probability of REVERSAL near RLB#1 & UBTgt
L#3: If the candle stays above “Sell Gen” but below “Buy Gen”, it is treated / considered as Sidewise. Aggressive Traders can take Long position near “Sell Gen” either retesting or crossed from Below & vice-versa i.e. can take Short position near “Buy Gen” either retesting or crossed downward from Above.
L#4: If the candle crossed & stays below the “Sell Gen”, it is treated / considered a Bearish bias.
L#5: Possibility / Probability of REVERSAL near RLS#1 & USTgt
HZB (Buy side) & HZS (Sell side) => Hurdle Zone,
*** Specialty of “HZB#1, HZB#2 HZS#1 & HZS#2” is Sidewise (behaviour in Nature)
Rest Plotted and Mentioned on Chart
Color code Used:
Green =. Positive bias.
Red =. Negative bias.
RED in Between Green means Trend Finder / Momentum Change
/ CYCLE Change and Vice Versa.
Notice One thing: HOW LEVELS are Working.
Use any Momentum Indicator / Oscillator or as you "USED to" to Take entry.
⚠️ DISCLAIMER:
The information, views, and ideas shared here are purely for educational and informational purposes only. They are not intended as investment advice or a recommendation to buy, sell, or hold any financial instruments. I am not a SEBI-registered financial adviser.
Trading and investing in the stock market involves risk, and you should do your own research and analysis. You are solely responsible for any decisions made based on this research.
"As HARD EARNED MONEY IS YOUR's, So DECISION SHOULD HAVE TO BE YOUR's".
Do comment if Helpful .
In depth Analysis will be added later (If time Permits)
NIFTYNifty levels are based on imbalances
1. gapup 26050 long
2. 26050-25900 trade breakout
3. gapdown 25900 short

GIFTNIFTY at a GLANCE.GIFTNIFTY Overview
GIFT Nifty is a derivatives index based on the Nifty 50 , traded on the NSE International Exchange (NSE IX) within Gujarat International Finance Tec-City (GIFT City ), India’s first International Financial Services Centre (IFSC). It serves as India’s international gateway for equity futures trading, providing foreign investors access to Indian markets with extended trading hours and flexibility.
What is GIFT Nifty
GIFT Nifty replaced SGX Nifty (which was traded on the Singapore Exchange) and began operations from July 3, 2023 . The transition aimed to bring offshore derivative trading back to India under a regulated domestic framework managed by the International Financial Services Centres Authority (IFSCA).
The index tracks the top 50 NSE-listed companies using a free-float market capitalization methodology, mirroring the Nifty 50. It is denominated and traded in US dollars, offering two trading sessions—
• Morning: 6:30 AM to 3:40 PM IST
• Night: 4:35 PM to 2:45 AM IST
This 21-hour structure aligns closely with global markets, improving accessibility for foreign investors.
Purpose and Function:
GIFT Nifty allows global investors to trade in Indian equities without exposure to local currency risk or registration with domestic regulators. It acts as:
• A hedging tool for institutions and large investors managing India-related portfolios.
• A predictive indicator for the Indian market’s opening direction, similar to how SGX Nifty once operated.
• A bridge for cross-border investment flows, contributing to India’s ambition of becoming a global financial hub through GIFT City.
Significance and Recent Performance
GIFT Nifty has rapidly gained volume and global traction. In May 2025, its monthly turnover reached USD 102.35 billion, marking record growth and signaling strong global confidence in India’s financial infrastructure. The platform offers tax incentives, seamless international fund transfer, and advanced trading technology to attract global funds to Indian assets.
Connection to GIFT City
GIFT City, located near Gandhinagar, Gujarat, houses India’s first IFSC and serves as the operational base for GIFT Nifty. The city hosts over 550 global financial entities, including major banks, fintechs, and exchanges. It integrates world-class infrastructure with tax-friendly regulations and aims to make India a major fintech and capital markets hub.
In essence, GIFT Nifty marks India’s evolution into an international financial powerhouse, offering liquidity, innovation, and global participation in India’s equity markets through a domestic but globally integrated platform.
🌡️Plot Levels Using 3 Min, 5 Min Time frame in your Chart for Better Analysis
L#1: If the candle crossed & stays above the “Buy Gen”, it is treated / considered as Bullish bias.
L#2: Possibility / Probability of REVERSAL near RLB#1 & UBTgt
L#3: If the candle stays above “Sell Gen” but below “Buy Gen”, it is treated / considered as Sidewise. Aggressive Traders can take Long position near “Sell Gen” either retesting or crossed from Below & vice-versa i.e. can take Short position near “Buy Gen” either retesting or crossed downward from Above.
L#4: If the candle crossed & stays below the “Sell Gen”, it is treated / considered a Bearish bias.
L#5: Possibility / Probability of REVERSAL near RLS#1 & USTgt
HZB (Buy side) & HZS (Sell side) => Hurdle Zone,
*** Specialty of “HZB#1, HZB#2 HZS#1 & HZS#2” is Sidewise (behaviour in Nature)
Rest Plotted and Mentioned on Chart
Color code Used:
Green =. Positive bias.
Red =. Negative bias.
RED in Between Green means Trend Finder / Momentum Change
/ CYCLE Change and Vice Versa.
Notice One thing: HOW LEVELS are Working.
Use any Momentum Indicator / Oscillator or as you "USED to" to Take entry.
⚠️ DISCLAIMER:
The information, views, and ideas shared here are purely for educational and informational purposes only. They are not intended as investment advice or a recommendation to buy, sell, or hold any financial instruments. I am not a SEBI-registered financial adviser.
Trading and investing in the stock market involves risk, and you should do your own research and analysis. You are solely responsible for any decisions made based on this research.
"As HARD EARNED MONEY IS YOUR's, So DECISION SHOULD HAVE TO BE YOUR's".
Do comment if Helpful .
In depth Analysis will be added later (If time Permits)

NIFTYNifty levels are based on imbalances
1. gapup 26160 long
2. 26160-25850 trade reversal
3. gapdown 25850 short

NIFTYNifty levels are b ased on imbalances
1. gapup 25920 long
2. 25920-25720 trade breakout
3. gapdown 25720 short
NIFTYNifty levels are based on imbalances
1. gapup 25950 long
2. 25950-25800 trade breakout
3. gapdown 25800 short

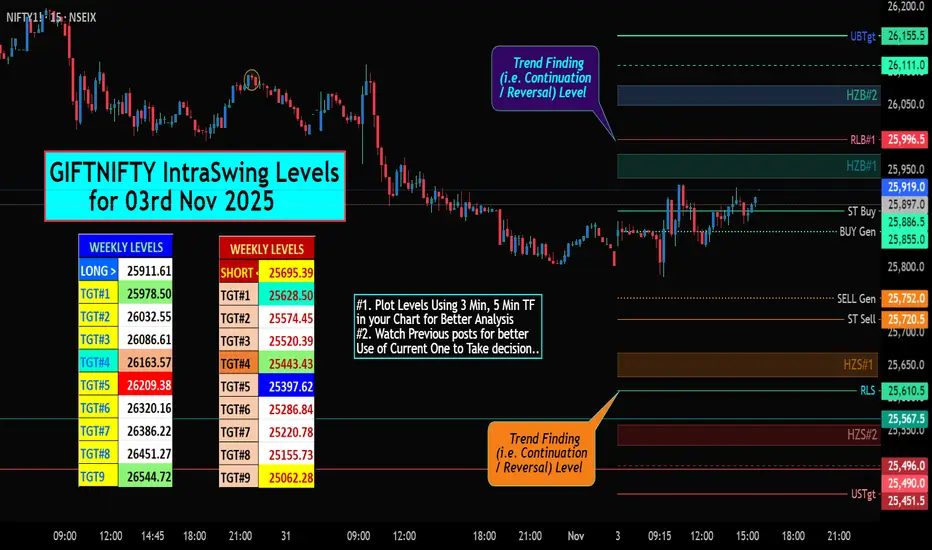
GIFTNIFTY IntraSwing Levels for 03rd Nov 2025✍🏼️ "WEEKLY Levels" mentioned in BOX format.
L#1: If the candle crossed & stays above the “Buy Gen”, it is treated / considered as Bullish bias.
L#2: Possibility / Probability of REVERSAL near RLB#1 & UBTgt
L#3: If the candle stays above “Sell Gen” but below “Buy Gen”, it is treated / considered as Sidewise. Aggressive Traders can take Long position near “Sell Gen” either retesting or crossed from Below & vice-versa i.e. can take Short position near “Buy Gen” either retesting or crossed downward from Above.
L#4: If the candle crossed & stays below the “Sell Gen”, it is treated / considered a Bearish bias.
L#5: Possibility / Probability of REVERSAL near RLS#1 & USTgt
HZB (Buy side) & HZS (Sell side) => Hurdle Zone,
*** Specialty of “HZB#1, HZB#2 HZS#1 & HZS#2” is Sidewise (behaviour in Nature)
Rest Plotted and Mentioned on Chart
Color code Used:
Green =. Positive bias.
Red =. Negative bias.
RED in Between Green means Trend Finder / Momentum Change
/ CYCLE Change and Vice Versa.
Notice One thing: HOW LEVELS are Working.
Use any Momentum Indicator / Oscillator or as you "USED to" to Take entry.
⚠️ DISCLAIMER:
The information, views, and ideas shared here are purely for educational and informational purposes only. They are not intended as investment advice or a recommendation to buy, sell, or hold any financial instruments. I am not a SEBI-registered financial adviser.
Trading and investing in the stock market involves risk, and you should do your own research and analysis. You are solely responsible for any decisions made based on this research.
"As HARD EARNED MONEY IS YOUR's, So DECISION SHOULD HAVE TO BE YOUR's".
Do comment if Helpful .
In depth Analysis will be added later (If time Permits)
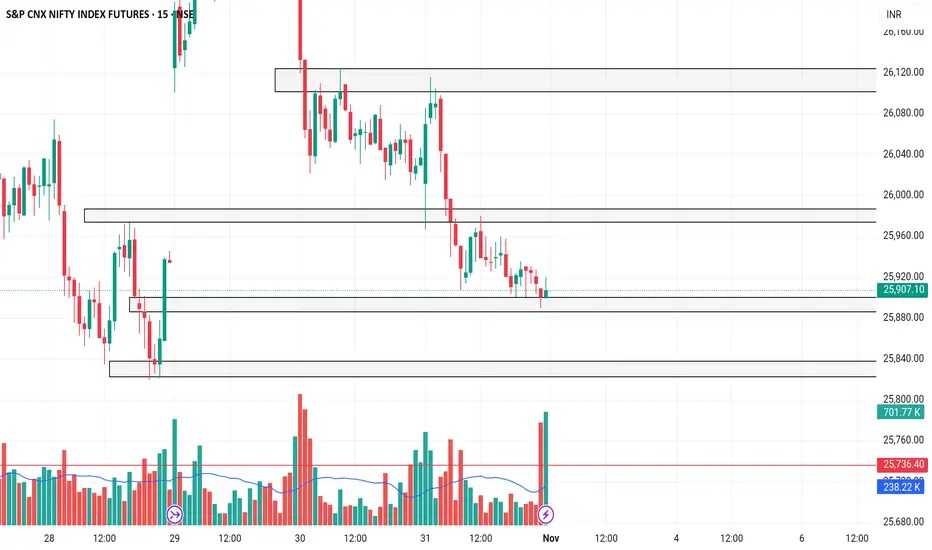
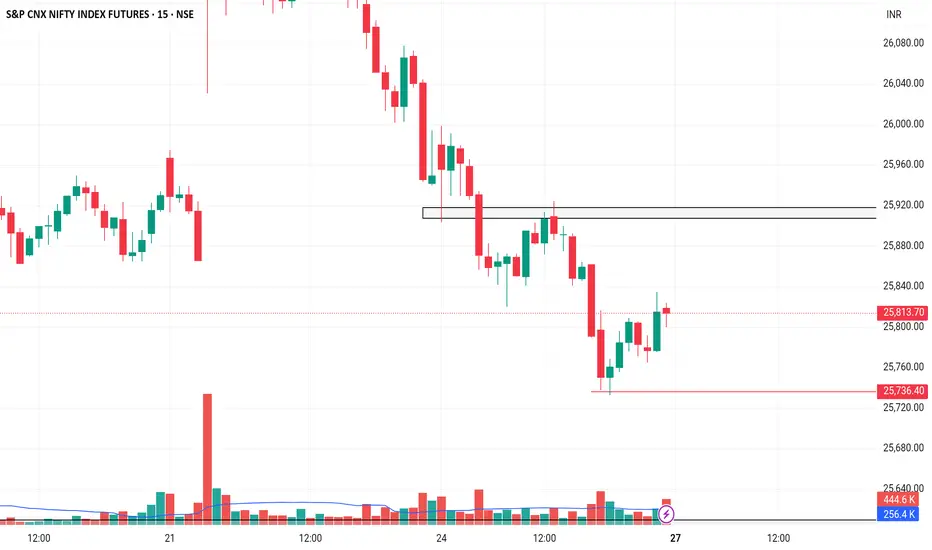
NIFTY gearing up for next up move.Tight consolidation just below the previous resistance level is a constructive sign for the bulls. This price action suggests that supply is present, but the bulls currently have enough strength to absorb it.
Key Levels:
Base Support: 25,770
Sprint Support: 25,510
Both supports are also aligned with the 50-day moving average and the prevailing trend line, reinforcing the bullish structure.
For existing positions, stay invested. There’s no need to add exposure unless you’re completing positions in underlying Nifty50 stocks where allocations are still incomplete.
Important: Avoid shorting.
Nifty has not yet shown any signs of weakness. While mild signs of supply are visible, the index has not reacted negatively — indicating continued bullish momentum .
The trend remains your friend — and the trend is firmly up.

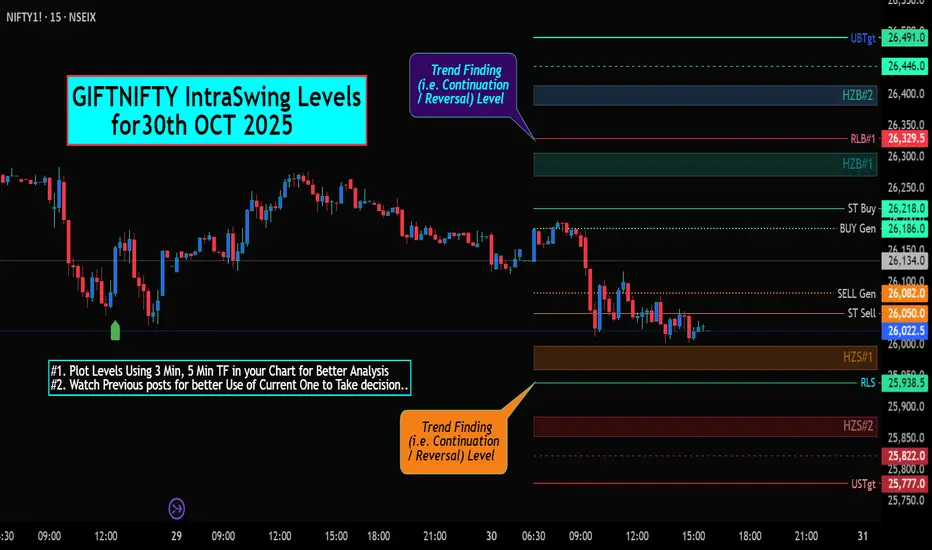
GIFTNIFTY IntraSwing Levels for30th OCT 2025🌡️Plot Levels Using 3 Min, 5 Min Time frame in your Chart for Better Analysis
L#1: If the candle crossed & stays above the “Buy Gen”, it is treated / considered as Bullish bias.
L#2: Possibility / Probability of REVERSAL near RLB#1 & UBTgt
L#3: If the candle stays above “Sell Gen” but below “Buy Gen”, it is treated / considered as Sidewise. Aggressive Traders can take Long position near “Sell Gen” either retesting or crossed from Below & vice-versa i.e. can take Short position near “Buy Gen” either retesting or crossed downward from Above.
L#4: If the candle crossed & stays below the “Sell Gen”, it is treated / considered a Bearish bias.
L#5: Possibility / Probability of REVERSAL near RLS#1 & USTgt
HZB (Buy side) & HZS (Sell side) => Hurdle Zone,
*** Specialty of “HZB#1, HZB#2 HZS#1 & HZS#2” is Sidewise (behaviour in Nature)
Rest Plotted and Mentioned on Chart
Color code Used:
Green =. Positive bias.
Red =. Negative bias.
RED in Between Green means Trend Finder / Momentum Change
/ CYCLE Change and Vice Versa.
Notice One thing: HOW LEVELS are Working.
Use any Momentum Indicator / Oscillator or as you "USED to" to Take entry.
⚠️ DISCLAIMER:
The information, views, and ideas shared here are purely for educational and informational purposes only. They are not intended as investment advice or a recommendation to buy, sell, or hold any financial instruments. I am not a SEBI-registered financial adviser.
Trading and investing in the stock market involves risk, and you should do your own research and analysis. You are solely responsible for any decisions made based on this research.
"As HARD EARNED MONEY IS YOUR's, So DECISION SHOULD HAVE TO BE YOUR's".
Do comment if Helpful .
In depth Analysis will be added later (If time Permits)
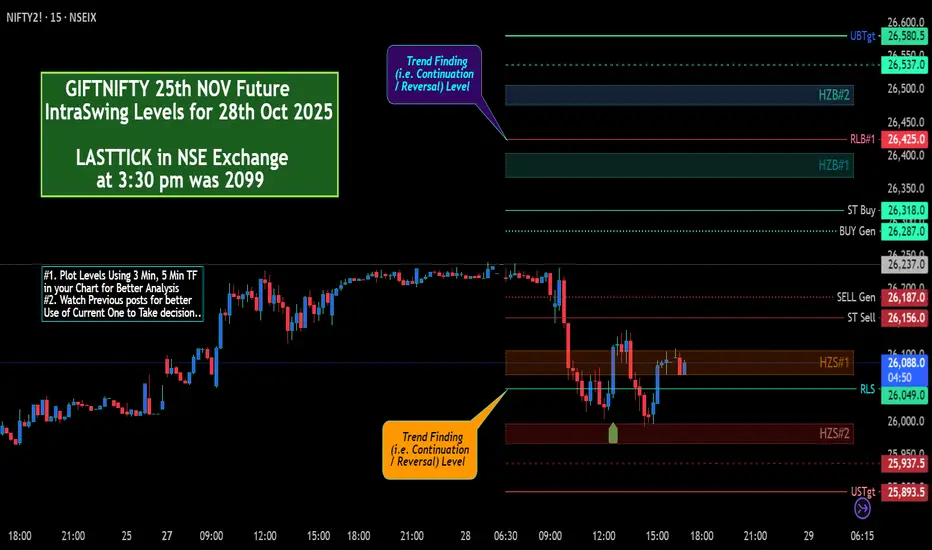
GIFTNIFTY 25th NOV Future IntraSwing Levels for 28th Oct 2025🚀 "WEEKLY Levels" mentioned in BOX format.
🌡️Plot Levels Using 3 Min, 5 Min Time frame in your Chart for Better Analysis
L#1: If the candle crossed & stays above the “Buy Gen”, it is treated / considered as Bullish bias.
L#2: Possibility / Probability of REVERSAL near RLB#1 & UBTgt
L#3: If the candle stays above “Sell Gen” but below “Buy Gen”, it is treated / considered as Sidewise. Aggressive Traders can take Long position near “Sell Gen” either retesting or crossed from Below & vice-versa i.e. can take Short position near “Buy Gen” either retesting or crossed downward from Above.
L#4: If the candle crossed & stays below the “Sell Gen”, it is treated / considered a Bearish bias.
L#5: Possibility / Probability of REVERSAL near RLS#1 & USTgt
HZB (Buy side) & HZS (Sell side) => Hurdle Zone,
*** Specialty of “HZB#1, HZB#2 HZS#1 & HZS#2” is Sidewise (behaviour in Nature)
Rest Plotted and Mentioned on Chart
Color code Used:
Green =. Positive bias.
Red =. Negative bias.
RED in Between Green means Trend Finder / Momentum Change
/ CYCLE Change and Vice Versa.
Notice One thing: HOW LEVELS are Working.
Use any Momentum Indicator / Oscillator or as you "USED to" to Take entry.
⚠️ DISCLAIMER:
The information, views, and ideas shared here are purely for educational and informational purposes only. They are not intended as investment advice or a recommendation to buy, sell, or hold any financial instruments. I am not a SEBI-registered financial adviser.
Trading and investing in the stock market involves risk, and you should do your own research and analysis. You are solely responsible for any decisions made based on this research.
"As HARD EARNED MONEY IS YOUR's, So DECISION SHOULD HAVE TO BE YOUR's".
Do comment if Helpful .
In depth Analysis will be added later (If time Permits)
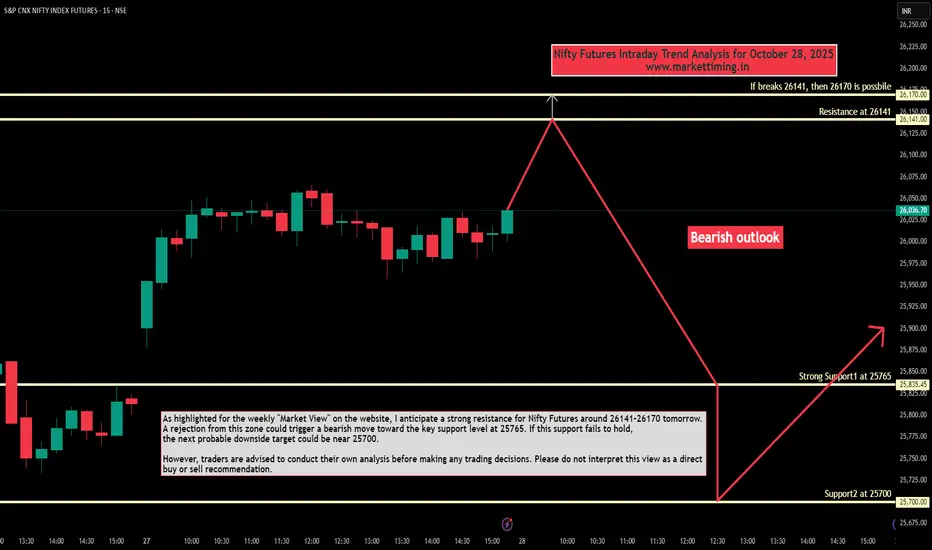
Nifty Futures Intraday Trend Analysis for October 28, 2025As highlighted for weekly "Market View" outlook on the website, I anticipate a strong resistance for Nifty Futures around 26141–26170 tomorrow. A rejection from this zone could trigger a bearish move toward the key support level at 25765. If this support fails to hold, the next probable downside target could be near 25700.
However, traders are advised to conduct their own analysis before making any trading decisions. Please do not interpret this view as a direct buy or sell recommendation.
NIFTYNifty l;evels aare based on imbalances
1. gapup 25975 long
2. 25975-25850 trade breakout
3. gapdown 25850 short

NIFTYNifty levels are based on imbalances
1. gapup 25850 long
2. 25850-25600 trade breakout
3. gapdown 25600 short
NIFTYNifty levels are based on imbalances
1. gapup 25700 long
2. 25700-25640 trade breakout
3. gapdown 25640 short

NIFTYNifty levels are based on imbalances
1. gapup 25450 long
2. 25450-25380 trade breakout
3. gapdown 25380 short
Nifty BullishExpert Nifty 50 Forecast: Target 27640 by Q4 FY26 (Dec 2025/Jan 2026) 📈
This analysis supports an upside target of for the Nifty 50 Index, expected to be realized in the December 2025 to January 2026 timeframe, which corresponds to the final quarter (Q4) of the Fiscal Year 2025-2026. This projection is fundamentally anchored in a persistent structural bull trend, augmented by specific technical and fundamental tailwinds.
________________________________________
Technical Rationale: Chart Patterns and Fibonacci Extension
The target of is justified through a combination of long-term trend analysis and Fibonacci projections:
1. Structural Long-Term Trend Channel (Weekly/Monthly Chart)
• Pattern: The Nifty 50 index continues to trade within a well-defined Rising Trend Channel on the long-term (Weekly/Monthly) charts. This pattern signals increasing optimism and sustained buying interest, which is characteristic of a healthy secular bull market.
• Implication: A continuous movement towards the upper boundary of this channel, driven by momentum, is the most probable path. The level aligns with a significant technical point along this long-term trajectory.
2. Fibonacci Extension Target
• Projection Tool: The target is derived using the Fibonacci Extension tool, applying it to a major previous impulse wave (e.g., from the COVID-19 lows to the most recent significant high, followed by a corrective wave).
• Key Level: The level is positioned in the vicinity of the to extension of the latest corrective phase. This zone often acts as a significant profit-booking and target level following a strong breakout continuation from a major consolidation pattern (such as a multi-month Symmetrical Triangle or a Flag/Pennant formation, which the index may be completing).
_______________________________________
Fundamental Drivers (Underpinning the Technical View)
The technical move is expected to be supported by the following macro factors:
• Earnings Growth: The primary catalyst is anticipated robust Nifty 50 Earnings Per Share (EPS) growth for FY26 (forecasts range from to ), driven by a recovery in private consumption and sustained capital expenditure.
• Monetary Policy Easing: Potential interest rate and CRR cuts by the Reserve Bank of India (RBI) in late 2025 would ease liquidity, boost credit growth, and make equity valuations more attractive.
• Global Flows: A moderation in global inflation and a potential easing of US Federal Reserve policy could lead to renewed, strong Foreign Institutional Investor (FII) inflows, providing the necessary institutional backing for the next leg of the rally.
________________________________________
Risk and Invalidation (Exit Strategy)
The bullish outlook remains intact as long as the Nifty 50 decisively holds above the critical long-term support zone.
• Key Invalidation Level: A sustained weekly close below the 24,000-24,300 level (corresponding to the break-out point of the long-term consolidation and the 50-WMA) would invalidate this strong bullish projection, signaling a deeper correction.
• Strategy: Maintain a "Buy on Dips" strategy, utilizing the 50-WMA as a medium-term trailing support. Initiate long positions with a target of 27,640, while managing risk diligently below the structural support.
